Probe position. (a,b) Paramedian sagittal (PS) view probe position – view from behind and above. (c,d) Paramedian sagittal oblique (PSO) view probe position – view from behind and above.
Sagittal views
The scanning starts with the PS view with the probe positioned over the sacrum. In infants the sacral segments are not fused and so the first sacral segment is identified by its dorsal tilt (Dick and de Bruyn, 2003). The L5–S1 junction is the point between the obliquely oriented first sacral vertebra and the horizontally oriented fifth lumbar vertebra (Figure 19.2). Close attention to this is important as estimation of interspinous space is dependent on this (in older children the sacrum may be identified as a continuous convex hyperechoic line).
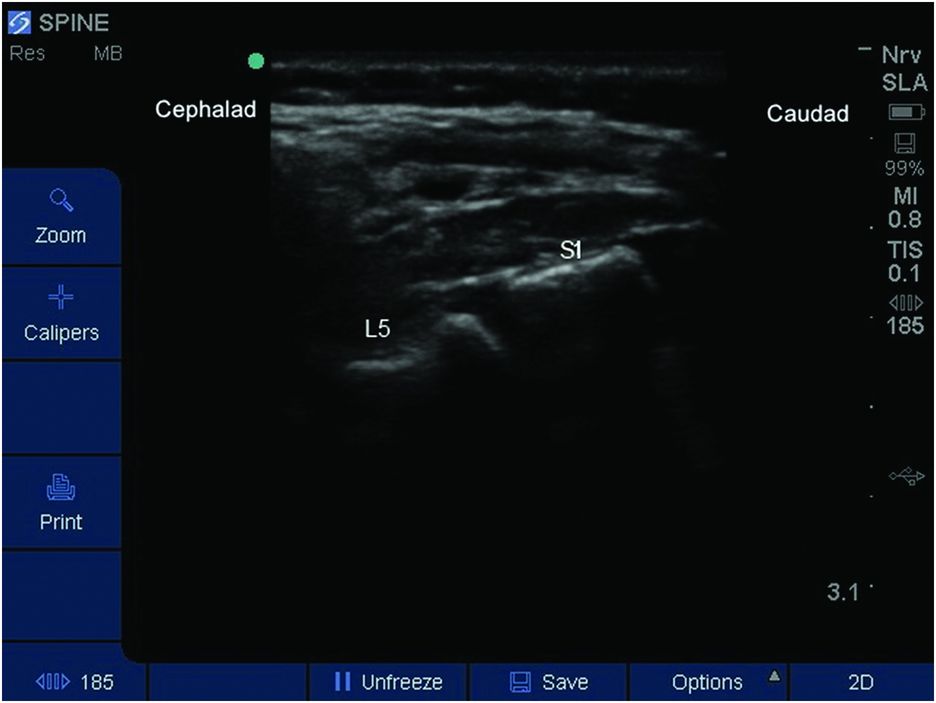
L5–S1 interlaminar view (3-month-old infant). Note the dorsal tilt of S1 vertebrae and horizontal orientation of L5 lamina.
Once the first sacral vertebra is identified then the probe is moved cephalad in the same orientation to identify the L5 and L4 laminae. Alternatively, the vertebral level may be determined by identifying the twelfth thoracic vertebra based on its articulation with the last rib, and thereafter moving the probe in a caudal direction. The first method tends to be more reliable (Deeg et al., 2007).
A slight angulation of the probe to point towards the midline improves the view of neuraxial structures through the interlaminar window. This is the paramedian sagittal oblique (PSO) view.
The structures typically seen in PSO view are (Figures 19.3 and 19.4):
1. Lamina
2. Posterior complex (PC) consisting of ligamentum flavum and posterior dura mater (in infants the dura mater is better visualized than ligamentum flavum).
3. Hypoechoic spinal canal
4. Filum terminale along with cauda equina (visualized better in infants where it is seen as closely related parallel lines extending from conus).
5. Anterior complex (AC) consisting of the anterior dura mater, posterior longitudinal ligament, and posterior surface of the vertebral body.
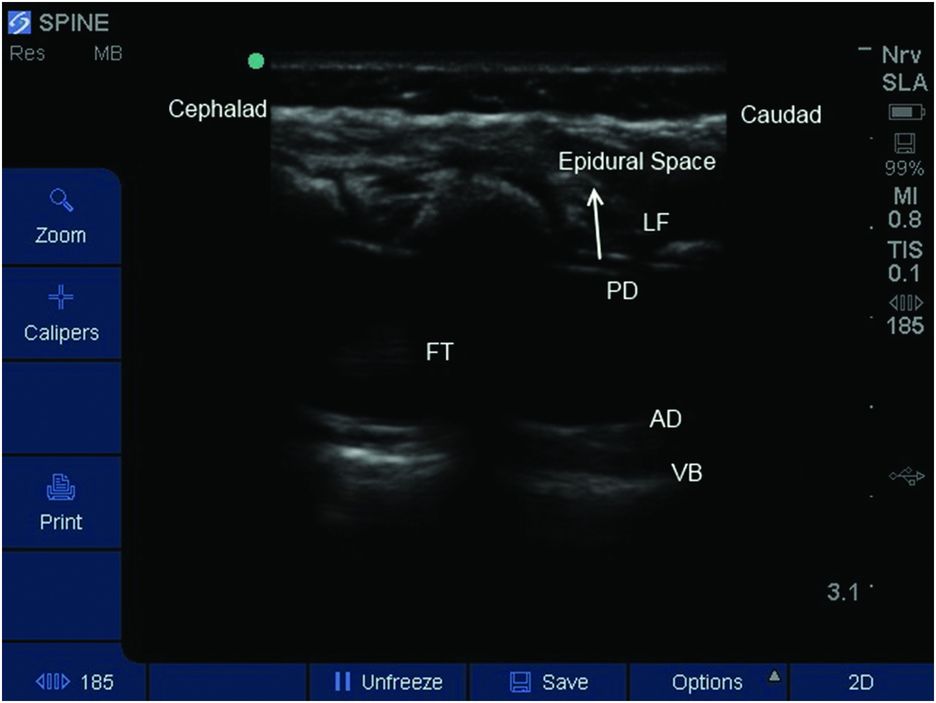
Paramedian sagittal oblique (PSO) view (3-month-old infant). AD, anterior dura mater; FT, filum terminale; LF, ligamentum flavum; PD, posterior dura mater; VB, vertebral body.
Probe marking from PSO view
Once the appropriate interlaminar space (L4–L5 or L5–S1) is identified for spinal anesthesia, the probe positions are marked. With the interlaminar space of interest in the middle of the ultrasound screen, the midpoint of the long border of the probe is marked on either side of the probe using a skin marker. As the ultrasound beam emanates from the middle of the probe, the midpoint between the two markings should correspond to the selected interspace.
Transverse median view
Following the skin marking in the PSO view, the probe is turned 90 degrees to obtain a transverse median (TM) view at the same level.
Structures seen when probe is placed directly over the spinous process include (Figure 19.5):
1. A superficial hyperechoic line of the spinous process.
2. Hyperechoic lamina on either side of the spinous process.
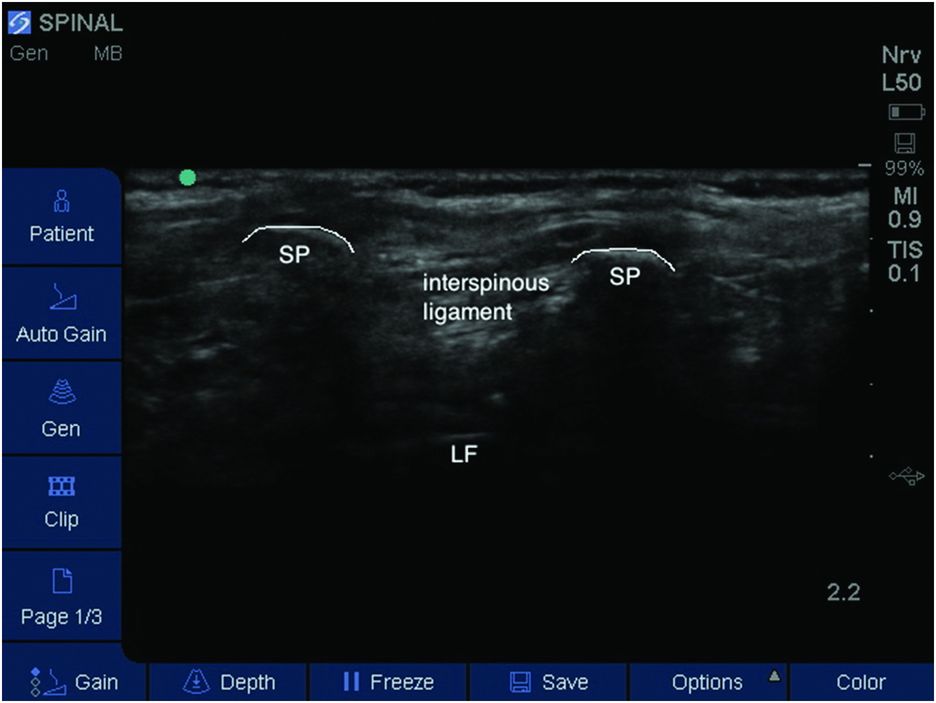
The probe is moved just below or above the spinous process, to lessen the acoustic impedance of interspinous ligaments compared to spinous processes. This window provides a clearer image of neuraxial structures which include (Figure 19.6):
1. Two hyperechoic lines are seen in the midline – this denotes PC and AC.
2. Two hyperechoic lines on either side of the midline – this represents the transverse process on either side (note at this level, as the probe is below the spinous process and lamina, the hyperechoic structures seen are the transverse process).
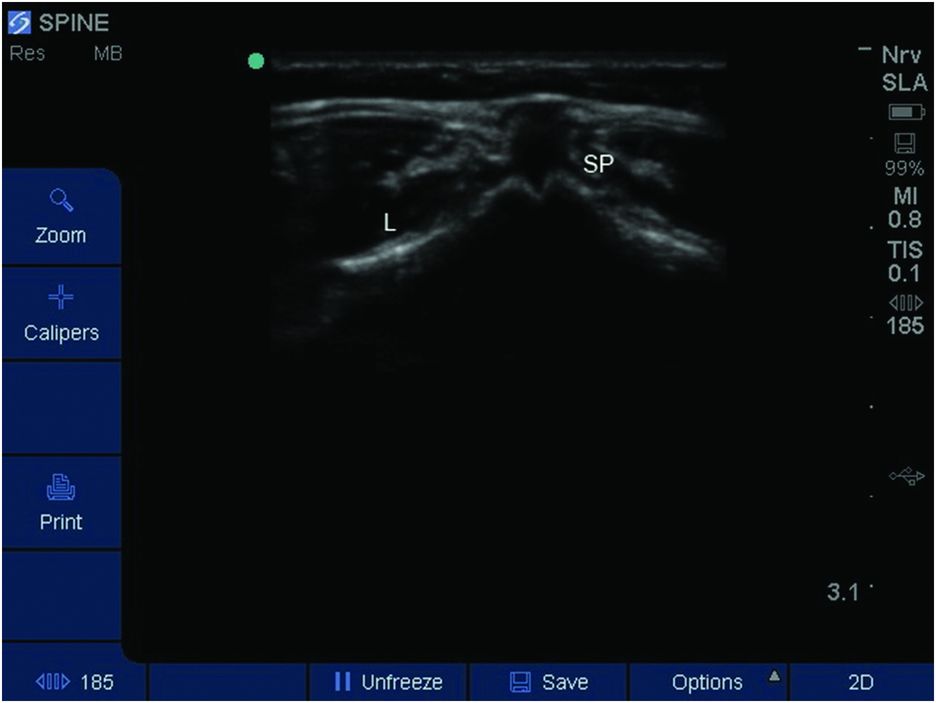
Transverse median (TM) view at the level of spinous process (3-month-old infant). L, lamina; SP, spinous process.
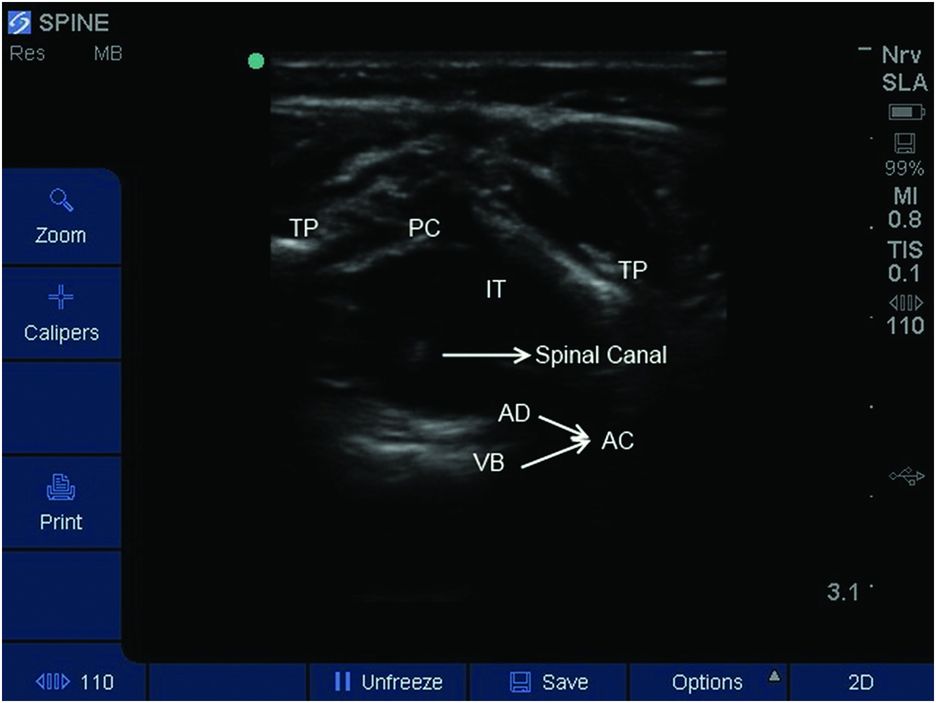
Transverse median (TM) view at interspinous space (3-month-old infant). AD, anterior dura mater; IT, intrathecal space; PC, posterior complex; TP, transverse process; VB, vertebral body. Note the spinal canal is seen as hyperechoic dot surrounded by hypoechoic spinal cord.
Probe marking for TM view
On obtaining the best view with the image positioned in the middle of the ultrasound screen, the midpoint of the sides of the probe and midpoint of the short ends of the probe are marked. The intersection of the two lines will provide the needle insertion point.
Block performance
In small children and infants, linear probes with a high frequency (7–13 MHz) are preferred to curvilinear (curved array) probes (Marhofer et al., 2005). A smaller probe (e.g. “hockey-stick” probes) may allow more accurate placement of skin markings. For older children, in whom the depth of the intrathecal space is greater than 4 cm, a curvilinear probe may be more suitable.
Although real-time ultrasound guidance for epidural catheter insertions in children has been previously described (Rapp et al., 2005; Willschke et al., 2006), a similar technique has not been studied for the administration of spinal anesthesia in children. In children, administering subarachnoid block using real-time ultrasound guidance might be possible; however, this area needs further research. The following description is for pre-procedural ultrasound with skin marking followed by performance of spinal anesthesia. The term “ultrasound assisted” is more appropriate than “ultrasound guidance.”
Ultrasound scanning can be performed with the child in the lateral decubitus or lateral position (with or without a 45-degree head-up tilt) or in the sitting position. Lateral decubitus position with 45-degree head-up tilt resulted in significantly higher incidence of successful dural puncture compared to lateral decubitus position alone (Apiliogullari et al., 2008) (Figure 19.7). In all three positions the assistant holding the child should ensure that the neck is maintained in a neutral position as flexion of the neck may lead to desaturation, bradycardia, and reduction in PaO2 (Spahr et al.,1981; Weisman et al.,1983; Fiser et al., 1993). Neck flexion does not improve the visibility but increases associated morbidity (Abo et al., 2010).
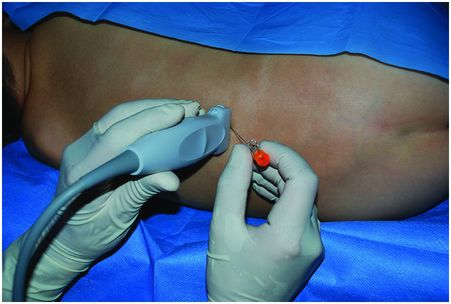
Patient position with slight neck extension. Transverse probe position.
There is no difference in the dimensions of the lumbar subarachnoid space when measured by ultrasound between the three positions (Lo et al., 2013). Use of the lateral flexed position results in an increase in the interspinous distance compared to a neutral position in children under 1 month of age (Cadigan et al., 2011). A sitting position with flexed hips also significantly increases the interspinous distance in children younger than 12 years (Abo et al., 2010).
Initial placement of the probe should be in PSO orientation in the sacrococcygeal area. Palpation of posterior superior iliac crest and sacral cornua should help to identify this. The intercristal line (Tuffier’s line) may correspond to L4–L5 or L3–L4 interspinous space but should be confirmed by ultrasound. Once the L4–L5 or L5–S1 interlaminar space is identified, skin markings are made as detailed earlier. The depth of the subarachnoid space from the skin (measured as the distance between the skin and the posterior complex) is noted. The probe is rotated 90 degrees to obtain the TM view at that same level. Once satisfactory images of the PC and AC are obtained, the image is positioned in the middle of the ultrasound screen, ensuring that the transverse processes are symmetrical. Cephalo-caudal angulation of the probe is performed to optimize the image of the posterior and anterior complex. In addition the mediolateral angle is adjusted to obtain a symmetrical view of transverse process on either side. Both of these angles should be recalled by the operator to inform needle trajectory. The depth of the subarachnoid space is also estimated. Finally the skin is marked around the probe as detailed above to identify the optimal needle insertion point.
On successful entry to the subarachnoid space, the calculated dose of LA is injected slowly (Table 19.1). In infants reliable assessment of block height can be difficult. The onset of motor block of the lower extremities can be seen early. Paralysis of the abdominal muscles can be seen when the child is coughing or crying. Tetanic stimulation by a peripheral nerve stimulator may also aid the assessment of block height (Rowney and Doyle, 1998). In older children, the loss of cold sensation can be used to estimate block height.
Related posts:
 Ultrasound-guided supraclavicular brachial plexus block
 Ultrasound-guided ilioinguinal/iliohypogastric block
 Ultrasound-guided transversus abdominis plane block
 Ultrasound-guided rectus sheath block
 Ultrasound-guided paravertebral block
 Anatomy of the neuraxis, thoracic and abdominal walls, upper and lower limbs
Stay updated, free articles. Join our Telegram channel

Full access? Get Clinical Tree


