Diabetes Mellitus
Carol Green-Hernandez PhD, ANP/FNP-C
Diabetes mellitus is a disorder of endocrine function that affects metabolic and circulatory mechanisms. As a chronic disease, diabetes mellitus is characterized by glucose intolerance and distortions in fat metabolism, caused by either relative or absolute insulin deficiency. These two kinds of insulin deficiency are used to categorize the two primary variants of diabetes: type 1 (formerly called insulin-dependent diabetes [IDDM]) and type 2 (formerly called non-insulin-dependent diabetes [NIDDM]). This chapter will discuss each disease variant and current management strategies. Screening for and diagnosis of gestational diabetes is discussed within the context of type 2 disease; pregnancy management will not be covered, as it falls outside the parameters of this text. Screening, diagnosis, and management of other types of diabetes are also beyond the scope of this chapter, so their diagnosis and management will not be discussed. These include diabetes that occurs because of genetic defects of the beta cell; other genetic syndromes associated with diabetes (such as Down, Klinefelter, and Turner syndromes); immune-mediated diabetes; diseases of the exocrine pancreas secondary to pancreatic trauma, infection, or disease; and drug- or chemical-induced diabetes.
ANATOMY, PHYSIOLOGY, AND PATHOLOGY
Because type 1 differs so completely from type 2 diabetes, as well as from impaired glucose tolerance (IGT), the anatomy and physiology of each will be reviewed in turn. Maturity-onset diabetes of the young (MODY, or type 3) will also be presented.
Type 1 Diabetes
Type 1 diabetes is highly correlated with absence of insulin secretory reserve. This lack of a secretory reserve is derived from beta-cell destruction by glutamic acid decarboxylase antibodies. This is an autoimmune process; therefore, type 1 disease is classified as immune-mediated diabetes. It is one of two variants of type 1 disease. The second variant of type 1 diabetes is idiopathic, meaning that there are several forms whose etiologies are not all known. Idiopathic type 1 diabetes lacks an autoimmune cause of beta-cell destruction. Diabetes that results from cystic fibrosis exemplifies idiopathic type 1 diabetes. Like immune-mediated type 1, idiopathic diabetes also is characterized by absence of insulin secretory reserve. Patients with both variants of type 1 diabetes are prone to ketoacidosis (American Diabetes Association [ADA], Report of the Expert Committee, 1997).
Type 2 Diabetes
Type 2 diabetes is a polygenic disease characterized first by insulin resistance, leading to compensatory hyperinsulinemia (Service et al, 1997). At this time in the development of type 2 diabetes, the blood glucose level is normal, but high levels of insulin disrupt lipid metabolism. As the resistance increases, compensatory hyperinsulinemia cannot keep up, so the blood glucose level rises. At levels of 140 mg/dL or more, the glucose is toxic to the beta cell and to the sites where insulin works. Eventually, absolute hyperinsulinemia becomes relative hypoinsulemia. Exogenous insulin administration cannot override the body’s insulin resistance at this stage.
Abnormalities in hepatic glucose output are a secondary outcome rather than a primary cause of type 2 disease. Small amounts of insulin prevent hepatic glucose output. Much larger amounts of insulin are required to dispose of postprandial glucose loads. Although increased glucose output can complicate the course of type 2, abnormalities in hepatic glucose metabolism are reversible with adequate disease management (Olefsky, 1997).
This process can continue for some time, even several years, before the overt onset of type 2 disease. Persons at this stage of metabolic challenge may have normal glucose tolerance, or only IGT. This is an insulin-resistant state, but one for which there is metabolic compensation. Eventually, about 7% of persons with IGT develop type 2 diabetes in the United States every year. Who will develop this disease depends on several often interrelated factors, including genetic predisposition, ethnic heritage, overall health, and lifestyle. The onset of diabetes does not end its progression. If not diagnosed and adequately treated, type 2 diabetes will inexorably worsen, leading to complications and requiring more complex antidiabetic medication regimens. Some patients also see their disease progress through beta-cell destruction, thus bringing endogenous insulin secretion to a grinding, permanent halt.
Mouse research suggests that the genetic abnormalities seen in type 2 diabetes are themselves nondiabetogenic. Their coexistence in a person, however, can lead to the development of overt diabetes (Terauchi et al, 1997). Ongoing poor glycemic control places humans at risk for eventual diminishment of endogenous insulin secretory capacity. This problem is compounded by the concomitant decrease in beta-cell insulin content. The outcome is a marked decrease in insulin mRNA. This means that genetic transcription for insulin is suppressed in the chronically overstressed beta cells of type 2 if glycemic control
is poor. Over time, the outcome may include glucose toxicity. Glucose toxicity is found in the type 2 beta cell when glycemic control is poor. Hyperglycemia is the outcome and leads to decreased sensitivity of the beta cells to normal glucose stimulation (Olefsky, 1997).
is poor. Over time, the outcome may include glucose toxicity. Glucose toxicity is found in the type 2 beta cell when glycemic control is poor. Hyperglycemia is the outcome and leads to decreased sensitivity of the beta cells to normal glucose stimulation (Olefsky, 1997).
Yet another problem derived from poor glycemic control is lipogenesis. Lipogenesis includes elevation in levels of plasma free fatty acids, with attendant compromise in protein kinetics and overall cellular metabolism. The ultimate result is lipotoxicity, in which free fatty acid elevation progresses to beta-cell dysfunction. This process leads to a disruption in the glucose–insulin process, which is normally one of glucose stimulus followed by insulin response (Boden, 1997; Gougeon et al, 1997; Matsuoka et al, 1997; O’Rourke et al, 1997). Figure 17-1 illustrates the transition from insulin resistance to type 2 disease.
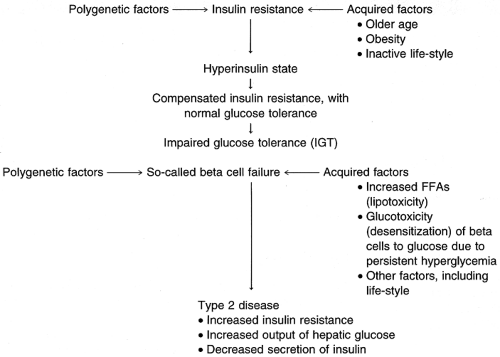 FIGURE 17-1 From insulin resistance to Type 2 diabetes mellitus. (Adapted from Olefsky, J.M. [1997]. Pathophysiology of type 2 diabetes. Secaucus, NJ: Professional Postgraduate Services. ) |
Human research suggests that the antecedents to insulin resistance in adulthood are not always the outcome of obesity or of aging. Lack of subcutaneous tissue at birth (ie, neonatal thinness) is associated with delayed activation of glycolysis as well as of glycogenolysis in adulthood. In exercising adults, it appears that this delay in providing for anaerobic metabolism results in an increase in muscle’s reoxygenation rate. Only then can muscles anaerobically promote ATP synthesis. This process acts as a compensatory mechanism for the altered muscle microcirculation that developed because of neonatal thinness (Thompson et al, 1997).
CLINICAL PEARL
The outcome of delayed glycolysis and glycogenolysis in persons with very low birth weight (ie, lacking in subcutaneous tissue) means that they face increased risk of insulin resistance and, hence, type 2 disease in adulthood. Providers need to be cognizant of this risk in patients whose birth weight was very low and must apprise them of health-promoting activities that may help them to delay or avoid type 2 diabetes.
Impaired Glucose Tolerance
IGT defines impaired glucose homeostasis. This stage is not true type 2, but it is also not normal metabolism. IGT can actually be viewed as an early point on a continuum in the development of type 2 diabetes. When identified in a fasting specimen, IGT is comparable to impaired fasting glucose. Whether IGT or overt type 2 diabetes, glucose metabolism is a continuum that balances glycemic control with insulin response. Certainly, increased glucose levels are associated with microvascular complications such as retinopathy. Also, macrovascular (or large vessel) disease is the outcome of increased glucose as well as insulin levels (Sobel, 1997). Increased insulin response to glycemic loading in the nondiabetic state can serve to predict future type 2 and is clearly associated with macrovascular disease. Macrovascular complications include arteriosclerotic heart disease. Heart disease, hypertension, and coronary artery disease are seen in so-called syndrome X.
Syndrome X presents with significantly increased insulin levels that do not respond to the body’s normal control mechanism of raising glucagon levels. Hyperinsulinemia is implicated in the disruption of normal fat metabolism, with elevation of total cholesterol levels, lowering of high-density lipoprotein cholesterol levels, undesirable elevation of low-density lipoprotein cholesterol levels, and elevation of serum triglyceride levels. Obesity and physical inactivity aggravate this process. Hyperinsulinemia also leads to blood vessel proliferation and, concomitantly, damage to vessel intimae. Atherosclerotic occlusion can be the end result of this process (Chaiken et al, 1993; DCCT Research Group, 1993b).
CLINICAL WARNING
In nondiabetics, both micro- and macrovascular diseases are seen as outcomes of increased serum glucose and insulin levels. These elevations commonly accompany normal aging, so their monitoring is the key to diabetes prevention in patients over age 55.
Maturity-Onset Diabetes of the Young
MODY, sometimes referred to as type 3 diabetes, is an autosomal dominant inherited disorder often mistakenly diagnosed as either type 1 or type 2. MODY is in fact neither purely type 1 nor type 2. It is a disorder of impaired insulin secretion without its absolute absence. Persons with MODY show no morphologic evidence of the glutamic acid decarboxylase antibodies characteristic of type 1. Nor is MODY characterized by any sign of the insulin resistance syndrome that is a hallmark of type 2 diabetes.
Providers can expect that further subphenotypic classification of diabetes variants will occur eventually (Lehto et al, 1997). That MODY’s insulinemia may have a genetic underpinning is important information. This suggests that treatment methods will need to be better individualized if patients are to be supported in preventing or at least delaying complications of this disease.
Pregestational Diabetes
Pregestational diabetes is of concern to the woman with diabetes who is considering pregnancy, as well as to her primary care provider. Providers for fertile women with diabetes must inform them of the necessity for euglycemic control before becoming pregnant. This means encouraging such patients to keep blood sugar levels within the normal, nondiabetic range throughout the day. It has been demonstrated that abnormal blood sugar levels are teratogenic even before a woman knows that she is pregnant. If taking oral medication for her diabetes, any woman who plans to become pregnant should be managed on insulin to prevent possible fetal exposure to the chemicals in oral agents (Buchanan, 1997). Management of this variant is not a focus for this text.
Gestational Diabetes
Gestational diabetes also is not a focus for this text, although part of the provider’s responsibility in primary care is to inform all fertile women of the importance of a healthy lifestyle before pregnancy. This lifestyle includes developing and maintaining well-rounded eating habits and active exercise patterns. These prevention activities will serve all women in good stead, including those who later decide to become pregnant.
Pathology of Complications Seen in Diabetes
OXIDATIVE STRESS AND ANTIOXIDANTS IN TYPE 2 DIABETES
Hyperglycemia sets cell walls up for disequilibrium, with the result that they undergo lipid peroxidation and accumulation of its end product, malondialdehyde. This process of lipid peroxidation is, simply, one of rancidification, wherein reactive oxygen species (ie, free radicals) are released at a rate that exceeds normal antioxidants’ abilities to combat them. These free radicals ensure that the cell’s metabolism will continue in chaos. Such chaos means that ATP formation and enzymatic pathway synthesis of proteins are compromised. Lipid peroxidation and its associated malondialdehyde accumulation also can turn on the protein glycation process.
Whether oxidative stress is a factor in type 2 diabetes is still being debated. There is a lack of reliable radical-trapping tools for assaying such stress. Research results are beginning to accrue, however, as testing methods for oxidative stress have become more reliable. Lowered antioxidant defenses of vitamins E and C in type 2 diabetes have been demonstrated in tissues, including those of the retina (Ceriello et al, 1997; Kowluru et al, 1997). Research has demonstrated that exogenous supplementation with vitamins C and E can block this process by inhibiting the formation of malondialdehyde, although specific dosage guidelines for vitamin E have not yet been established (Jin & Palmer, 1997; Kowluru et al, 1997). Chapter 5 provides guidelines for vitamin supplementation.
When euglycemia is restored in type 2 diabetes, reactive oxygen species production is reduced to normal. Research suggests that euglycemia not only protects against lipid peroxidation and its consequences, but can minimize or perhaps even mitigate against the clinical complications of diabetes as well (Kristal et al, 1997; Peuchant et al, 1997).
VASCULAR CHANGES
Flow-mediated dilation of blood vessels is impeded in the presence of hyperglycemia in type 2 disease. The reasons underlying this impedance were demonstrated by Jin and Bohlen (1997), who examined the intestinal mucosa in a rat model. Normally, blood flow is supported by the ongoing release of nitric oxide, which helps to maintain dilation and, thus, mucosal blood flow. In acute hyperglycemia, depressed acetylcholine release also decreases vasodilatory capacity, with the consequence that endothelial regulation is compromised. This compromise leads to an impairment of normal arteriole responsiveness to acetylcholine and a significant suppression in oxygen consumption.
RETINOPATHY
Glycemic control affects the incidence of microvascular retinopathies in type 1 disease as well as maculopathies in type 2 disease. Microvascular changes can in fact be found relatively early in the course of type 1 disease when glycemic control has been poor. Research suggests that the frequency and incidence of retinopathy can be reduced in type 1 disease with adequate glycemic control from the time of diagnosis (Klein et al, 1997). Specifics of pediatric control, especially for children under age 5, are outside the focus of this text.
Researchers examining the relation between anemia and retinopathy in diabetic subjects in Finland found that persons with diabetic retinopathy were at risk for severe retinopathy if they also had normocytic anemia. They then surmised that people who had diabetes and had normocytic anemia are at an increased risk of developing diabetic retinopathy, particularly of the severe type (Qiao et al, 1997).
EPIDEMIOLOGY
More than 16 million Americans have diabetes. No race, no ethnic group, and neither gender can claim exemption from this disease. Persons of all lifestyles—vegans or carnivores, smokers or not—are affected. Persons under 30 who become diabetic are more likely to develop type 1 diabetes or, to a lesser extent, MODY. People over age 30 are more likely to develop type 2 rather than type 1 disease. Less than 2% of people will develop type 2 diabetes before the age of 45. The prevalence
increases at that point to 8% until age 54. Between age 55 and 64, the level rises to 12% and to 18% between 65 and 74 years.
increases at that point to 8% until age 54. Between age 55 and 64, the level rises to 12% and to 18% between 65 and 74 years.
Type 1 diabetes is more common in Caucasians of northern European heritage. Conversely, these persons have a lowered incidence of type 2 diabetes. Native North Americans have the highest level of type 2 disease; of these, members of the Southwestern desert tribes carry the greatest risk, particularly the Pima. Both lifestyle and ancestry seem to play an important role in diabetes onset in Native North Americans. Alaskan Native peoples, including the Inuit, report rates of 1% to 2%. Compare this relatively low incidence to that of the Pima of Arizona, whose reported prevalence rates stand at 50%. African Americans, Asian Americans, and Hispanic Americans have an incidence rate for type 2 disease 1.5 to 2 times that of whites of non-Hispanic European heritage. Further, the age at which diabetes occurs is lower in at-risk ethnic groups than for people of lesser ethnic predisposition (National Center for Health Statistics, 1993; Banerji et al., 1993a, b).
Overall, prevalence rates for type 2 diabetes have increased in the United States more than sevenfold what they were in the 1950s. This contrasts with the 50% to 80% increase in diagnosis of type 2 disease since the 1960s. Between 1991 and 1993, about 3% of the U.S. population stated they had diabetes (Harris, 1995). This figure represents only the tip of the iceberg, because screening data of a representative sample of people without known disease during this same period uncovered on average one unknown case for every diagnosed one, making 6% a more accurate figure. This translates to at least 1 in 17 people, or 15 million Americans—and half of this number are not diagnosed.
Ninety percent or more of diabetic cases are of the type 2 variant. The prevalence of diabetes is greatest after age 65, and people are now living long enough to develop type 2 disease (Kenny et al, 1995). This suggests that providers should actively add diabetes prevention to their management of nondiabetic patients.
The incidence of diabetes continues to rise in other Western countries as well, including among non-Western peoples. Lifestyle factors, including Western eating habits, obesity, sedentary occupational and recreational habits, and cigarette smoking, are likely culprits (Expert Committee, 1997; Harris et al, 1997; Ko et al, 1997; El-Kebbi et al, 1996; Hanson et al, 1996; Zaldivar & Smolowitz, 1994).
In the case of type 1 disease, infant exposure to bovine antigens and perhaps other environmental stimuli may account for its incidence in genetically susceptible children (Harris et al, 1997; Chaturvedi et al, 1996; Connolly & Kesson, 1996; Roshan et al, 1996; Schraer et al, 1996). In addition to the earlier-described risk factors, prenatal influences that lead to premature delivery or very low birth weight have been implicated in adult onset of type 2 diabetes (Thompson et al, 1997).
DIAGNOSTIC CRITERIA
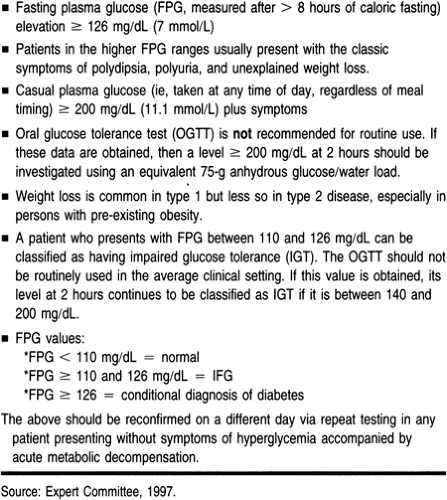
A suspected diagnosis of diabetes mandates further investigation by the primary care provider. The provider should consider a diagnosis of diabetes when a patient presents with any of the findings outlined in Table 17-1.
HISTORY AND PHYSICAL EXAMINATION
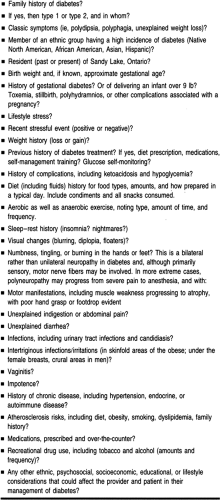
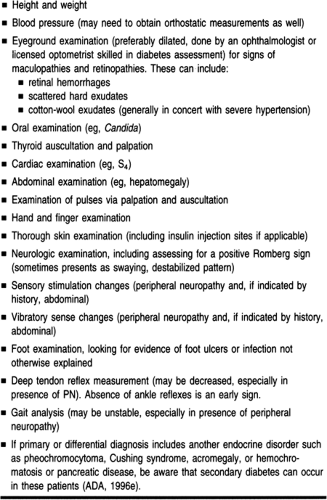
The primary care provider’s history and physical examination should be thorough and careful if diabetes is to be diagnosed in a timely manner. History and physical data can alert the provider that a patient with other risk factors also risks glucose intolerance. Glucose intolerance can begin as impairment, but carries with it the risk of later overt diabetes. Table 17-2 presents questions specific to diabetes risk. Table 17-3 lists specific additional areas for physical examination that are indicated when screening for diabetes, as well as when providing ongoing care for the patient with diagnosed disease. It is important to note that 15% of patients already have evidence of complications at the time of diagnosis; these include retinopathy or neuropathy (DCCT Research Group, 1993b).
DIAGNOSTIC STUDIES
The means for diagnosing diabetes have been modified from previous recommendations (Expert Committee, 1997). These include preferred diagnosis by means of fasting plasma glucose (FPG), although other blood tests can also be used. Testing is not recommended for type 1 disease in patients who are healthy and who do not carry autoimmune risk. Patients age 45 and above should be screened for type 2 diabetes regardless of whether they are symptomatic. If the results of the screening FPG are normal, and in the absence of subsequent development of risk factors or diabetes symptoms, patients should continue to be screened at 3-year intervals, lifelong. More frequent testing should be considered in patients who are under 45 and who:
Are obese (≥120% of desirable weight, or body mass index ≥27 kg/m2)
Report a first-degree relative who had diabetes
Are members of an ethnic group at high risk for diabetes (Native North American, African American, Asian American, or Hispanic American)
Were diagnosed with gestational diabetes mellitus or delivered a baby over 9 lb
Have high blood pressure (≥140/90 mmHg)
Have a high-density lipoprotein cholesterol level of 35 mg/dL or less or a triglyceride level of 250 mg/dL or more
Most case of diabetes can be diagnosed based on FPG, casual plasma glucose, or 2-hour plasma glucose. The oral glucose tolerance test (OGTT) can still prove useful in uncovering subclinical diabetes and, especially, insulin resistance in asymptomatic cases. The control exerted in the typical OGTT is not absolute; the test can be affected by a variety of factors, including smoking and stress. Still, the OGTT has value in uncovering patients otherwise at risk for subsequent diabetes and heart disease. This factor makes the OGTT a reasonable tool for the provider who questions the normalcy of a patient’s overnight fasting or random blood work (McCance et al, 1994).
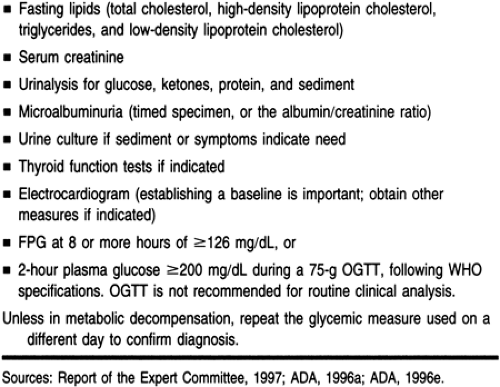
Table 17-4 presents specific laboratory tests to order when diabetes is suspected, as well as glycemic values for diagnosing the disease itself. Note that the FPG value (confirmed by repeating
the analysis) is the preferred testing method for diagnosis of diabetes mellitus as well as for impaired glucose homeostasis. The hemoglobin A1c (HbA1c) and any other glycosylated hemoglobins (GHBs) are not recommended for diagnostic testing. Because of the lack of standardization of these assays, GHBs are most reliably used as a measure to assess glucose deviations above normal over time.
the analysis) is the preferred testing method for diagnosis of diabetes mellitus as well as for impaired glucose homeostasis. The hemoglobin A1c (HbA1c) and any other glycosylated hemoglobins (GHBs) are not recommended for diagnostic testing. Because of the lack of standardization of these assays, GHBs are most reliably used as a measure to assess glucose deviations above normal over time.
As illustrated in Table 17-4, the provider who uncovers an FPG at about 126 mg/dL or greater on two different testings in a nonpregnant patient is advised to engage the patient in diabetes management. Although these guidelines seem more stringent than before, their strictness is supported by the presence of complications in 15% of those with FPG levels of 120 to 126 mg/dL (DCCT Research Group, 1993a, b).
Gestational Diabetes
The criterion for diagnosing gestational diabetes is considerably lower and, as recommended by Jovanovic-Peterson and Peterson in 1992, can be determined when the FPG on the OGTT is 90 mg/dL or higher after 100 g, not 75 g, of oral glucose. This recommendation is considerably more stringent than that currently advised by many obstetric sources, which stipulate that fasting rates that exceed 130 mg/dL should be considered as a reasonable screening criterion for gestational diabetes. The rationale for recommending the much lower range for screening of gestational diabetes comes from the latest research statistics, which indicate that fasting levels that exceed 90 mg/dL can have serious consequences for the developing fetus.
The new recommendations advise that screening be selective rather than universal for glucose intolerance in pregnancy. Women at low risk for such intolerance as well as for overt gestational diabetes include those who:
Are under 25 years
Are of normal weight
Have no first-degree relatives with diabetes
Are not a member of an ethnic group as previously identified (National Center for Health Statistics, 1993).
TREATMENT OPTIONS, EXPECTED OUTCOMES, AND COMPREHENSIVE MANAGEMENT
Treatment Options for Syndrome X
The clinical treatment of all factors seen in syndrome X, including hypertension, coronary artery disease, heart disease, and dyslipidemia, can be found in their respective chapters. The current discussion will focus on treating the diabetes component only.
Treating Diabetes
Whether type 1 or type 2, diabetes is characterized by consistent elevation of the blood glucose level and, in type 2, insulin resistance. Primary care management ideally leads to normalization of blood glucose and, if possible, improved glucose response to endogenous insulin in type 2 diabetes. The goal of treatment is not so much to control the disease but rather to prevent or decrease complications arising from the damaging effects of chronic hyperglycemia. Sound management plans arise from appropriate treatment options, and so lead to individualized plans of care that can maximize positive outcomes for a patient. For this reason, the following discussion will present various treatment options appropriate in different clinical circumstances. This discussion will be framed by appropriate management plans whose foci are optimal outcomes.
Matching Diagnosis to Treatment and Management
When symptoms of polydipsia, polyuria, and polyphagia present themselves, current diagnostic guidelines support making a clinical diagnosis of type 2 disease based on a single blood glucose measurement. This is true even in the absence of weight loss, which is more typical of type 1 than most variants of type 2 disease. The glucose need not be fasting. Specifics for each kind of glucose measurement should correspond with the values presented in Table 17-4 (ADA, 1997). If diabetes is not confirmed but is still suspected, then the provider can obtain an OGTT (ADA, 1997; Stolk et al, 1995).
When discussing treatment options with the patient, the effective primary care provider recognizes the importance of ethnic and cultural influences. This recognition begins before planning interventions. Food customs and eating rituals differ from family to family. Specific ethnic or lifestyle habits greatly influence diet and meal planning. Similarly, cultural beliefs and values surrounding the body and perceived self-harm will influence the patient’s level of participation in self-monitoring and medical therapies. The primary care provider must inquire about and respect cultural influences, customs, beliefs, and values. This perspective is especially important when a patient’s cultural, religious, or ethnic background, or even lifestyle, differs from that of the provider.
Developments in self-care education and pharmaceutical advances have revolutionized the potential for healthy outcomes
for people with diabetes. The Diabetes Complications and Control Trial (1993a) provided firm evidence that optimal control of blood glucose, defined as HbA1c of 7.4% or less, can delay or prevent long-term complications of diabetes. Further, any level of improved control will decrease complication rates.
for people with diabetes. The Diabetes Complications and Control Trial (1993a) provided firm evidence that optimal control of blood glucose, defined as HbA1c of 7.4% or less, can delay or prevent long-term complications of diabetes. Further, any level of improved control will decrease complication rates.
The 1997 report from the Expert Committee on the Diagnosis and Classification of Diabetes Mellitus goes a step further, setting target goals of 80 to 120 mg/dL for FPG, bedtime glucose 100 to 140 mg/dL, and GHB (HbA1c) of less than 7%. Newer pharmacologic interventions and insulin delivery systems can be combined to achieve these goals. Diabetes educators have developed curricula and teaching tools to help patients control their diabetes. Both patient and provider must continue to update their understanding of this disease.
The purpose of this section is to present the most current standards of practice in a clear and practical way. This information can be used to frame a plan of care that helps the patient with diabetes to obtain optimal metabolic control. Hyperglycemia must be eliminated to control the progression of diabetes as well as to delay or prevent complications, including micro- and macrovascular problems. These two problems will be discussed later in this chapter.
Goals of Diabetes Management
The immediate treatment goals in diabetes management include the achievement of optimal glycemic control based on HbA1c of 7.4% or less and the absence of hypoglycemic episodes requiring assistance to treat. The overall goals of diabetic management are also two in number: correction of metabolic irregularities and prevention of micro- and macrovascular complications.
Achievement of these goals depends on maintaining the target blood glucose level. If frequent high and low blood sugar levels are encountered in the face of desirable HbA1c, efforts must be made to smooth out glycemic control. Self-monitoring of blood glucose (SMBG) is critical to the success of this effort. SMBG and other components of diabetes management will be discussed after the following section, as lifestyle assessment is an important first step in managing blood glucose.
Lifestyle Assessment and Intervention
The importance of understanding the patient’s activities of daily life cannot be overstated. Included in this assessment are meal planning, hours of sleep and activity, and variations in activities on a day-to-day, weekly, and seasonal basis. The provider also needs to assess the patient’s educational level, employment, household, and potential for community support. Cultural and ethnic practices and religious beliefs may play an important role in health decisions, food choices, times for ritual fasting, and celebrations (Magnus, 1996). Family habits and customs also may affect the patient’s self-management of diabetes. Ascertaining insurance status is important, as this often determines whether the patient has access to both primary care and specialty providers, support services, medication, and supplies.
It may prove helpful to have the patient complete a simple but thorough lifestyle assessment inventory. Appendix 1 presents a sample tool for lifestyle assessment. Ideally this intake could be reviewed by other office personnel, who could then assist the patient in completing written details if necessary. The tool may also help assess the patient’s literacy capabilities and visual acuity.
Lifestyle assessment can help the provider decide what to teach and how to teach it. Acting on these assessment data can help ensure that people with diabetes have sufficient and specific education to facilitate self-management. Providing diabetes education can be done effectively either in individual or group sessions (Arseneau et al, 1994; Hirsch et al, 1995).
A Certified Diabetes Educator (CDE) can assist the primary care provider in developing successful intervention strategies for patient teaching. The CDE is a nationally accredited role for professionals who have completed an extensive course of study through the American Diabetes Association. Most commonly, the CDE is a professional nurse (either BSN or MSN), a physician (MD or DO), a nutritionist (RD), or a social worker (MSW). The CDE has emerged as the recognized consultant for or provider of diabetes education. As a source of knowledge to the patient as well as the provider, CDEs are increasingly drawn into the patient–provider relationship. CDE services are often treated as reimbursable by third-party payers. Further information about CDEs as a resource is provided in the community resources section of this chapter.
Whether the sources of information and teaching are the provider, a CDE, or a combination of both professionals, it is important that information be given that will support the patient in managing his or her care in a systematic manner. This information includes but is not limited to:
Understanding the rationale for GHB testing
The relation of meal planning, food, and exercise control to glycemic control
SMBG
Mode of action and side effects of medications
Sick-day management
Signs and symptoms of hypo- and hyperglycemia and their management
Possible acute and chronic complications.
Taken as a whole, this information constitutes the survival skills for the person with diabetes. The following discussion will focus on each of these content areas that providers and patients need to understand for successful management of diabetes.
Glycohemoglobin Testing
GHB testing helps the provider to determine a patient’s blood glucose level for the 100 to 120 days before testing. A minor hemoglobin, GHB constitutes only 4% to 8% of the total hemoglobin. There are three components of GHB that are said to be glycosylated: A1a, A1b, and A1c. A1c is the most commonly measured GHB. If A1a is measured, its value is computed at 2.4% higher than A1c. GHB analysis is useful because this component of the red blood cell’s hemoglobin combines with some of the blood stream’s glucose load. This process is called glycosylation and is irreversible. In other words, how high a patient’s GHB level is depends on how much glucose was available in the blood stream over the 100- to 120-day lifespan of the red blood cell. This determination is only an average of that glucose level, though, because red blood cells undergo a constant cycle of old cell destruction and new cell generation (Pagana & Pagana, 1997).
Several assays exist for determination of GHB. Different assays may have different normal ranges. Providers must be aware of the assays available at a given practice site.
CLINICAL PEARL
The GHB should be assayed at least twice per year, although every 3 months is preferable (ADA, 1996d, e).
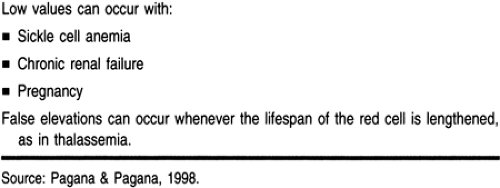
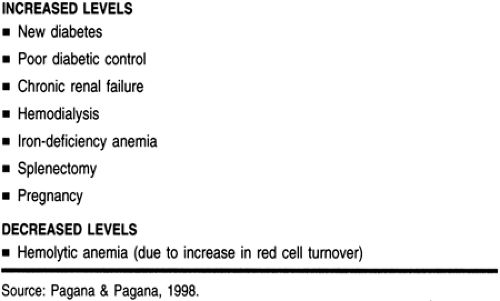
Refer to Table 17-5 for specific conditions that can affect GHB levels. GHB levels also can be increased or decreased by several conditions. Before making a final assessment of the GHB status of a patient, the provider should be aware of the coexistence of any of the states described in Table 17-6.
Meal Planning
Because “diet” is an emotionally charged and negative word, the concept of a meal plan is easier to accept and discuss. Many people plan their meals; people do not have to have a chronic disease to plan ahead for food. Meal planning is an important skill for patient learning. The provider must keep in mind that the primary goal of meal planning is control of blood sugar and lipid levels. Optimal glycemic control can be accomplished through planning meals. Planning includes meal composition, preparation methods, portion size, and condiments added. The provider should ask specific questions about favorite foods and about any food allergies or sensitivities, such as lactose intolerance.
CLINICAL PEARL
Weight loss is a secondary target, and not easily sustained. In teaching meal planning, the provider should first aim at what can be done realistically to aid the patient in self-managing glycemic control. Very modest reductions in weight (3 to 10 lb) often yield dramatic improvements in glycemic control.
Details about composing a meal plan and measuring food intake are covered in Chapter 5. The provider should keep in mind that meal planning for the patient with diabetes includes 10% to 20% protein but not less than 0.8 g/kg/day, and no more than 10% saturated fats. Note that fat may need to be adjusted downward if the lipid profile indicates a cardiovascular risk. The rest of the day’s calories should be derived from mono-unsaturated fats and complex carbohydrates. Both soluble and insoluble fibers should be consumed, and 20 to 35 g of soluble fiber should be eaten. Cholesterol intake should not exceed 300 mg/day (ADA, 1996c).
COMMON MYTHS IN DIABETIC MEAL PLANNING
There are at least three myths about food and diabetes management that must be dispelled (Dudley, 1998, personal communication; Norton, 1997, personal communication).
Myth 1 is, “Diabetes is a sugar disease. People with diabetes cannot eat sugar.” In fact, diabetes is an insulin disease. Sugars such as sucrose, fructose, maltose, and so on are only foodstuffs that may affect the blood glucose level. As part of a balanced meal plan, different forms of sugar may be incorporated to provide variety in the diet (Dudley, 1998, personal communication).
Myth 2 is, “All persons with diabetes must have a bedtime snack.” This myth is a holdover from the era when crude, long-acting insulins were used. These insulins exerted unpredictable peak actions; thus, it was deemed necessary to provide the patient with a hearty snack at bedtime. This myth pervades much of health care, contributing to fasting hyperglycemia both at home and in the hospital. Hepatic glucose output is maximal during the night, so additional caloric substrate is generally not required. Extra calories can lead to excessive weight gain.
CLINICAL PEARLS
All patients on pharmacologic therapy should keep some form of sugar at the bedside in case of overnight hypoglycemic symptoms. Easily stored sugars include hard, easily chewed candies, or a tube of cake frosting.
Bedtime snacks are indicated in persons who need extra calories to maintain weight or if glycogen storage is limited, as in liver disease. These patients are prone to overnight hypoglycemia and may require a snack containing some mixed nutrients (eg, 8 oz of 1% or skim milk and a slice of nonwhite bread toast with 0.5 oz of low-fat cheese).
CLINICAL WARNING
Juice and crackers are not recommended for bedtime consumption. Snacks containing only carbohydrate will provide only short-term fuel and, in fact, can potentiate higher blood glucose levels. Adding high-fat foods such as peanut butter may
contribute to fasting hyperglycemia and general lipid excess in adults. Fats are not metabolized rapidly enough to prevent short-term hypoglycemia (Dudley, 1998, personal communication; Norton, 1997, personal communication).
contribute to fasting hyperglycemia and general lipid excess in adults. Fats are not metabolized rapidly enough to prevent short-term hypoglycemia (Dudley, 1998, personal communication; Norton, 1997, personal communication).
Myth 3 is, “ ‘Unsweetened’ and ‘no added sugar’ are the same as ‘sugar-free’.” All sugars, including fructose, can acutely elevate blood sugar levels. So-called “unsweetened” juice can deliver 20 to 30 g of carbohydrate in the form of fructose per 8-oz serving. This is nearly half the amount of a formal glucose tolerance test, which would raise the blood glucose of a person with diabetes to over 200 mg/dL. “Unsweetened” and “sugar-free” are not the same. Sugar-free foods provide few calories from carbohydrate (generally <4 calories per serving). Teach patients that any ingredient ending in “-ose” on a food label means that it contains a form of sugar (Norton, 1997, personal communication).
Activity and Exercise
Exercise can have positive effects on glucose control across the lifespan (Clark, 1997; Eriksson et al, 1997; Powell & Blair, 1994). Exercise is the missing link in the diabetes plan of care. Exercise can overcome or reverse many common mistakes in meal planning and eating patterns. Moving from the theoretical recognition of its importance to the daily practice of exercise is one of the most challenging tasks in clinical practice. Prochaska et al (1991, 1992, 1994) provide a model for understanding this barrier:
Stage 1: Precontemplation. The person is uninterested in changing a behavior.
Stage 2: Contemplation. The person is now interested in changing, but is not doing anything to act on this interest.
Stage 3: Preparation. The person is now interested in change and is acting on this interest occasionally.
Stage 4: Initial action. The person is now beginning a regular routine.
The primary care provider must be aware that the patient’s participation in exercise (or lack thereof) may fit within the confines of this model. This awareness can prevent frustration for provider and patient alike and may help providers work with patients toward initiating and sustaining stage 4.
Stay updated, free articles. Join our Telegram channel

Full access? Get Clinical Tree


