Fig. 3.1
Characteristics of a longitudinal sound wave (Reproduced with permission from www.regionalfortrainees.com)
Fig. 3.2
Characteristics of a transverse sound wave (Reproduced with permission from www.regionalfortrainees.com)
An ultrasound wave has the following basic parameters (Fig. 3.2) [7]:
(a)
Wavelength (λ) is the spatial period of the wave, i.e., the distance over which the wave’s shape repeats. It is determined by measuring the distance between two consecutive corresponding points of the same phase. It is expressed in meters (m).
(b)
Amplitude (A) is a measure of the height of the wave, i.e., maximal particle displacement. It is expressed in meters (m).
(c)
Period (Т) is the time taken for one complete wave cycle to occur. The unit of period is seconds (s).
(d)
Frequency (f) is the number of completed cycles per second. Thus, it is the inverse of the period (T) of a wave. The unit of frequency is hertz (Hz). Medical imaging uses high-frequency waves (1–20 MHz).
(e)
Velocity (c) is the speed of propagation of a sound wave through a medium. The velocity (c) of a wave is the product of its frequency (f) and wavelength (λ) of a sound wave. The unit of velocity is meters per seconds (m/s). The speed of sound in biological medium is assumed to be constant at 1,540 m/s for practical purposes. However, it varies greatly, being as low as 330 m/s in air and as high as 4,000 m/s through bone.
(f)
Energy (E) of a sound wave is proportional to the square of its amplitude (A). This means that as the amplitude of a wave decreases (such as with deeper penetration), the energy carried by the wave reduces drastically.
(g)
Power (P) of a sound wave is the energy (E) delivered per unit time (t).
Generation of Ultrasound Waves
Piezoelectric crystals (e.g., quartz) in an ultrasound transducer produce a small potential difference across them when compressed or under tension. The ability to covert mechanical energy into electrical energy is termed the piezoelectric effect (Fig. 3.3a) [8]. This was first demonstrated by Pierre Curie and Jacques Curie in 1880 [8]. This effect is used in image generation when returning ultrasound waves apply mechanical energy to the crystals which in turn generate an electrical signal.
Fig. 3.3
(a) The piezoelectric effect. (b) The reverse piezoelectric effect (Reproduced with permission from www.regionalfortrainees.com)
The converse, i.e., the application of electrical energy across a piezoelectric crystal, causes mechanical distortion of the crystals resulting in their vibration and generation of sound waves. This phenomenon, termed the reverse piezoelectric effect (Fig. 3.3b), was first proposed by Gabriel Lippmann in 1881. This property is utilized to generate ultrasound waves from transducers [9].
Structure of an Ultrasound Transducer
An ultrasound transducer has a dual functionality. It is responsible for both the production of ultrasound waves and, after a set period of time, the reception of waves reflected from the tissues. This is called pulsed ultrasound. The pulse repetition frequency (PRF) is the number of pulses emitted by the transducer per unit of time [10]. The PRF for medical imaging devices ranges from 1 to 10 kHz (Fig. 3.4).
Fig. 3.4
Pulse repetition frequency (Reproduced with permission from www.regionalfortrainees.com)
The ultrasound transducer has the following layers (Fig. 3.5) [11]:
Fig. 3.5
Layers of an ultrasound transducer (Reproduced with permission from www.regionalfortrainees.com)
(a)
Backing material: located behind the piezoelectric element, it serves to prevent excessive vibration. This causes the element to generate ultrasonic waves with a shorter pulse length, improving axial resolution in images.
(b)
Piezoelectric elements: they generate ultrasonic waves and also generate images. Piezoelectric ceramic (PZT: lead zirconate titanate) is most commonly used because of their high conversion efficiency [12].
(c)
Acoustic matching layer: this reduces the acoustic impedance mismatch between the transducer and the object, minimizing reflection off the interface [13]. This is usually made up of a resin.
(d)
Acoustic lens: the acoustic lens prevents the ultrasonic waves from spreading and focuses them in the slice direction to improve the resolution.
Interaction of Ultrasound with Tissues
The final image on the screen of an ultrasound machine is the result of the interaction of ultrasound waves with the tissues being examined. As the ultrasound wave travels through the tissues, it loses amplitude (and hence energy). This reduction in amplitude is called attenuation. Attenuation is the summative effect of absorption (conversion of acoustic energy to heat), reflection, and refraction of ultrasound waves [7].
Absorption
Absorption is the process of transfer of the ultrasound beam’s energy to the medium through which it travels through heat generation and it accounts for most of the wave attenuation.
Reflection
When an incident ultrasound pulse encounters an interface of two body tissues with different acoustic impedances, the sound energy is reflected back to the transducer. When the size of the object is smaller than the wavelength of the beam (e.g., red blood cells) and/or the surface of a structure not smooth, only a part of it is reflected back to the transducer with a proportion of the waves being scattered in multiple directions (diffuse scattering). However, when the size of the object exceeds the wavelength of the incident beam and the surface is smooth (e.g., a fascial plane or the surface of the pleura), most of the beam is reflected back to the transducer (specular reflection, Fig. 3.6).
If the incident ultrasound wave approaches the linear interface at 90°, almost all of the generated echo will travel back to the transducer. However, if the angle of incidence with the specular boundary is less than 90°, the echo will not return to the transducer but rather be reflected at an angle equal to the angle of incidence. The returning echo will potentially miss the transducer and not be detected. This explains why needles inserted at a steep angle may not be well visualized on the ultrasound image (Fig. 3.7). Some needle manufacturers have introduced needles with “cornerstone reflectors” in their design, such that the indentations on their surface maximize the proportion of waves that are reflected back to the transducer. This makes such needles more “echogenic” [14, 15].
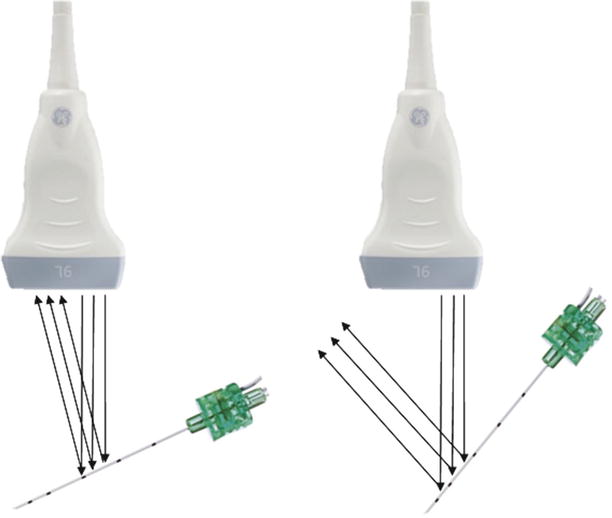
Fig. 3.7
Effect of angle of needle insertion on acquisition of reflected ultrasound waves (Reproduced with permission from www.regionalfortrainees.com)
Refraction
Refraction refers to a change in the direction of the sound after reaching an interface of two tissues with different speeds of sound transmission. It is dependent upon the change in velocity and not due to differences in acoustic impedance (Fig. 3.8). Refraction is one of the most frequent causes of artifacts on an ultrasound image. It is described by Snell’s law, where ɵ i is the angle of incidence, ɵ t is the angle of transmission, C i is the velocity in the first medium, and C t is the velocity in the second medium such that [16]

Fig. 3.8
Refraction across two mediums (Reproduced with permission from www.regionalfortrainees.com)
Attenuation
The degree to which a given ultrasound wave is attenuated depends on a number of factors:
(i)
The type of tissue: attenuation is greater for denser tissues such as bone and lower for fluid mediums such as blood- or fluid-containing cysts or cavities.
(ii)
Frequency of the ultrasound wave: the degree of attenuation for a given unit of distance is greater for waves of higher frequency. This explains why higher-frequency transducers (commonly up to 13–15 MHz) are mostly used to image superficial structures (up to 5–6 cm deep) while lower-frequency transducers are required to image deeper structures.
(iii)
Distance traveled: for any ultrasound wave, the degree of attenuation is directly proportional to the distance traveled (Fig. 3.9).
Fig. 3.9
Relationship of attenuation with tissue type and frequency (Reproduced with permission from www.usra.ca)
Acoustic Impedance
The acoustic impedance (Z) is the degree to which medium particles would resist change due to mechanical disturbance and is a product of the density (ρ) of the medium and the acoustic velocity (c) of the ultrasound wave [17]. The amount of reflection depends upon the relative changes in the acoustic impedance (resistance at the interface) between the two tissues (or mediums). This is determined by the reflection coefficient (R). Large difference in acoustic impedance occurs at air/soft tissue and bone/soft tissue interface causing very high reflection at such sites. This makes bone cortex appear white while air appears black. This is also why a gel is needed at the transducer to eliminate air/soft tissue interface to obtain any image.
Image Acquisition and Processing
The echo signals returning from the tissues reach the crystals and produce an electric current (piezoelectric effect). This is then converted to a pixel on the image, with the energy of the returning wave being proportional to the brightness of the pixel dot on the image. However, this involves these additional processes [18]:
(a)
Amplification (gain): the amplitude of the returning echo signals is very small to be properly displayed on a screen. Hence, it needs amplification. However, amplification adds to “background noise.”
(b)
Time gain compensation: because the ultrasound waves undergo attenuation, the intensity (and hence brightness) of the returning waves from deeper tissues is much lower than the ones returning from the nearer tissues. This is overcome by preferential enhancement of signals returning from deeper tissues, the so-called time gain compensation such that echoes returning from similar reflectors are represented by the same shade of gray regardless of their depth (Fig. 3.10a, b) [19].
Fig. 3.10
Time gain compensation (a) not applied (b) and correctly applied (Reproduced with permission from www.regionalfortrainees.com)
(c)
Analog to digital conversion: this eliminates external interference and, more importantly, allows for signal processing to improve image quality.
(d)
Post-processing: this involves techniques such as frame averaging, gray-level transfer curves, edge enhancement, and adaptive image processing to yield the final image on a display.
The final image allows structures to be represented according to their brightness or echogenicity as the following [10]:
(a)
Hyperechoic: areas with returning echoes of higher energy than their surrounding structures, appearing whiter (such as peripheral nerves and muscle tendons) (Fig. 3.11a)
Fig. 3.11
Structures of different echogenicity. (a) Hyperechoic peripheral nerves (yellow arrowhead median n). (b) Hypoechoic cervical nerve roots (yellow arrowhead cervical nerve roots). (c) Anechoic vein and artery (IJV internal jugular vein, CA carotid artery in the neck) (Reproduced with permission from www.regionalfortrainees.com)
(b)
Hypoechoic: areas with returning echoes of lower energy than their surrounding structures, appearing as gray (such as proximally located spinal nerve roots) (Fig. 3.11b)
(c)
Anechoic: areas with no returning echoes, appearing as black (such as the fluid within vessels) (Fig. 3.11c)
Ultrasound Transducer Characteristics
Ultrasound transducers can be classified by their shape. The most commonly used probes for UGRA are linear array and curved array probes [20].
Linear Array Probe
These have a linear footprint (Fig. 3.12a). They are high-frequency probes (8–12 MHz) and best reserved for imaging superficial structures (such as the brachial plexus). They provide a square or rectangular field of view (Fig. 3.12b).
Fig. 3.12
(a) A linear array probe. (b) Field of view of a linear probe (Reproduced with permission from www.regionalfortrainees.com)
Curved Array Probes
These have a curved footprint (Fig. 3.13a). They are low-frequency probes (1–5 MHz) and best reserved for imaging deeper structures (such as the sciatic nerve in the gluteal area). They provide a sectorial field of view (Fig. 3.13b).
Fig. 3.13
(a) A curved array probe. (b) Field of view of a curved array probe (Reproduced with permission from www.regionalfortrainees.com)
Resolution
Resolution of an ultrasound machine is its ability to distinguish two close objects as separate. In simple terms, it provides clarity to the ultrasound image [21–23]. Different types of resolution important for a regional anesthesiologist are:
(a)
Axial resolution is the ability of the ultrasound machine to separate two structures lying at different depths, parallel to the direction of the ultrasound wave (Fig. 3.14a). It is half of the pulse width. Thus, high-frequency probes (shorter pulse width) have better axial resolution. However, they also have higher attenuation, resulting in poor penetration.
Fig. 3.14
(a) The effect of frequency of the transducer on the axial resolution (Reproduced with permission from www.regionalfortrainees.com). (b) The effect of width of the ultrasound beam on lateral resolution (Reproduced with permission from www.regionalfortrainees.com)
(b)
Lateral resolution is the ability of the ultrasound machine to separate two structures lying at the same depth, perpendicular to the direction of the ultrasound wave (Fig. 3.14b). It is inversely related to the width of the ultrasound beam, which is lower with high-frequency probes.
(c)
Temporal resolution is directly related to the frame rate of the ultrasound machine. To limit its impact, needle manipulation and injection of local anesthetic should be slow to minimize blur.
Image Optimization
The following steps can be considered to optimize ultrasound image acquisition:
Probe Selection
As discussed earlier, linear probes lend themselves to most superficial nerve blocks (such as brachial plexus block), while curvilinear probes are helpful to perform blocks at deeper sites (such as sciatic block at the subgluteal region). The footprint size of a given probe is also an essential consideration. While smaller footprint probes (e.g., 25-mm linear transducers) are better for use in pediatric population or smaller adults, they also reduce the field of view (Fig. 3.15). Curvilinear probes are also available in different footprint sizes.
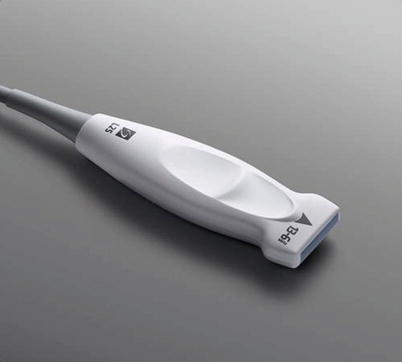
Fig. 3.15
Smaller footprint linear transducer (Reproduced with permission from www.regionalfortrainees.com)
Frequency
Most probes are broadband transducers and are capable of allowing adjustment of their frequency (5–15 MHz). Selecting a higher frequency provides superior lateral resolution but at the expense of increased attenuation and poor penetration. Lowering the frequency of a given probe allows better visualization of deeper structures at the cost of resolution (Fig. 3.16).
Fig. 3.16
The frequencies generated by linear broadband transducers (Reproduced with permission from www.usra.ca)
Related posts:


Stay updated, free articles. Join our Telegram channel

Full access? Get Clinical Tree


