Oxygen Delivery
Oxygen delivery (DO2) comprises three steps: (1) gas exchange at the alveolar–capillary bed in the lungs; (2) transport to tissues; and (3) cellular uptake of oxygen (O2). Ninety-eight percent of the oxygen diffusing across the alveolar capillary membrane combines with hemoglobin to form oxyhemoglobin. One gram (g) of hemoglobin that is fully saturated, that is, all of the binding sites have O2 molecules attached to them, carries 1.38 milliliters (mL) of oxygen.
The saturation of arterial oxygen (SaO2) is a reflection of the percentage of hemoglobin binding sites carrying oxygen. The amount of hemoglobin bound oxygen (HbO2) known as oxyhemoglobin, is calculated by using the following equation:2
HbO2=Hb×1.38×SaO2
The remaining 2% of the oxygen that has diffused across the alveolar capillary membrane is dissolved in blood serum. Measurement of this is reflected in the PO2 in the arterial blood (PaO2) in mm Hg. The total dissolved volume is calculated using the following equation:
DissolvedO2=PaO2×0.0031
Arterial oxygen content (CaO2) reflects the amount of oxygen in the arterial blood. Contributors to CaO2 include Hb, SaO2, and the partial pressure of arterial oxygen (PaO2). The calculation of this volume is based on the following equation:
CaO2mL/Literofblood=Hb×1.38×(SaO2+PaO2)×0.0031
However, in clinical practice, most clinicians will only include the bulk transport of oxygen, that is, the amount being transported by Hb because the dissolved oxygen represents only a small amount of the total oxygen being transported in the body.3
DO2 is defined as the total amount of oxygen delivered to the tissues in 1 minute. Key components of DO2 include the Hb, SaO2, and cardiac output (CO) (Figure 7-2). Arterial oxygen delivery is calculated by the following:
DO2mL/min=Hb×1.38×SaO2×CO×10
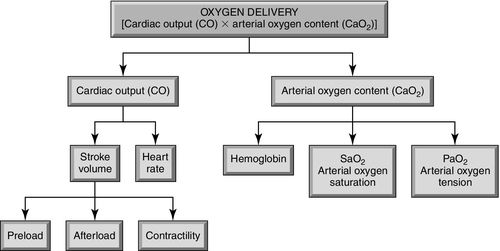
Ten is the multiplier used to convert the CaO2 from milliliter per liter (mL/L) to milliliter per minute (mL/min). Normally, 1000 mL/min of oxygen is delivered to tissues. If a value based on body size is required, substitute cardiac index (CI) for cardiac output in the equation above.
Venous Oxygen Content
Venous oxygen content is the amount of oxygen remaining in the bloodstream after the blood passes through tissues. At rest the tissues extract approximately 25% of the delivered oxygen at the cellular level, leaving approximately 75% remaining in venous blood. Mixed venous oxygen saturation (SvO2), the oxygen saturation of the blood in the pulmonary artery, is used to calculate this amount:
VenousoxygencontentmL/min=Hb×1.38×SvO2×CO×10
Approximately 750 mL/min of oxygen remains in venous blood as it returns to the right atrium. This, too, can be indexed to body size using the CI.
The venous oxygen content represents the oxygen reserve for the body. If demand increases or if delivery is decreased, the body compensates by increasing oxygen extraction at the cellular level. Instead of extracting 25%, the cells may extract 40% or more, depending on the situation. The greater the volume of oxygen extracted by the cells, the less remaining in the venous blood causing the venous oxygen content to be lower.
Oxygen Consumption
Oxygen consumption (VO2) is commonly used to refer to oxygen extraction. It is defined as the amount of oxygen consumed by the cells in 1 minute. As stated previously, this is normally 25% of oxygen delivery while at rest. Direct measurement of VO2 in a critically ill patient may be difficult depending on the condition of the patient. For the patient who is intubated and on a ventilator, a gas analyzer can be inserted as an attachment between the endotracheal tube and the ventilator. The gas analyzer obtains physiologic measurements to calculate VO2. This process is often referred to as using a “metabolic cart” and is not available in many facilities. A more common approach is to obtain mixed venous (SvO2) blood gas samples from the pulmonary artery with a pulmonary artery catheter in place. Therefore, VO2 is calculated by using:
VO2mL/min=COSaO2−SvO2×Hb×1.38×10
Normal VO2 is 200 to 250 mL/min or, as before, the cardiac index may be substituted for cardiac output so that VO2 is 125 to 175 mL/min/m2. Refer to Figure 7-3 depicting the process of oxygen delivery, consumption, and venous oxygen transport. Table 7-1 reflects the calculations and normal values for all these parameters using both CO and CI.
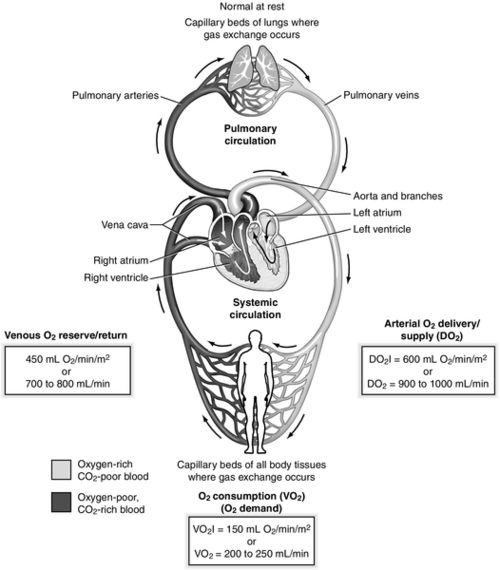
Table 7-1
Normal Values
| Parameter | Equation | Normal Range |
| Arterial oxygen content (CaO2) | Hb × 1.38 × (SaO2 + PaO2) × 0.0031 | 16-22 mL/dL |
| Oxygen delivery (DO2) | Hb×1.38×SaO2×CO×10Hb×1.38×SaO2×Cl×10 | DO2: 1000 mL/min DO2I: 500-600 mL/min/m2 |
| Venous oxygen content | Hb×1.38×SvO2×CO×10Hb×1.38×SvO2×Cl×10 | 750 mL /min |
| Oxygen consumption (VO2) | COSaO2−SvO2×Hb×1.38×10ClSaO2−SvO2×Hb×1.38×10 | VO2: 200-250 mL/min VO2I: 120-160 mL/min/m2 |
| Mixed venous oxygen saturation (SvO2) | 60%-80% |
CI, Cardiac index; CO, cardiac output; Hb, hemoglobin; PaO2, partial pressure of arterial oxygen; SaO2, saturation of arterial oxygen.
Mixed Venous Oxygen Saturation
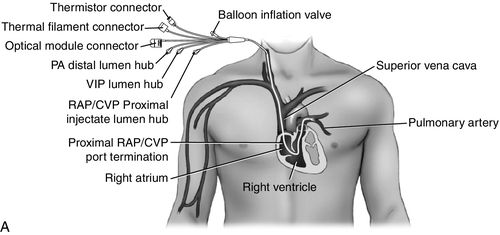
Mixed venous oxygen saturation monitoring requires the placement of a fiberoptic pulmonary artery catheter (PAC). Refer to Figure 7-4. SvO2 can be monitored continuously using a fiberoptic PAC or, if a standard PAC is used, blood samples from the pulmonary artery may be obtained from the distal port of the catheter providing intermittent measurements. Continuous SvO2 monitoring with a fiberoptic PAC uses reflectance spectrophotometry technology. When connected to the SvO2 monitor, a light source from the optical module is transmitted to the tip of the PAC, where the oxyhemoglobin molecules absorb the light and reflect it back through the PAC to the light detector (photodetector) within the optical module. Refer to Figure 7-5.
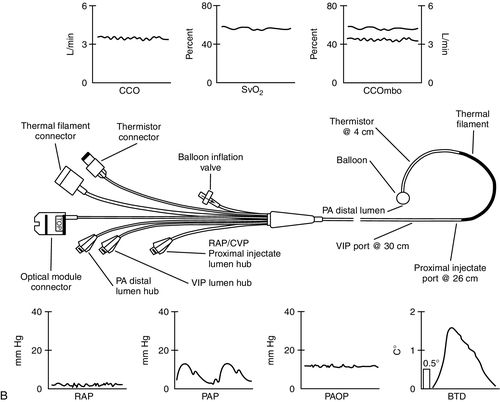

Intermittent SvO2 measurements require obtaining mixed venous blood samples. The blood is drawn from the distal port of the PAC. It is important that the blood sample be withdrawn slowly to avoid obtaining arterialized blood that will overestimate the SvO2 value. The obtained blood gas sample should be managed using the same methods as an arterial blood gas sample. The mixed venous blood gas should be measured using a co-oximeter in the laboratory. If the co-oximeter laboratory value of measured SvO2 varies by more than 5% from the value reflected on the SvO2 monitor, the bedside PAC fiberoptic system should be recalibrated.
SvO2 provides information about the venous oxygen content, indicating the amount of oxygen remaining in blood after it has passed through the tissues. Therefore, it provides information about the oxygen reserve reflecting the balance between oxygen supply and oxygen demand at the cellular level. SvO2 is considered a global parameter. It does not provide specific information about oxygen balance within a particular organ or system but, instead, is reflective of the overall balance between oxygen supply and demand. Of interest, clinicians believed SvO2 might serve as in indicator of cardiac output and therefore, it was often referred to as a “poor man’s cardiac output.” Through years of use, it has been shown that the correlation of SvO2 with cardiac output is not reliable because oxygen delivery may be impacted by changes in hemoglobin, arterial oxygen saturation and oxygen consumption.3,4 Refer to the first case study at the end of the chapter for a demonstration of a low cardiac output in the setting of a normal SvO2.
A normal SvO2 range is 60% to 80%. However, a normal SvO2 may not be a reliable indicator of the patient’s demand–supply balance. Case study #1 reflects this situation. It is more important to monitor the SvO2 trend. Specifically, a clinically significant change in the SvO2 is present when the SvO2 value increases or decreases by 5% to 10% lasting longer than 3 to 5 minutes.
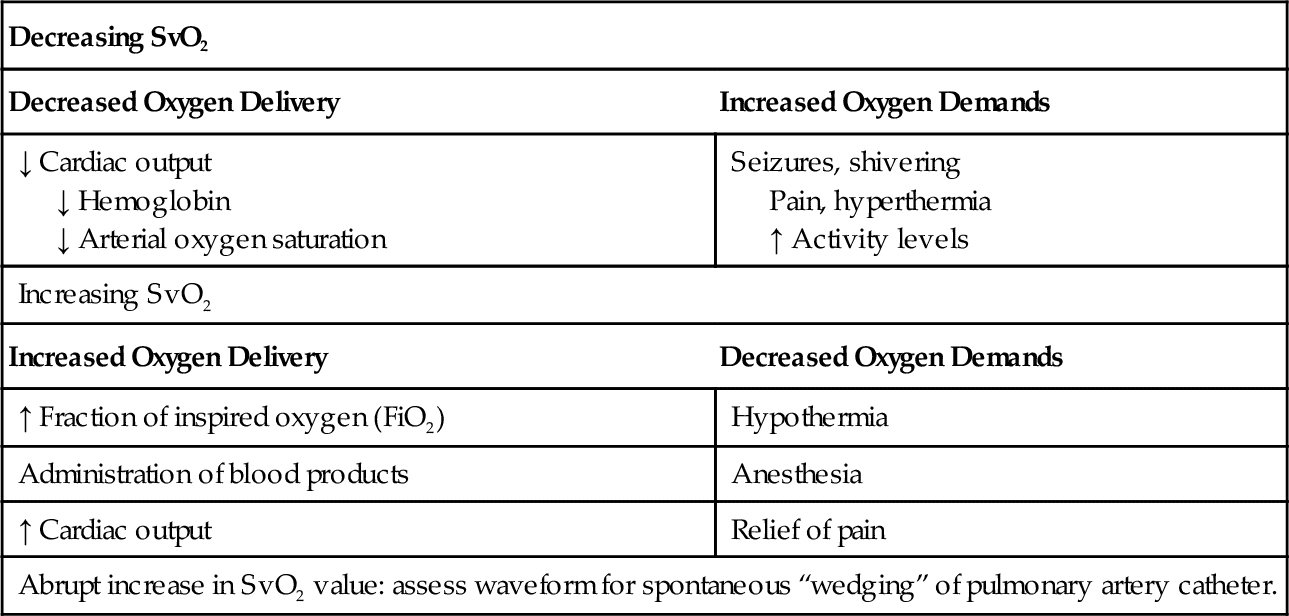
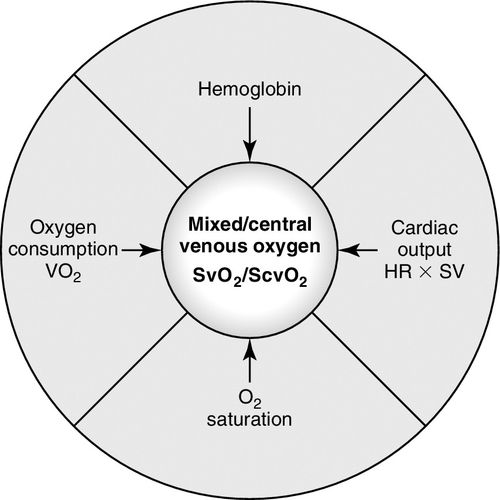
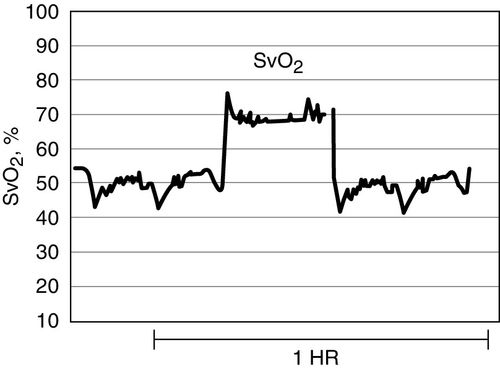
Specific determinants of SvO2 include the three components of DO2 and VO2. (See Figure 7-6.) A change in any one of these components may be associated with a change in the SvO2. Although, keep in mind that the body uses compensatory mechanisms to respond to pathophysiologic conditions and the anticipated response may not always be present. Generally, a decrease in the SvO2 indicates more oxygen is being extracted at the cellular level. This situation is caused by any condition that decreases oxygen delivery or increases oxygen demand reflecting an increase in VO2. An increase in the SvO2 indicates that less oxygen is being extracted. This may be caused by interventions to increase oxygen delivery or reduce oxygen demand. SvO2 will also increase with end-stage sepsis when the microcirculation is impaired thereby interfering with cellular gas exchange. SvO2 will increase when a pulmonary artery catheter is “wedged,” purposefully or when spontaneous migration of the PAC occurs; the SvO2 value will increase abruptly by approximately 10% to 20%. See Figure 7-7. This is caused by the obstruction of blood flow through the vessel and the fiberoptics “looking” at blood that has participated in gas exchange. It is extremely important that the pulmonary artery waveform be monitored continuously for the purpose of identifying if the catheter has migrated further out into the vessel and is occluding blood flow, as this may result in a pulmonary infarction. The abrupt increase in the digital SvO2 reading has often served as the first indicator of spontaneous wedging in a critically ill patient. Table 7-2 provides a summary of clinical situations that may cause changes in the SvO2. When the SvO2 is changing, it is important for the clinician to assess the patient for all factors that potentially impact the SvO2 value.
Oxygen Extraction Ratio
Oxygen extraction ratio (O2ER) represents the percentage of oxygen delivery extracted by tissues as blood flows through the capillary bed. It can be expressed as follows:
O2ER=VO2÷DO2
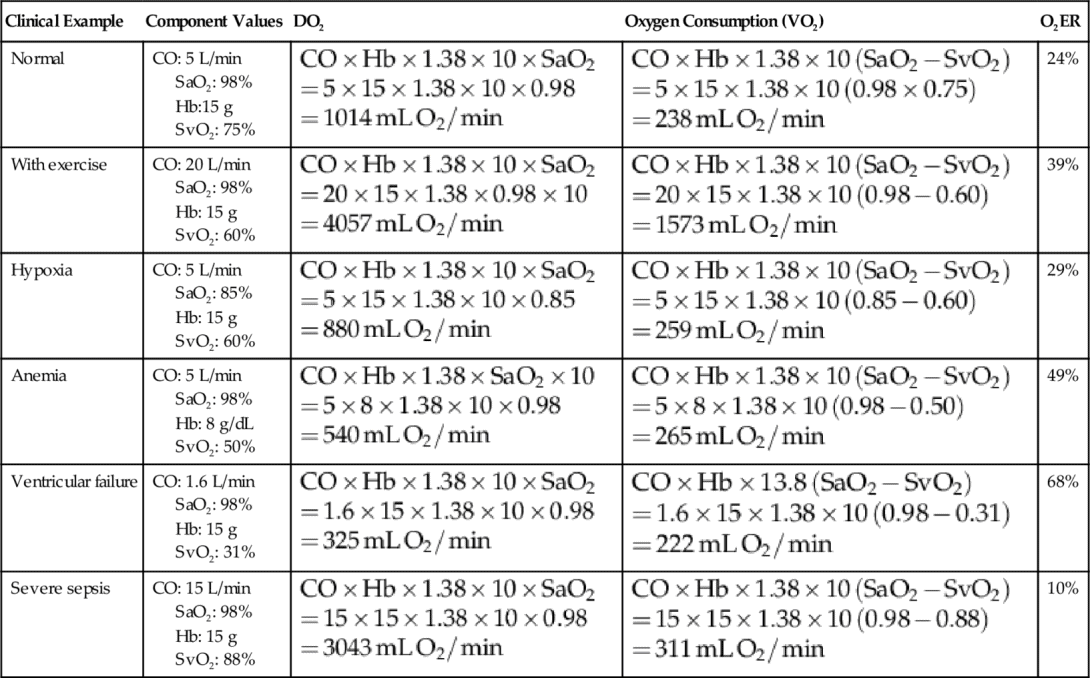
Another method to estimate the O2ER is by by simply calculating SaO2 − SvO2. As stated previously, normally, 25% of the oxygen is extracted when a person is at rest. If DO2 falls or demand increases, a larger percentage is extracted as a compensatory mechanism. The normal range for O2ER is 22% to 30%. If O2ER is greater than 30%, this indicates that an imbalance exists between supply and demand and that the metabolic requirements of tissues are not being met. An O2ER of less than 22% indicates that the metabolic demands are being met or patient is in the end stage of septic shock. Table 7-3 demonstrates the impact of activities and clinical conditions on the O2ER.
Table 7-3
Impact of Determinants of Oxygen Delivery (DO2) on Oxygen Extraction Ratio (O2ER)
Courtesy of Edwards Lifesciences.
CO, Cardiac output; g, gram; g/dL, grams per deciliter; Hb, hemoglobin; L/min, liters per minute; mL O2/min, milliliters of oxygen per minute; SaO2, saturation of arterial oxygen; SvO2, saturation of venous oxygen.
Imbalance between Oxygen Delivery and Oxygen Consumption
Typically, the body will initiate compensatory mechanisms whenever an imbalance exists between oxygen supply and demand. The first mechanism is mediated through activation of the sympathetic system, causing an increase in heart rate and myocardial contractility resulting in an increased cardiac output. Cardiac output may increase up to three to five times the normal value in this situation. The second compensatory mechanism is autoregulation, which is manifested by peripheral vasoconstriction and redistribution of blood flow to the vital organs. Keep in mind that if the patient is receiving sodium nitroprusside or is in hyperdynamic septic shock with a low systemic vascular resistance, this mechanism will be impaired. Last, the third mechanism is the increased oxygen extraction by the tissues increasing the O2ER. Causes of DO2-VO2 imbalance are listed in Table 7-4. Table 7-5 provides information about the impact of some nursing interventions on DO2 and VO2.
Table 7-4
Causes of Imbalance between Oxygen Delivery (DO2) and Oxygen Consumption (VO2)
| Decreased Supply (↓ DO2): | Increased Demand (↑ VO2 and ↑ O2ER) |
| Inadequate pulmonary gas exchange (↓ SaO2) | Surgical trauma: 10% to 30% |
| Inadequate oxygen carrying capacity (↓ Hb) | Severe sepsis: 50% to 100% |
| Inadequate cardiac output (↓ CO) | Critically ill in the emergency department: 60% |
| Leftward shift of oxyhemoglobin dissociation curve | Head injury, not sedated: 138% Head Injury, sedated: 89% |
| Loss of autoregulation | Severe burns: 100% |
CO, Cardiac output; Hb, hemoglobin; O2ER, oxygen extraction ratio; SaO2, saturation of arterial oxygen.
Stay updated, free articles. Join our Telegram channel

Full access? Get Clinical Tree


