Several algorithms have been developed and validated to guide the organized approach to ultrasonography performed on a patient in the emergency or critical care setting.10–13 For cardiac assessment, the focused assessed transthoracic echocardiography (FATE),14 focused cardiac ultrasound (FOCUS), and focused echocardiography evaluation in life support (FEEL) protocols are widely utilized in the goal-directed evaluation of cardiac function in the critical patient. In addition, the rapid ultrasound in Shock (RUSH), bedside lung ultrasound evaluation (BLUE), and focused assessed sonography in trauma (FAST or eFAST) protocols are implemented for noncardiac evaluations (Table 11-2). Each of these will be discussed in more detail in subsequent sections of this chapter.
Image Acquisition and Interpretation of Structures in Ultrasonography
Knobology
An ultrasound machine has three major components; the transducer, the computer, and the display screen. Transducers have delicate piezoelectric crystals that turn electricity into sound waves that are directed at the areas of interest. These sound waves encounter anatomic structures and may be reflected back toward the probe in varying degrees, depending on the inherent motion and the physical makeup of the structures encountered. These reflected waves are sensed by the same piezoelectric crystals and interpreted by the processor to produce an image on the display. The way in which reflecting sound waves are interpreted and presented depends on the particular mode selected, as will be discussed in detail in this section.
Probe Selection
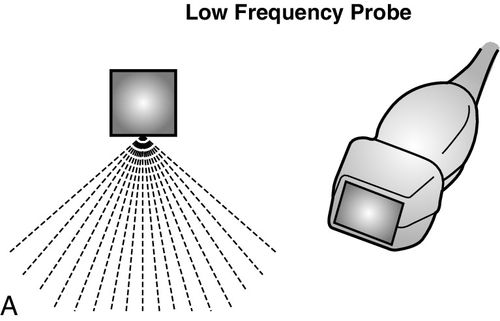
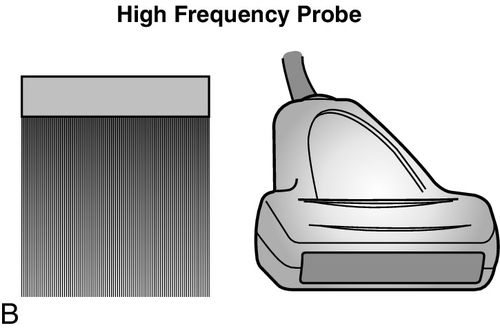
Ultrasound probes are categorized by the frequency of emission or the wavelength of sound waves produced, as well as the physical shape of the end of the transducer, or “footprint” of the probe being utilized. Commonly, two types of probes are used to evaluate critically ill patients; these include the high-frequency (10–15 megahertz [MHz]) and low frequency (2–5 MHz) probes. The choice of probe depends on the depth of the anatomic structure that needs to be imaged and the quality of the image that needs to be obtained.
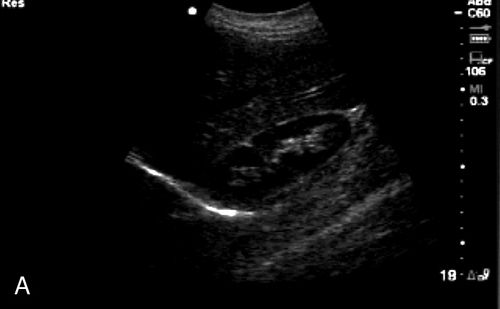
High-frequency probes are best used to image superficial structures such as blood vessels, nerves, and pleura, as the clarity and detail of these structures are important; in contrast, low-frequency probes are used to examine deeper structures such as the heart or the abdomen. Clarity and detail of deeper organs and structures are important; however, ultrasonographic technology and physics limit the ability to see objects clearly at these depths. This unfortunate setback is a function of the physical limitations of the ultrasound at longer wavelengths, and as yet, no method exists to overcome this. The frequency of the transducer determines the quality of the image that is able to be obtained; specific probe frequencies and footprints have been paired for practicality. For example, low-frequency, phased-array transducers are ideal to examine the heart because the probe footprint fits between the ribs and the ultrasound waves fan out as they travel into the body to provide a progressively widening field of view. However, the aforementioned image comes with the expense of decreased resolution at greater depths. In contrast, the linear high-frequency probe has a wide and flat footprint from which the ultrasound waves emanate in a straight line, providing higher resolution along the entire course of the view; however, the depth of the field of view is greatly reduced (Figure 11-1).
Gel
Air is considered the “enemy” of ultrasound as the presence of air significantly reduces the transmission of the ultrasound waves. To overcome this, ultrasound gel is used as a conduit to transmit sound energy between the patient and the transducer. Any viscous liquid can serve as a medium, but the specially designed gel is particularly useful, as it provides the best image quality with the least air interference. It is important to avoid the mouth of the gel bottle touching the patient or the probe to prevent contamination and transmission of infection to other patients.
Image Optimization
When examining a patient, several adjustments are made by the operator to optimize the image obtained; these include gain, depth, and proper selection of mode options.
Gain
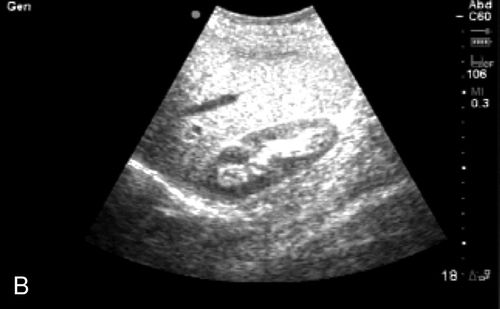
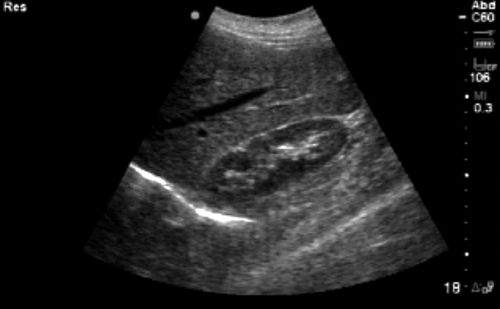
Gain is used to adjust the brightness of the acquired images. Optimizing gain is important to view structures adequately and accurately. Two common mistakes made when using gain are overgaining and undergaining. For example, when accessing a blood vessel under ultrasound guidance, the novice sonographer often underutilizes gain and significantly decreases the quality of the obtained images (Figure 11-2). Similarly, the overuse of gain when trying to obtain vascular access under ultrasound guidance may give the operator the false impression that a blood clot may exist because of the artifactual “smoky” appearance of the echogenic intravascular blood. Most machines have an auto-gain feature, which resets gain to a predetermined midrange level, which may be useful in circumstances when gain has been altered significantly by a prior user.15
Depth
The sonographer sets the image depth to adequately visualize structures. Standard practice is to start with a greater depth and decrease the field size to bring the structure of interest into the middle of the screen; this ensures that deep or distal pathology does not go unnoticed. It is important to have all critical anatomic structures visible when performing invasive procedures using bedside ultrasonography. For example, the diaphragm should be visualized when doing a thoracentesis for a pleural effusion to avoid a subdiaphragmatic puncture, and the accompanying artery should be visualized when cannulating central veins to avoid inadvertent arterial puncture.
Mode
The major modes available in bedside ultrasonography are two dimensional (2D), motion mode (M mode), and Doppler. Each mode provides a unique type of image and diagnostic information.
Two-Dimensional (2D) Mode
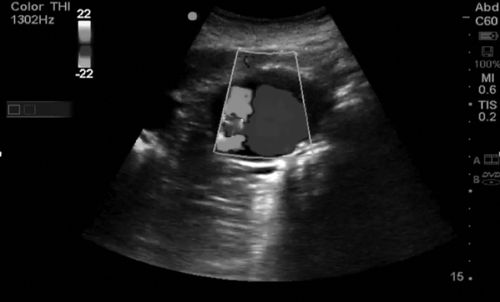
The most commonly known ultrasound is the 2D brightness mode, also known as the 2D or B-mode. The piezoelectric crystals within the probe generate sound waves that travel through tissues until they encounter structures within the body that reflect signal back to the probe. Depending on the composition and echogenicity of the object encountered, the waves are transmitted through, accelerated, deflected, or reflected back to the probe. Depending on signal strength, angle, and depth, the computer processes these signals and creates a gray-scale image that is generated from the composition of the returning signal. Highly reflective structures such as bone cortex and diaphragm appear hyperechoic or bright white. Fluid-filled structures transmit the signal without attenuation and appear anechoic or hypoechoic, that is, dark. Other tissues and fluids have intermediate properties and appear as different degrees of gray, depending on the density of the structures being imaged (Figure 11-3).
Motion Mode (M-Mode)
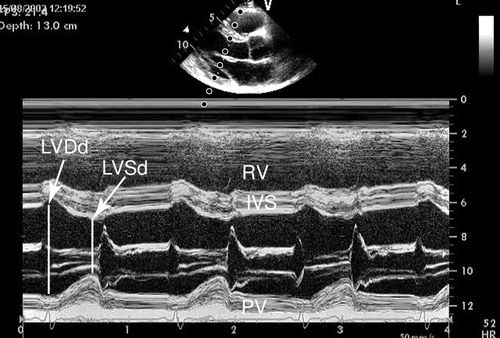
M-mode ultrasound is the original form of clinical ultrasound. This mode samples the anatomy along a single point of the ultrasound signal and reflects the information from that point graphically over time. M-mode provides a one-dimensional view of the structure of interest and is displayed as monochromic dots.16 M-mode was initially used to image the heart, but its application has been expanded to multiple anatomic structures (Figure 11-4). M-mode is utilized in several diagnostic-imaging procedures to provide additional information useful in measuring changes in distance and indirectly measuring changes in volume and pressure.
Doppler (Spectral, Color, and Power)
The Doppler mode measures the velocity of fluid being examined and relies on a principle known as the “Doppler shift” caused by the change in frequency from the transmitting to the receiving object from motion toward or away from the receiving object. An everyday illustration of the increase in the audible sound—heard as a barking dog approaches along with the decrease in sound as the dog moves away—is an example of the Doppler shift. The three principal types of Doppler used in clinical sonography are Spectral Doppler, color-flow Doppler, and power Doppler.
Spectral Doppler
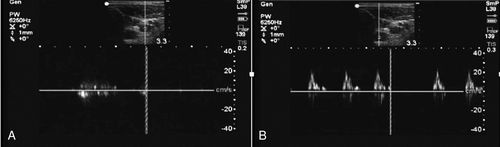
Spectral Doppler is a graphic measurement of fluid flow with time on the X-axis and velocity of flow on the Y-axis. High-velocity flow results in a taller peak on the Y-axis. Spectral Doppler displays the obvious difference between arterial and venous spectral Doppler signals (Figure 11-5).
Color Doppler
Color Doppler allows the sonographer to determine whether fluid is flowing toward or away from the transducer; to obtain this view, the transducer must be angled to one side or the other of the exact perpendicular position in reference to the pathway of the fluid flow. A red signal represents flow toward the transducer, and a blue signal indicates flow away from the transducer, as opposed to the common misbelief that red is arterial and blue is venous. A common mnemonic device to remember which color Doppler represents which direction of flow is the acronym BART—Blue Away Red Toward. When colors other than red or blue are seen, it is often a sign of turbulent blood flow, as is seen with valve stenoses (Figure 11-6).
Power Doppler
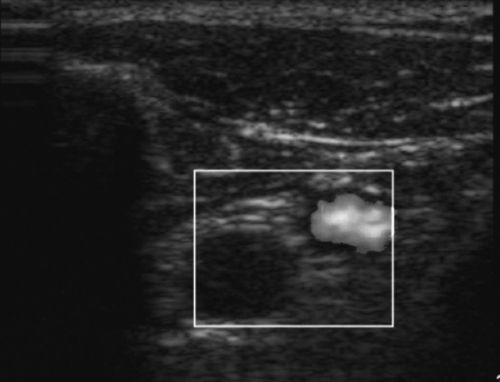
A colored signal is also produced with power Doppler, but a single yellow-orange color identifies qualitative presence or absence of low velocity flow within tissues. This differs from the color Doppler that measures directionality of flow, as indicated by blue or red, and the spectral Doppler that measures quantitative velocities. The power Doppler mode would be used to identify vascular flow in low-flow states, to rule out testicular torsion, to identify small capillaries, or to image joints for signs of inflammation (Figure 11-7).
Care of the Ultrasound Machine
It is important that probes are treated carefully as broken crystals lead to suboptimal imaging with streak artifact. Additionally, a common error is improper attention to the care of the cords that connect the probes to the computer. Damage to the cords from kinking or being run over by the wheels of the ultrasound cart will lead to suboptimal imaging over time.
Cleaning the Ultrasound Machine
Care of the ultrasound probes and the machine is an overlooked, but critical, component of successful point-of-care ultrasonography. The probe and computer processor of an ultrasound machine require chemical solutions different from those used on the screen. For example, manufacturers recommend cleaning the screen with water or an alcohol-based cleaner and a cotton cloth. Use of bleach-based cleansers or similar harsh disinfectants may create a cloudy film on the screen, which would cause permanent damage and interfere with image quality and interpretation. It is imperative that the housing of the computer, keyboard, knobs, and transducers be cleaned before and after each use of the machine, even if a sterile probe cover and gloves were used during contact with the patient. A soft cloth with an approved germicidal solution is recommended when cleaning the machine and components. The equipment should be allowed to air-dry after cleaning to avoid prematurely removing disinfectant. If a patient is in isolation for drug-resistant pathogens, a manufacturer-approved disinfectant needs to be used to clean the entire ultrasound system, including the transducers prior to further use. Ultrasound machines have been implicated in the transmission of nosocomial infections; therefore, ensuring proper hygiene is critical.17
Inspection of the probes after each use is equally vital, as damaged probes may serve as vectors for transmission of infection and may also provide suboptimal images, thus potentially hampering patient care. Last, it is important not to forget to clean the ultrasound gel bottle as well after each patient to avoid cross-contamination. Specific protocols with regard to the most effective way to clean the ultrasound machine and probes are available from manufacturers and are a useful reference.
Cardiac Assessment
Cardiac evaluation is the most challenging aspect of point-of-care ultrasonography to teach and to learn. Despite this fact, studies support that basic critical care and emergency echocardiography can be successfully taught to health care providers other than cardiologists with excellent results in terms of quality and reproducibility of image acquisition and accuracy of interpretation, comprehension, and proper integration into patient care.7,18 In a 2010 international expert statement regarding training for critical care ultrasonography, 29 experts and 12 professional critical care societies agreed that “basic level critical care echocardiography and general critical care ultrasound should be a required part of the training of every critical care unit physician.”19 The American College of Emergency Physicians (ACEP) has also recognized the indispensable nature of this diagnostic tool and routinely incorporates education on ultrasonography into its training pathways. In a consensus statement, the ACEP and the American Society of Echocardiography (ASE), state that “focused cardiac ultrasound has become a fundamental tool to expedite the diagnostic evaluation of the patient at the bedside and to initiate emergent treatment and triage decisions by emergency physicians.”6 The utility of this tool in the hands of the bedside clinicians has been clearly established, and its impact on patient care, decision making, and outcomes can be powerful.
Ultrasound Cardiac Windows
Three basic approaches or windows are taken to view the heart with the ultrasound. These include the subcostal, parasternal, and apical windows. Each view has its advantages and disadvantages. It is key to achieve competence in all windows, as many critically ill patients cannot be clearly imaged from every view because of multiple factors, including bowel gas, postsurgical changes, invasive tubes and lines, or inability to be repositioned because of hemodynamic instability. However, in one study that used a focused transthoracic echocardiographic protocol, usable images from at least one view were obtained in 97% of patients in the critical care unit. The information obtained from these examinations contributed positively to the assessment of patients in 97% of cases, provided new information in 35% of patients, and was decisive in enabling clear management in 25% of cases.12
Subcostal Window
The subcostal view of the heart takes advantage of the echogenicity of the liver to obtain a sonographic window of the heart, which sits on the opposite side of the diaphragm from where the probe comes into contact with the upper abdomen (Figure 11-8). For enough pressure and contact with the abdomen to obtain adequate images, this window is the only view of the heart that requires an overhand grip of the probe. As a result of the position of the probe that is relatively flat and almost parallel with the floor, this view may not be possible in patients with large abdomens as with pregnancy and massive ascites. It also may be a limited view after abdominal or cardiothoracic surgery because of overlying dressings, mediastinal tubes, or patient discomfort. The subcostal window gives a long-axis view of the heart and all four chambers, and has utility in providing information about each cardiac chamber in terms of static and dynamic parameters. The pericardium, as well as any pericardial effusion that may be present, is well visualized from this view. In cardiac tamponade, this is the preferred approach for emergent ultrasound-guided pericardiocentesis. In addition, from the subcostal view, the probe can be rotated into the longitudinal plane of the body to obtain an image of the inferior vena cava as it courses into the right atrium. The utility of this view is to acquire information on volume status and likelihood of response to volume resuscitation. Finally, the subcostal view is the preferred window in certain populations, including patients with chronic obstructive pulmonary disease (COPD) and cardiac arrest, because of the difficulty of obtaining transthoracic views in these patient populations.
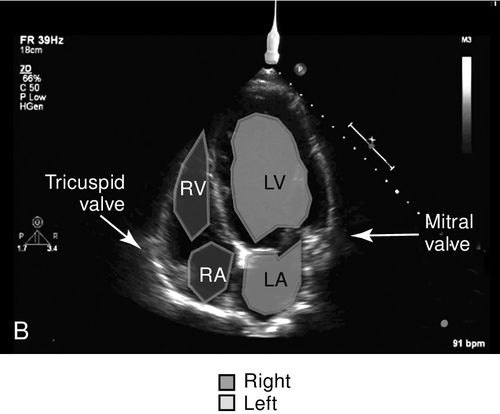
Apical Window
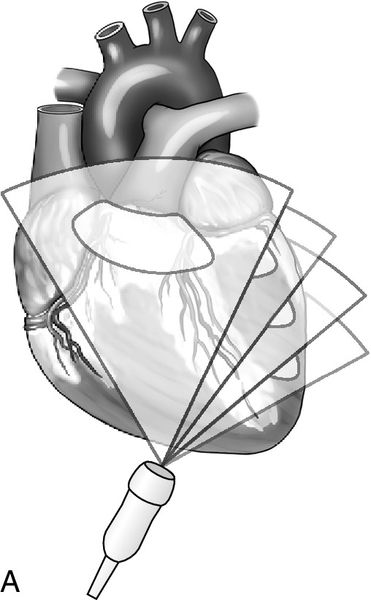
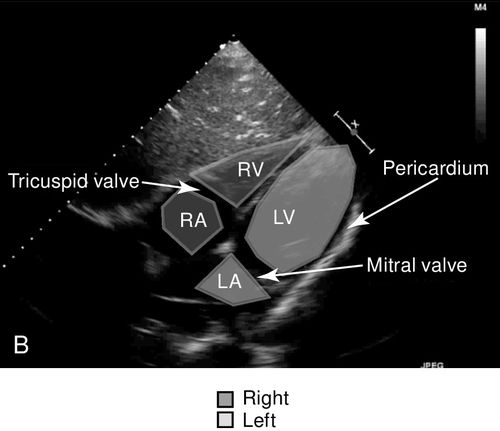
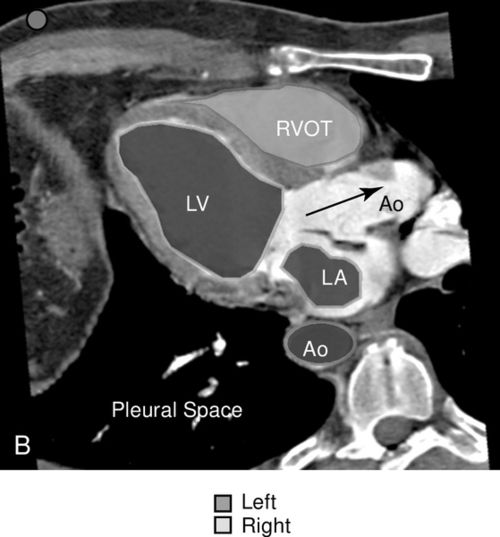
The apical views of the heart provide a long-axis, four-chamber view of the heart from the position of the apex of the heart where the point of maximal impulse is located (Figure 11-9). This view best shows the relative size and function of the right and left ventricles, evaluates for atrial enlargement, and is the optimal vantage point to assess mitral, tricuspid, and aortic insufficiency or stenosis with spectral Doppler because of the approximately parallel orientation with the flow of blood through these valves.
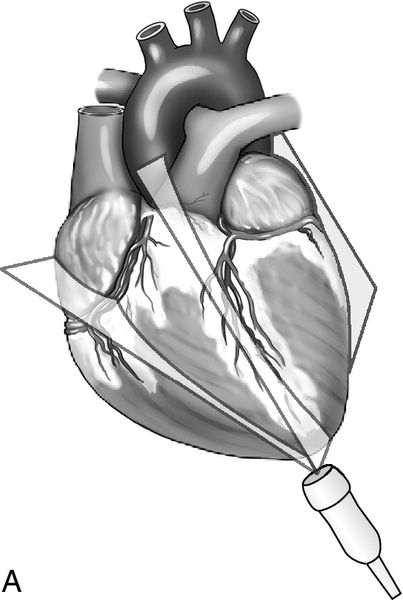
The aortic outflow tract is visualized via the apical window and is sometimes referred to as the fifth heart chamber. This view also enables evaluation of the pericardium and shows a portion of the pleural space as well as a cross-section of the descending aorta. This window is one of the key views needed to obtain velocity measurements across the aortic valve outflow tract, which are used in cardiac output calculations. Often, the patient must be positioned in the left lateral decubitus position with the left arm elevated above the head to achieve the apical images. This position serves to bring the heart close to the chest wall thereby displacing the poor acoustic medium of the lungs, and it also increases the space between ribs to reduce interference with the ultrasound beam. Again, this window may not be feasible in the critically ill or injured patient because of hemodynamic or spinal instability.
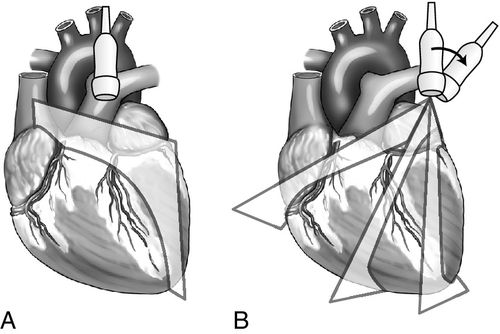
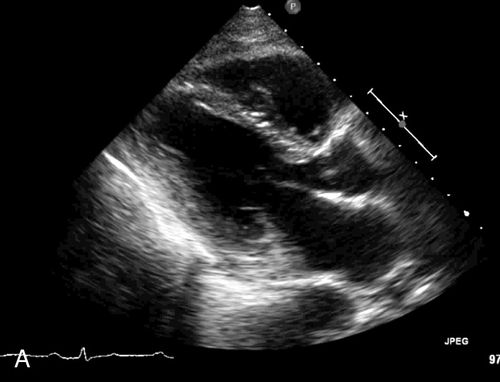
Parasternal View
The parasternal view of the heart is typically obtained in both parasternal long axis (PLAX) and parasternal short axis (PSAX), each with its own advantages (Figure 11-10). The PLAX view focuses the ultrasound vector along the long axis of the left ventricle and provides information regarding left ventricular (LV) size and function, interventricular septum size and function, left atrial size, mitral valve and aortic valve anatomy and function, aortic root size, ascending and descending aorta, pericardium, and pleural space. The descending aorta is a key landmark to differentiate pericardial fluid that lies between the heart and the descending aorta from pleural effusion that collects deep to this landmark. The long-axis view does not image the right ventricle in its entirety but, rather, only shows a portion of the right ventricular (RV) outflow tract (Figure 11-11). When the probe is rotated approximately 90 degrees clockwise from the long-axis position, the ultrasound beam divides the heart along its short axis. With proper angling, four levels of cross section can be imaged; these include the base with the aortic, tricuspid, and pulmonic valves, the mitral valve level, the papillary muscle level, and the apex.
Related posts:
 Hemodynamics of Sepsis
 Hemodynamic Management of Heart Failure and Cardiogenic Shock
 Hemodynamics of Mechanical Ventilation and Acute Respiratory Distress Syndrome
 Venous Oxygen Saturation Monitoring
 Hemodynamic and Intracranial Dynamic Monitoring in Neurocritical Care
 Oxygenation and Acid–Base Balance Monitoring
Stay updated, free articles. Join our Telegram channel

Full access? Get Clinical Tree


