Blood Flow
All of the blood ejected from the right ventricle flows through the pulmonary artery, which then rapidly divides into the capillary network that surrounds the alveoli.
Alveolar Gas Exchange Physiology
The capillary and alveolar walls are both very thin, which facilitates a rapid exchange of gases by passive diffusion along concentration gradients. This gas exchange between the alveoli and blood in the pulmonary capillaries occurs by passive diffusion; that is, oxygen moves from a region of high partial pressure in the alveolus to a region of low partial pressure in the pulmonary capillaries down a pressure gradient. Carbon dioxide moves in the opposite direction, from a region of high partial pressure in the pulmonary capillaries to low partial pressure within the alveolus (Figure 6-2).
In pulmonary physiology, the alveolus is abbreviated with an upper case “A,” whereas pulmonary capillary arterial blood is abbreviated as a lowercase “a.” Pulmonary venous blood is abbreviated with a lowercase “v.” The partial pressure is abbreviated as “P” and describes the dissolved state of the gas that exerts pressure to cross membranes. The normal partial pressure values of oxygen (O2) and carbon dioxide (CO2) in the pulmonary capillaries and the alveolus are shown in Figure 6-2.
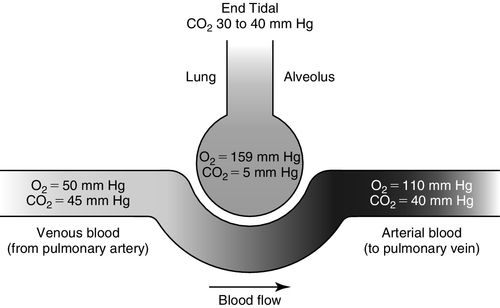
Dissolved venous carbon dioxide (PvCO2) moves from the capillaries into the alveolus (PACO2) because the concentration of carbon dioxide is higher in venous blood than in the alveolus (see Figure 6-2). Alveolar oxygen (PAO2) moves out of the alveolus into the pulmonary capillaries (PaO2) because the concentration of oxygen is higher in the alveolus than in the capillary and then onto the hemoglobin, thus saturating the hemoglobin with oxygen (see Figure 6-2). PaO2 represents the oxygen dissolved in arterial blood plasma. SaO2 represents the saturation of hemoglobin with oxygen when measured in arterial blood.
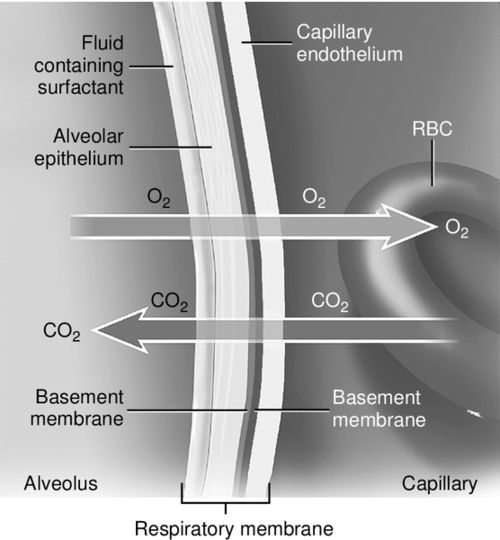
The distance between the alveolus and the capillary is approximately 0.7 micrometers. This tiny distance allows for extremely fast and efficient gas diffusion driven by the gas pressure gradients (see Figure 6-3). Once oxygen has passed through the alveolar and capillary walls, the oxygen primarily binds with hemoglobin to form oxyhemoglobin (SaO2) for transport throughout the circulatory system. The bound oxygen is the major component of oxygen content or availability as described in Box 6-1.
Alveolar Gas Exchange in Disease States
With alveolar disorders the amount of alveolar ventilation may be reduced. The alveolar wall may be thickened by fibrosis, the functional alveolar surface area may be diminished by collapse of the alveoli, or the diffusion distance may be widened by pulmonary edema. These conditions limit the mobilization of gas across the membrane.
Alternatively, blood supply (perfusion) may be impaired by a reduced cardiac output, in which case insufficient gas exchange occurs despite sufficient ventilation. It is imperative to remember that the only purpose of the pulmonary blood flow, which is powered by the right ventricle, is to provide a blood flow and gradient for gas exchange, which occurs between the thin membranes of the capillaries and the alveoli (see Figure 6-3).
Oxygen Transport and the Oxyhemoglobin Curve
Because oxygen is transported around the circulatory system attached to hemoglobin in blood, the saturation of hemoglobin with oxygen predicts the total content of oxygen (CaO2). The saturation mechanism is designed so that in circumstances where cellular demand is increased, hemoglobin will release oxygen to a dissolved state much more readily.
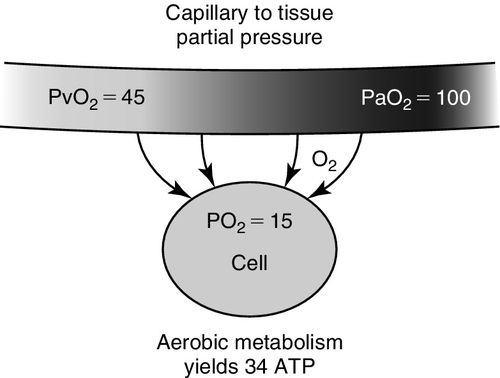
After leaving the alveolar capillary interface and the left ventricle, red blood cells flow and deform (change shape) as they move through systemic capillaries, continuously dissociating oxygen to maintain a relatively constant capillary partial pressure of oxygen in arterialized blood (PaO2). The PaO2 exerts an arterialized capillary partial pressure creating a diffusion gradient between two concentrations (capillary to cell) that will drive oxygen from high-pressure areas to low-pressure areas and from hemoglobin to dissolved state in the arterial vasculature (see Figure 6-4).
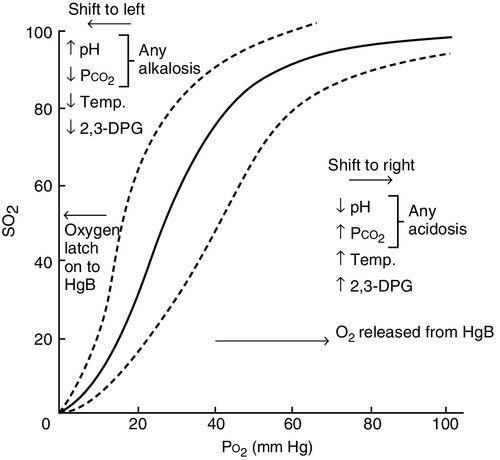
The rate of release of reservoir oxygen (SaO2) to the dissolved state (PaO2) and ultimately to the tissues depends on both cell demand and blood flow through the capillaries.6 This means that at all times, hemoglobin should release its bound oxygen reservoir (SaO2 or oxyhemoglobin), to the dissolved state (usable PaO2) when the cell “demands” more. This unique relationship is graphically represented by the oxyhemoglobin dissociation curve as shown in Figure 6-5. In other words, when cells consume more oxygen, the reserve or bound oxygen is released from hemoglobin, dissolves in blood, exerts a partial pressure, and is then available to be taken up by the cells. In order to meet the cell demand, which may be increased due to increased work of breathing, poor perfusion or hyper-inflammation, or because the delivery of oxygen is inadequate, hemoglobin releases oxygen more rapidly, shifting to the dissolved state. This is described as a shift to right of the oxyhemoglobin curve as indicated in Figure 6-5.
In the oxyhemoglobin curve, a shift to the right represents increased oxygen release and indicates that the proportional relationship between delivery and demand is increased on the demand side. Because the role of the hemoglobin is to transport and release oxygen where more dissolved oxygen is needed, higher tissue demand will result in a lower venous saturation in most clinical situations. Consequently, the evaluation of mixed venous (SvO2) and central venous (ScvO2) saturations, which represent the desaturation of hemoglobin, have become commonplace measurements in the critical care unit.7
When the oxyhemoglobin curve is said to shift to the left, this represents a decrease in the release of oxygen and may indicate that demand is low. Or failure of release of oxygen may be due to pathophysiologic conditions (shunt, sepsis, hemoglobin deformability) (see Figure 6-5).
Cellular operations are accomplished through the biochemical reactions that take place within the cell. Reactions are turned on and off, sped up, and slowed down according to immediate cellular needs and functions. Each process consumes cellular energy to produce energy, predominantly adenosine triphosphate (ATP). That energy (ATP) is best stored and created in the presence of oxygen (aerobically). Therefore, when tissues are more metabolically active, more oxygen is needed, and oxygen is released from circulating hemoglobin from reserve saturation of hemoglobin or SvO2, promoting a shift to the right in the dissociation curve (see Figure 6-5).
Basics in Cellular Gas Exchange and Metabolism: Internal Respiration
Energy metabolism is the general process by which living cells acquire and use the energy needed to stay alive, grow, heal, and reproduce. The production of acid associated with energy metabolism is a continuous process.
Under normal physiologic conditions, the human body generates 50 to 100 milliequivalents per day (mEq/day) of acid from metabolism of carbohydrates, proteins, and fats. To maintain acid–base homeostasis, the cellular acid production must be balanced by neutralization or excretion of acid. The lungs and kidneys are the main regulators of acid–base homeostasis. The lungs regulate carbon dioxide, an end product of carbonic acid (H2CO3), and the kidneys regulate the hydrogen ion (H+), also an end product of H2CO3.
Carbon dioxide is generated during the complete oxidation of carbohydrates and fatty acids. Most carbon dioxide is transported as H2CO3 in the bloodstream, as a combination of carbon dioxide (CO2) and water (H2O). The transformation of carbon dioxide and water ultimately yields H2CO3. When H2CO3 is presented to the alveoli by the pulmonary circulation, rapid dissociation takes place, yielding carbon dioxide and water, both of which are eliminated via the alveoli.
Acid Classification
Acids are primarily classified by the method utilized for excretion. Volatile acids require respiratory excretion, and fixed acids are cleared metabolically. Additionally, acids are named in accordance with their donation molecules (i.e., lactate, acetoacetate, beta-hydroxybutyrate, or carbon dioxide). For every one donator produced, one H+ is donated so the quantity of donator measured generally reflects the number of H+ ions that have been produced and donated into the blood in the original dissociation. The terms lactic acidosis or ketoacidosis indicate a dysfunctional metabolic process that results in a higher level of H+ released into the bloodstream. This is termed metabolic acidosis.
Lactate Production and Clearance
Cells balance catabolic and anabolic pathways to control levels of critical metabolites and ensure that sufficient energy is always available. During critical illness, lactate levels can be increased by a number of mechanisms. Originally, increased lactate was considered to only reflect tissue hypoxia. Hyperlactemia in critical illness is now considered to also result from, among other causes, reduced lactate clearance in the liver, relative to production or accelerated aerobic glycolysis that exceeds the oxidative capacity of mitochondria. This may be cytokine driven or catecholamine driven.8 Lactate measurement in critical illness may reflect the degree of global tissue anoxia and is one of the better predictors of potential organ damage.9
Evaluation of Pulmonary Blood Flow and Gas Exchange
Although lung oxygenation and ventilation are intimately related, each should be evaluated separately.
Ventilation–Perfusion Ratio and the Zones of the Lung
Pulmonary gas exchange represents the communication between recruited alveoli (V: ventilation) and pulmonary blood flow (Q: perfusion). The adequacy of pulmonary gas exchange is called the V/Q ratio. When alveoli receive optimal amounts of blood flow, at about 5 liters per minute (L/min) and optimal alveolar ventilation, at about 4 L/min, this will optimize gas exchange. In normal physiology, the match between ventilation and perfusion is about 80%. This is described as a normal V/Q ratio: 4 L alveolar ventilation divided by 5 L pulmonary perfusion = 0.8 (Box 6-2).
An important contributor to the V/Q ratio is the anatomical position of the lung and the pressurized distribution of gas. The zones of the lung divide each lung into three regions, based on the relationship between the pressure in the alveoli (PA), pressure in the arteries (Pa), and pressure in the veins (Pv) (Figure 6-6):
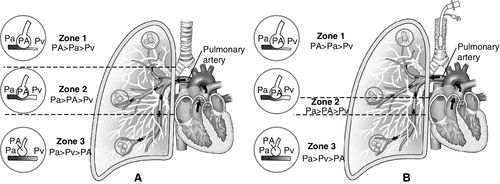
This model of the lung was developed by John B. West as shown in Figure 6-6.10 Other researchers also noted that vascular pressures in the pulmonary arteries and veins were lower at the top of the lung compared with the bottom of the upright lung; that is, pulmonary arterial pressures were lower than alveolar pressures in the upper lung regions when a person was upright. The characteristics of the three lung zones are listed in Table 6-1. The lung zones are altered by positive pressure ventilation as described next.
Table 6-1
Characteristics of Lung Zones: Normal and Positive Pressure Ventilation
< Less than; > greater than; = equals; PA, pulmonary alveolar pressure; Pa, pulmonary arterial pressure; PEEP, positive and expiratory pressure; Pv, pulmonary venous pressure; Q, perfusion; V, ventilation.
* See Figure 6-6, A.
** See Figure 6-6, B.
In the unhealthy lung, the V/Q ratio reflects a much slower gas mix resulting from altered distribution of gas to blood, often caused by atelectasis, acute respiratory distress syndrome (ARDS), or pulmonary embolism. When ventilation and perfusion do not match (V is higher than Q, or V is lower than Q) gas exchange will be significantly affected. When describing ventilation and perfusion matching, the surface areas of the lung are also dependent on lung positioning. Evaluation of the V/Q ratio and pulmonary gas exchange can be performed at any bedside by an array of parameters.
Oxygenation Monitoring
Continuous Oxygenation Monitoring—Pulse Oximetry
Oxygenation measured from the pulse oximeter assesses the amount of oxygen that is bound to hemoglobin (SpO2), measured by noninvasive plethysmography via a finger probe, ear sensor, or similar oximetry device. The value of pulse oximetry readings lies in its ability to noninvasively monitor oxygen exchange.
Pulse oximetry technology utilizes the light absorptive characteristics of hemoglobin in the arterial blood flow. The calculation of the percentage of arterial oxyhemoglobin is based on the distinct characteristics of light absorption (the red and near infrared light spectra) by oxygenated hemoglobin (O2Hb) versus deoxygenated hemoglobin (HHb). The light is absorbed differently by completely saturated hemoglobin versus deoxygenated hemoglobin and absorption varies by the monitoring wavelength used as shown in Figure 6-7.11
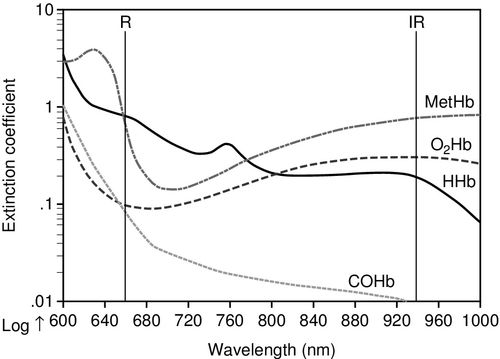
To obtain the SpO2 reading two light emitting diodes project a light through skin and tissues to detect visible red light at the 660 nanometer (nm) wavelength and near infrared light at the 940 nm wavelength. The pulse oximeter uses information from both wavelengths to measure the oxygen saturation. When hemoglobin is deoxygenated, near infrared light passes through easily and more red light is absorbed. In contrast, with highly oxygenated hemoglobin, red light passes more easily through the hemoglobin and more infrared light is absorbed.11 The normal SpO2 range is from 0.90 to 1.00 (90% to 100%) saturation of hemoglobin.
SpO2 is defined as the fraction of oxygenated hemoglobin relative to the total amount of hemoglobin. The pulse oximeter is a noninvasive measure of the saturation of hemoglobin using light wavelengths transmitted through a well-perfused area of the body such as the finger. The pulse oximeter measures the saturation of hemoglobin but one caveat is that it is not able to identify when the gas attached to the hemoglobin is not oxygen but is carbon monoxide, termed carboxyhemoglobin (COHb). Also, the pulse oximeter cannot identify other hemoglobin variants with altered oxygen binding. These are known as dyshemoglobinemias. Only co-oximetry using a blood sample in the clinical laboratory can accurately detect dyshemoglobins.11
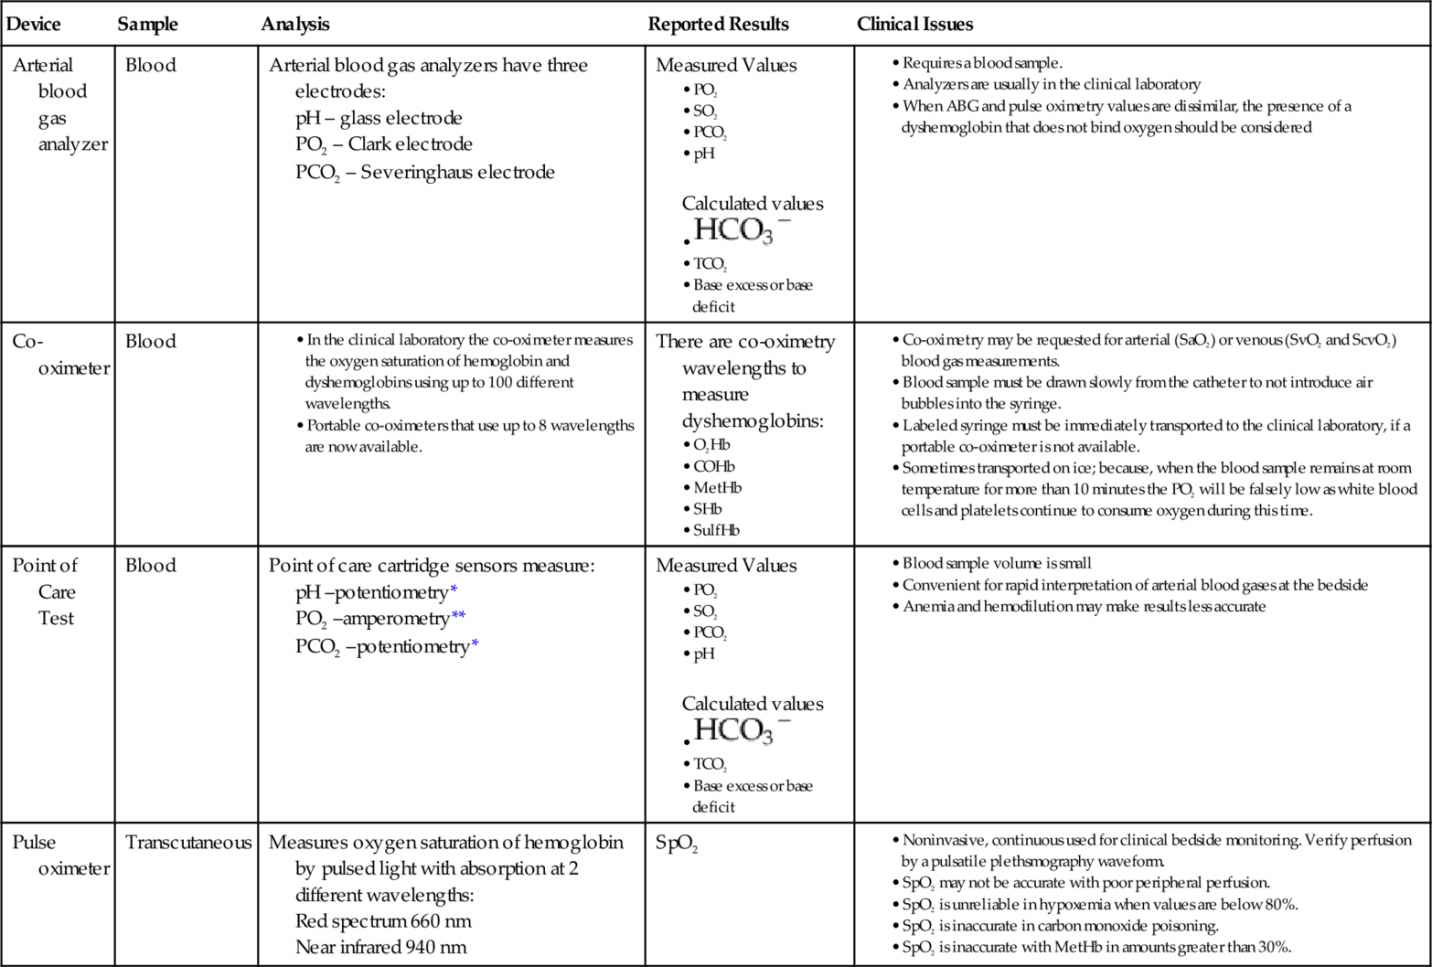
Co-oximetry, technically called spectrophotometry is generally used in the clinical laboratory as part of the ABGs analysis, although some portable co-oximeter devices are now available. Co-oximetry uses a light emission and absorption methodology to directly measure non-oxygen carrying dyshemoglobins, each one having an individual wavelength signature. The dyshemoglobins include carboxyhemoglobin (COHb), methemoglobin (MetHb) and sulfhemoglobin (SulfHb)11 (see Figure 6-7). Normal blood oxygen saturation, abbreviated as O2Hb or SO2, has its own individual wavelength pattern as shown in Figure 6-7. See Table 6-2 for a comparison of the different methods of oxygen measurement and the capability of different technologies to detect dyshemoglobins.11
Table 6-2
Comparison of Devices Used to Measure Oxygen
COHb, Carboxyhemoglobin; HCO3− , bicarbonate; HHb, deoxygenated hemoglobin; MetHb, methemoglobin; O2Hb, oxyhemoglobin; PCO2, partial pressure of carbon dioxide in blood; PO2, partial pressure of oxygen in blood; SaO2, oxygen saturation in arterial blood; ScvO2, mixed venous oxygen saturation; SHb, sickle cell hemoglobin; SO2, oxygen saturation in blood; SpO2, oxygen saturation from a pulse oximeter; SulfHb, sulfhemoglobin; TCO2, total carbon dioxide.
* Potentiometry uses two electrodes; one is the reference electrode with a known electrode potential. The other electrode is the test electrode. The Nernst Equation is used to calculate the result.
** Amperometry is the measurement of current flow produced by an oxidation-reduction reaction.
SaO2 is measured from a blood sample by a laboratory or a point-of-care co-oximeter. Laboratory co-oximeters use multiple wavelengths to distinguish additional types of hemoglobin such as carboxyhemoglobin (carbon monoxide + hemoglobin). In healthy persons, SaO2 and the SpO2 will be almost identical. However, in the setting of carbon monoxide poisoning, only the SaO2 blood gas value measured by co-oximetry will be accurate.
Because oxygen is transported around the vascular system primarily attached to hemoglobin in blood, SpO2 can provide an approximation of the total amount of oxygen available, if needed. Saturated hemoglobin (oxyhemoglobin) provides the reservoir for available oxygen to be used at the cellular level. The oximetry sensor does not measure or predict cellular use of oxygen.
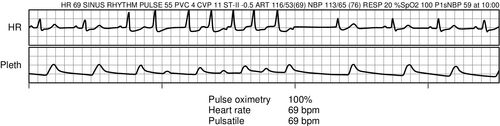
The pulse oximeter waveform, known as plethysmography, may also be used to monitor perfusion and variability of perfusion, as seen with an irregular heart rate that results in variable stroke volumes as shown in Figure 6-8. Pulse oximetry may inaccurately reflect saturation of hemoglobin in low-perfusion states. This often occurs when patients are critically ill, and lung gas exchange is negatively affected by alveolar dysfunction, pulmonary blood flow, poor perfusion, cardiac dynamics, and amount of hemoglobin. It is not uncommon to accept a lower SpO2 (88%)10 in the absence of tissue hypoxia indicators, such as lactic acid, unexpected hyperkalemia, wide anion gap, decreasing bicarbonate, base deficit, and decreasing serum carbon dioxide, on a venous blood sample.
SpO2 and SaO2 are often used to successfully guide oxygen therapy administration. However, there are clinical circumstances where the SpO2 may not be accurate, as listed in Box 6-3.
SpO2 monitoring does not provide information about level of carbon dioxide in the bloodstream. In the setting of hypoventilation where supplemental oxygen is administered, the high flow of oxygen into the alveoli and bloodstream produces a normal SpO2, which may provide a false sense of security in the setting of hypoventilation and rising PaCO2, as described in Box 6-4.
Pulse oximetry does not provide any information about ventilation. That information is obtained by clinical assessment of respiratory rate, chest movement, level of consciousness, ABG analysis and capnography monitoring of end-tidal carbon dioxide (ETCO2). Capnography monitoring is discussed in detail in Chapter 8.
Arterial Blood Gas
The most common reasons for obtaining an ABG are summarized in Box 6-5. Other less obvious reasons include assessment of metabolic derangements and the need to provide evidence that tissues are functioning aerobically (using oxygen) or anaerobically (without oxygen, thus producing lactic acid). One of the most important considerations when drawing an ABG is to minimize the time delay that may occur between obtaining the sample, analysis, and notification. The increased use of bedside point-of-care measurement has significantly improved data retrieval.13
Bound Oxygen in Arterial Blood
Hemoglobin is the second most important component contributing to oxygen delivery. In an acute short-term crisis, the saturation–desaturation ratios are rapidly responsive to changes in ventilation, cardiac output, hemoglobin oxygen affinity, and the cellular environment. The oxygen saturation of hemoglobin is defined as the amount of oxygen combined with hemoglobin in proportion to the amount of oxygen the hemoglobin is capable of carrying. It is expressed as a percentage of a ratio of content to capacity. When measured by co-oximetry in arterial blood, this is referred to as saturation of the arterial blood (SaO2), and in the venous blood as saturation of the venous blood (SvO2).
SaO2 should be directly reflective of the oxygen administered written as the fraction of inspired oxygen (FiO2) and the gas in the alveoli (PAO2) as shown:
FiO2⇒PAO2⇒SaO2.

Dissolved Oxygen in Arterial Blood
PaO2 is a measure of the dissolved gas in the bloodstream that creates a pressure and is immediately usable. The PaO2 is normally about 70 to 100 millimeters of mercury (mm Hg) and is an important measure for the assessment of the V/Q ratio. In healthy lungs, the higher the alveolar oxygen (PAO2) relating to oxygen administration and alveolar recruitment, the higher the arterial oxygen (PaO2) should become. In a normal healthy lung, PaO2 should equal about five times the oxygen administered or FiO2; that is, if the FiO2 is 1.0 (100%) the PaO2 should be close to 500 mm Hg. This may be described as:
FiO2⇒PAO2⇒SaO2⇒PaO2

When breathing at sea level, the normal oxygen concentration of room air is 0.21, or 21%. The normal PaO2 is between 70 and 100 mm Hg, and an SaO2 of greater than 94% is considered acceptable. Age and disease process may affect what would be considered normal.
The adequacy of the V/Q ratio depends on the oxygen concentration gradient on either side of the pulmonary surface area, alveolar recruitment, the permeability and width of the alveolar–capillary membrane, and the contact time of hemoglobin with this gas exchange membrane based on heart rate and cardiac output (refer to Figures 6-1 through 6-3). Pathologies affecting the functional diffusion layer or the gas exchange surface area, such as pulmonary edema or pulmonary fibrosis, will lower the PaO2, particularly when measured in proportional ratio to the FiO2. Disturbances of the V/Q ratio in asthma, pulmonary embolism, ARDS, and circulatory failure also lower the PaO2.
PaO2 directly affects the amount of oxygen available to the mitochondria within the cell, as cells voraciously consume oxygen. In other words, PaO2 may be considered as an indirect measure of the oxygen available for tissue metabolism.
FiO2⇒PAO2⇒SaO2⇒PaO2⇒CellularO2CellularDemand

When the level of oxygen dissolved in plasma is inadequate for tissue consumption, ideally the cardiac output will increase by increasing heart rate and/or stroke volume. Additionally the oxyhemoglobin curve may shift to the right representing a release of oxygen more rapidly. This is often evaluated with continuous or intermittent SvO2 monitoring. If these adaptations are unsuccessful, ultimately cells may shift to anaerobic metabolism (without oxygen), consuming more adenosine triphosphate (ATP) than can be produced and yielding higher levels of lactate, while donating H+ into the plasma.
FiO2⇒PAO2⇒SaO2⇒PaO2⇒CellularO2CellularDemand⇒PvO2⇒SvO2

Methods for Evaluating the Relationship of Ventilation to Perfusion
To evaluate the relationship of ventilation to perfusion more thoroughly, PaO2 must always be correlated with the ventilation therapy applied to the patient. The PaO2 level that prompts many clinicians to make a diagnosis of hypoxemia and failure of lung gas exchange is generally in the range of 60 to 75 mm Hg. Hypoxemia increases the likelihood of tissue deficits,14 Table 6-3 lists the terms of hypoxemia classification.
Table 6-3
Categorization of Hypoxemia Based on Physiologic Responses and Duration of Onset
| Hypoxemia Term | Description and Onset |
| Acute hypoxemia | A rapid decline in arterial oxygenation developing over < 6 hours (e.g., acute upper airway obstruction) |
| Subacute hypoxemia | Reduced arterial oxygenation occurring in 6 hours to 7 days (e.g., pneumonia) |
| Sustained hypoxemia | Reduced arterial oxygenation for 7 to 90 days (e.g., prolonged acute respiratory distress syndrome, high-altitude climbing expeditions) |
| Chronic hypoxemia | Prolonged reduction of arterial oxygenation for over 90 days (e.g., chronic obstructive pulmonary disease) |
| Generational hypoxemia | Cross-generational reduced arterial oxygenation (e.g., Tibetan highland residents) |
Note: In the absence of any universally accepted terminology describing the time-related differences in responses to hypoxemia, the proposed criteria are based on human physiologic adaptations to hypoxemia.
Acute Respiratory Distress Syndrome
The ARDSnet trial was a landmark study that demonstrated that mechanical ventilation with smaller tidal volumes and standardized levels of positive end expiratory pressure (PEEP) reduced mortality in patients with acute respiratory distress syndrome (ARDS) (see Table 6-4).15 The American-European Consensus Conference on ARDS (2012) defined ARDS predominantly by degree of hypoxemia using the PaO2/FiO2 ratio (P/F ratio) as the major oxygenation criterion (The Berlin Definition).16
Table 6-4
Comparison of ARDSnet and Berlin Criteria for Acute Respiratory Distress Syndrome (ARDS)
cm H2O, Centimeters of water; CPAP, continuous positive airway pressure; CT, computed tomography; FiO2, fraction of inspired oxygen; mm Hg, millimeters of mercury; P/F, PaO2/FiO2 ratio; PAOP, pulmonary artery occlusion pressure; PEEP, positive end expiratory pressure.
The previous ARDS definition (1992) did not take into consideration the level of PEEP required to maintain acceptable levels of oxygenation.17 The issue of hypoxemia is typically addressed first by increasing the FiO2. Clinicians evaluate the proportional gas exchange and response to therapy in a number of ways, typically beginning with the P/F ratio. The P/F ratio is based on the gold standard alveolar (A) to arterial (a) difference or gradient (A-a gradient). Therapeutic considerations for managing PaO2 are listed in Box 6-6.
PaO2/FiO2 Ratio
The most frequently used pulmonary oxygenation assessment method is the P/F ratio. Normal ratio values are greater than 250 on 0.4 (40%) FiO2. A P/F ratio less than 300 indicates severe respiratory failure usually ARDS. See Box 6-7 for a case example demonstrating P/F ratio assessment.
Alveolar–Arterial Gradient
The gold standard to evaluate the relationship of ventilation to perfusion is the comparison of FiO2 delivered into the alveoli (PAO2) and the responding measure of gas dissolved in the arterial blood (PaO2). Since oxygen enters the pulmonary capillary blood by passive diffusion (see Figure 6-1), it follows that in a steady state the alveolar pressure (PAO2) must always be higher than the arterial pressure of oxygen (PaO2). The difference between alveolar oxygen (calculated PAO2) and arterial oxygen (measured PaO2) on room air (0.21) is usually less than 20 mm Hg. When FiO2 is 1.00 (100%) the difference should be less than 95 mm Hg.18
This evaluation, known as the alveolar–arterial difference in oxygen (A-a DO2 or A-a gradient) requires some calculations to assure that the ventilation support and oxygen support provided to the patient is appropriate especially when making changes in ventilatory and oxygen therapies. The A-a difference is helpful primarily when a patient retains carbon dioxide, as in chronic obstructive pulmonary disease (COPD) or severe asthma. See Box 6-8 for a calculation using this formula and Box 6-9 for a clinical example.
Box 6-8
Calculation of the Alveolar–Arterial (A-a) Gradient
The alveolar gas equation makes it simple to calculate PAO2. This simplified formula incorporates the following steps:
Related posts:
 Hemodynamics of Sepsis
 Hemodynamic Management of Heart Failure and Cardiogenic Shock
 Hemodynamics of Mechanical Ventilation and Acute Respiratory Distress Syndrome
 Venous Oxygen Saturation Monitoring
 Ultrasonography-Based Hemodynamic Monitoring
 Hemodynamic and Intracranial Dynamic Monitoring in Neurocritical Care
Stay updated, free articles. Join our Telegram channel

Full access? Get Clinical Tree


