Chapter 3 Ultrasonography in Airway Management
II The Ultrasound Image and how to Obtain It
Ultrasound refers to sound frequencies beyond 20,000 Hz; frequencies from 2 to 15 MHz are typically used for medical imaging. Ultrasound transducers act as both transmitters and receivers of reflected sound. Tissues exhibit differing acoustic impedance values, and sound reflection occurs at the interfaces between different types of tissues. The impedance difference is greatest at interfaces of soft tissue with bone or air. Some tissues give a strong echo (e.g., fat, bone); these are called hyperechoic structures, and they appear white. Other tissues let the ultrasound beam pass easily (e.g., fluid collections, blood in vessels) and therefore create only a weak echo; these are hypoechoic structures and appear black on the screen. When the ultrasound beam reaches the surface of a bone, a strong echo (i.e., a strong white line) appears, and there is a strong absorption of ultrasound, resulting in depiction of only a limited depth of the bony tissue. Nothing is seen beyond the bone because of acoustic shadowing. Cartilaginous structures such as the thyroid cartilage, the cricoid cartilage, and the tracheal rings, appear homogeneously hypoechoic (black), but the cartilages tend to calcify with age.1
Muscles and connective tissue membranes are hypoechoic but have a more heterogeneous, striated appearance than cartilage does. Glandular structures such as the submandibular and thyroid glands are homogeneous and mildly to strongly hyperechoic in comparison with adjacent soft tissues. Air is a very weak conductor of ultrasound, so when the ultrasound beam reaches the border between a tissue and air, a strong reflection (strong white line) appears, and everything on the screen beyond that point represents only artifacts, especially reverberation artifacts, which create multiple parallel white lines on the screen. However, the artifacts that arise from the pleura/lung border often reveal useful information. Visualization of structures such as the posterior pharynx, posterior commissure, and posterior wall of the trachea is prevented by intraluminal air.1 In B-mode USG, an array of transducers simultaneously scans a plane through the body that can be viewed as a two-dimensional image on the screen, depicting a “slice” of tissue.
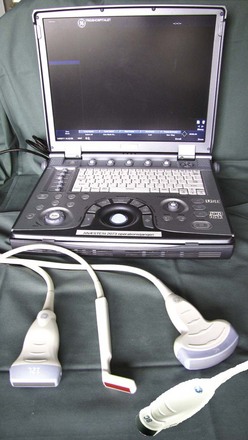
The higher the frequency of the ultrasound wave, the higher the image resolution and the less penetration in depth. All modern ultrasound transducers used in airway management have a range of frequencies that can be adjusted during scanning to optimize the image. The linear high-frequency transducer (Fig. 3-1) is the most suitable for imaging superficial airway structures (within 2 to 3 cm from the skin). The curved low-frequency transducer is most suitable for obtaining sagittal and parasagittal views of structures in the submandibular and supraglottic regions, mainly because of its wider field of view.1 The micro convex transducer gives a wide view of the pleura between two ribs. If only one transducer must be chosen, then a linear high-frequency transducer will enable performance of most ultrasound examinations that are relevant for airway management.
Because air does not conduct ultrasound, the probe must be in full contact with the skin or mucosa without any interfacing air.2 This is achieved by applying judicious amounts of conductive gel between the probe and the skin. Because of the prominent thyroid cartilage, it is sometimes a challenge to avoid air under the probe when performing a sagittal midline scan from the hyoid bone to the suprasternal notch in a male patient. Portable machines can provide accurate answers to basic questions and are sufficient for airway USG.3
III Visualizing the Airway and the Adjacent Structures
A Mouth and Tongue
USG is a simple method for examination of the mouth and its contents. The tongue is composed of an anterior mobile part situated in the oral cavity and a fixed pharyngeal portion. The lingual musculature is divided into the extrinsic muscles (which have a bony insertion and alter the position of the tongue) and intrinsic muscles, whose fibers alter the shape of the tongue.4 The tongue can be visualized from within the mouth, but the image may be difficult to interpret.5,6
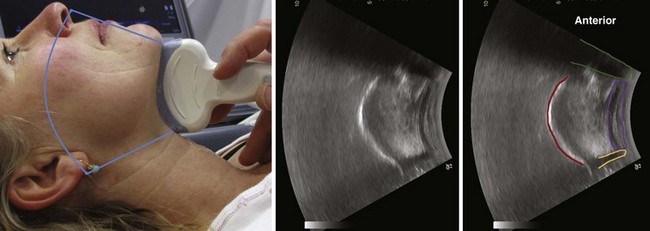
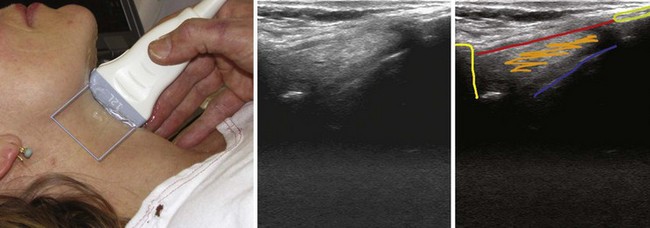
The floor of the mouth and the tongue are easily visualized by placing the transducer submentally. If the transducer is placed in the coronal plane just posterior to the mentum and from there moved posteriorly until the hyoid bone is reached, one can perform a thorough evaluation of all the layers of the floor of the mouth, the muscles of the tongue, and any possible pathologic processes (Fig. 3-2). The scanning image will be flanked by the acoustic shadow of the mandible on each side. The dorsal lingual surface is clearly identified.7 The width of the tongue base can be measured in a standardized way by locating the two lingual arteries with Doppler ultrasound and measuring the distance between these arteries where they enter the tongue base at its lower lateral borders.8 A longitudinal scan of the floor of the mouth and the tongue is obtained if the transducer is placed submentally in the sagittal plane. If a large convex transducer is used, the whole length of the floor of the mouth and the majority of the length of the tongue can be seen in one image (Fig. 3-3). The acoustic shadows from the symphysis of the mandible and from the hyoid bone form the anterior and posterior limits of this image. Detailed imaging of the function of the tongue, including bolus holding, lingual propulsion, lingual-palatal contact, tongue tip and dorsum motion, bolus clearance, and hyoid excursion, can be evaluated in this plane.7
When the tongue is in contact with the palate, the palate can be visualized; if there is no contact with the palate, the air at the dorsum of the tongue will make visualization of the palate impossible. An improved image is achievable if water is ingested and retained in the oral cavity. The water eliminates the air-tissue border and allows visualization of most of the oral cavity including the palate (Fig. 3-4), as well as a better differentiation of the hard palate from the soft palate.4
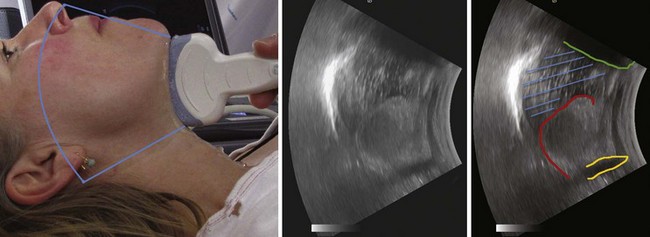
Figure 3-4 The tongue and the mouth are filled with water. Placement of the transducer is the same as in Figure 3-3. The shadow from the mentum of the mandible is outlined in green, the shadow from the hyoid bone in light orange, and the dorsal surface of the tongue in red. The blue lines indicate the water in the mouth. The large white line represents the strong echo from the hard palate.
(From Kristensen MS: Ultrasonography in the management of the airway. Acta Anaesthesiol Scand 55:1155–1173, 2011.)
The tongue can be visualized in detail with the use of three-dimensional USG.9 In a child, the major anatomic components of the tongue and mouth are covered by four scanning positions: the midline sagittal, the parasagittal, the anterior coronal, and the posterior coronal planes.10 In the transverse midline plane just cranial to the hyoid bone, the tongue base and the floor of the mouth are seen. In the transverse (axial) plane in the midline, the lingual tonsils and the valleculae can be imaged. The vallecula is seen just below the hyoid bone, and when the probe is angled caudally, the preglottic and paraglottic spaces and the infrahyoid part of the epiglottis are seen.11
B Oropharynx
Imaging of a part of the lateral border of the mid-oropharynx can be obtained by placing the transducer vertically with its upper edge approximately 1 cm below the external auditory canal.7 The lateral pharyngeal border and the thickness of the lateral parapharyngeal wall can be determined.12 The parapharyngeal space can also be visualized via the mouth by placing the probe directly over the mucosal lining of the lateral pharyngeal wall, but this approach is difficult for the patient to tolerate.13
C Hypopharynx
By performing USG through the thyrohyoid membrane, cricothyroid space, cricothyroid membrane (CTM), and thyroidal cartilage lamina and along the posterior edge of the thyroid lamina, it is possible to locate and classify hypopharyngeal tumors with a success rate as high as that achieved with computed tomography (CT) scanning.14
D Hyoid Bone
The hyoid bone is a key landmark that separates the upper airway into two scanning areas: the suprahyoid and infrahyoid regions. The hyoid bone is visible on the transverse view as a superficial, hyperechoic, inverted U–shaped, linear structure with posterior acoustic shadowing. On the sagittal and parasagittal views, the hyoid bone is visible in cross section (see Fig. 3-4) as a narrow, hyperechoic, curved structure that casts an acoustic shadow.1
E Larynx
Because of the superficial location of the larynx, USG offers images of higher resolution than CT or magnetic resonance imaging (MRI) when a linear high-frequency transducer is used.11 The different parts of the laryngeal skeleton have different sonographic characteristics.15 The hyoid bone is calcified early in life, and its bony shadow is an important landmark. The thyroid and cricoid cartilages show variable but progressive calcification throughout life, whereas the epiglottis stays hypoechoic. The true vocal cords overlie muscle that is hypoechoic, whereas the false cords contain echoic fat.
The thyrohyoid membrane runs between the caudal border of the hyoid bone and the cephalad border of the thyroid cartilage and provides a sonographic window through which the epiglottis can be visualized in all subjects when the linear transducer is oriented in the transverse plane (with varying degrees of cephalad or caudad angulation).1 The midline sagittal scan through the upper larynx from the hyoid bone cranially to the thyroid cartilage distally (Fig. 3-5) reveals the thyrohyoid ligament, the pre-epiglottic space containing echogenic fat, and, posterior to that, a white line representing the laryngeal surface of the epiglottis.15 On parasagittal view, the epiglottis appears as a hypoechoic structure with a curvilinear shape; on transverse view, it is shaped like an inverted C. It is bordered anteriorly by the hyperechoic, triangular pre-epiglottic space and lined posteriorly by a hyperechoic air-mucosa interface.16 In a convenience sample of 100 subjects, the transverse midline scan cranially to the thyroid cartilage depicted the epiglottis in all subjects and revealed an average epiglottis thickness of 2.39 mm.17
In the cricothyroid region, the probe can be angled cranially to assess the vocal cords and the arytenoid cartilages and thereafter moved distally to access the cricoid cartilages and the subglottis.11 With transverse scanning in the paramedian position, the following structures can be visualized (starting cranially and moving distally): faucial tonsils, lateral tongue base, lateral vallecula, strap muscles, laminae of the thyroid cartilage, the lateral cricoid cartilage, and, posteriorly, the piriform sinuses and the cervical esophagus.11
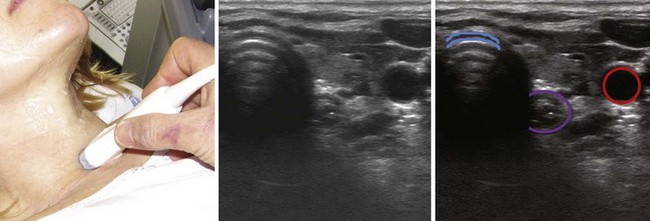
The laryngeal cartilage is noncalcified in the child, but calcification starts in some individuals before 20 years of age, and it increases with age. In subjects with noncalcified cartilage, the thyroid cartilage is visible on sagittal and parasagittal views as a linear, hypoechoic structure with a bright air-mucosa interface at its posterior surface. On the transverse view, it has an inverted V shape (Fig. 3-6), within which the true and false vocal cords are visible.1 By 60 years of age, all individuals show signs of partial calcification, and approximately 40% of the cartilage at the level of the vocal cords is calcified.18 The calcification is seen as a strong echo with posterior acoustic shadowing. Often the anatomic structures can be visualized despite the calcifications by angling the transducer. In a population of patients who were examined due to suspicion of laryngeal pathology, a sufficient depiction of the false cords was obtained in 60% of cases, of the vocal cords in 75%, of the anterior commissure in 64%, and of the arytenoid region in 71%; in 16% of cases, no endolaryngeal structures could be depicted.18
F Vocal Cords
In individuals with noncalcified thyroid cartilages, the false and the true vocal cords can be visualized through the thyroid cartilage.15 In individuals with calcified thyroid cartilage, the vocal cords and the arytenoid cartilages can still be seen by combining the scan obtained by placing the transducer just cranially to the superior thyroid notch angling it caudally with the scans obtained from the CTM in the midline and on each side with the transducer angled 30 degrees cranially.11 In a study group of 24 volunteers with a mean age of 30 years, the thyroid cartilage provided the best window for imaging the vocal cords. In all participants, it was possible to visualize and distinguish the true and false vocal cords by moving the transducer in a cephalocaudad direction over the thyroid cartilage.1
The true vocal cords appear as two triangular, hypoechoic structures (the vocalis muscles) outlined medially by the hyperechoic vocal ligaments (see Fig. 3-6). They are observed to oscillate and move toward the midline during phonation.1 In a study of 229 participants ranging in age from 2 months to 81 years, the true and false cords were visible in all female participants. In males, the visibility was 100% for those younger than 18 years and gradually decreased to less than 40% in males 60 years of age and older.19 The false vocal cords lie parallel and cephalad to the true cords, are more hyperechoic in appearance, and remain relatively immobile during phonation.
G Cricothyroid Membrane and Cricoid Cartilage
The CTM runs between the caudal border of the thyroid cartilage and the cephalad border of the cricoid cartilage. It is clearly seen on sagittal (Fig. 3-7) and parasagittal views as a hyperechoic band linking the hypoechoic thyroid and cricoid cartilages.1 The cricoid cartilage has a round, hypoechoic appearance on the parasagittal view and an arch-like appearance on the transverse view.
H Trachea
The location of the trachea in the midline of the neck makes it a useful reference point for transverse ultrasound imaging. The cricoid cartilage marks the superior limit of the trachea; it is thicker than the tracheal rings below and is seen as a hypoechoic, rounded structure. It serves as a reference point during performance of the sagittal midline scan (see Fig. 3-7). Often the first six tracheal rings can be imaged when the neck is in mild extension.13 The trachea is covered by skin, subcutaneous fat, the strap muscles, and, at the level of the second or third tracheal ring, the isthmus of the thyroid gland (see Fig. 3-7). The strap muscles appear hypoechoic and are encased by thin hyperechoic lines from the cervical fascia.13 A high-riding innominate artery may be identified above the sternal notch as a transverse anechoic structure crossing the trachea.13 The tracheal rings are hypoechoic, and they resemble a “string of beads” in the parasagittal and sagittal plane (see Fig. 3-7). In the transverse view, they resemble an inverted U highlighted by a hyperechoic air-mucosa interface (Fig. 3-8) and by reverberation artifact posteriorly.1
I Esophagus
The cervical esophagus is most often visible posterolateral to the trachea on the left side at the level of the suprasternal notch (see Fig. 3-8). The concentric layers of esophagus result in a characteristic “bull’s-eye” appearance on USG. The esophagus can be seen to compress and expand with swallowing, and this feature can be used for accurate identification.13 The patient may be placed in a modified position for examining the esophagus by slightly flexing the neck with a pillow under the head and turning the head 45 degrees to the opposite side while the neck is scanned on either side; this technique makes the esophagus visible also on the right side in 98% of cases.20
J Lower Trachea and Bronchi
Transesophageal USG displays a part of the lower trachea. When a saline-filled balloon is introduced in the trachea during cardiopulmonary bypass, it is possible to perform USG through the trachea, thus displaying the proximal aortic arch and the innominate artery.21 The bronchial wall and its layers can be visualized from within the airway by passing a flexible ultrasound probe through the working channel of a flexible bronchoscope. This technique, called end bronchial ultrasound, reliably distinguishes between airway infiltration and compression by tumor.22
K Peripheral Lung and Pleura
The ribs are identifiable by their acoustic shadow, and between two ribs a hyperechoic line is visible. This line, called the pleural line, represents the interface between the soft tissue of the chest wall and air (Fig. 3-9). In the normal breathing or ventilated subject, one can identify a kind of to-and-fro movement synchronous with ventilation; this is called “pleural sliding” or “lung sliding.”23 The movement is striking because the surrounding tissue is motionless.24 Lung sliding is best seen dynamically, in real time or on video.25
The investigation should always start by placing the probe perpendicular to the ribs and in such a way that two rib shadows are identified. The succession of the upper rib, pleural line, and lower rib outlines a characteristic pattern, the “bat sign” (see Fig. 3-9) and must be recognized to correctly identify the pleural line and avoid interpretation errors due to a parietal emphysema. Lung ultrasound examination should therefore be considered not feasible if the bat sign is not identified.26 Lung sliding can be objectified using the time-motion mode, which highlights a clear distinction between a wave-like pattern located above the pleural line and a sand-like pattern below, called the “seashore sign” (see Fig. 3-9).26
In breath-holding or apnea, there is no lung sliding, but a “lung pulse”—small movements synchronous with the heartbeat—is seen instead (Fig. 3-10). The lung pulse can be explained as the vibrations of the heart are transmitted through a motionless lung. The lung pulse can also be demonstrated in the time-motion M-mode scanning. There is a strong echo from the pleural line, and dominant reverberation artifacts of varying strength are seen. They appear as lines parallel to the pleural line and spaced with the same distance as the distance from the skin surface to the pleural line. These “A-lines” are seen in both the normal and the pathologic lung.26
Stay updated, free articles. Join our Telegram channel

Full access? Get Clinical Tree


