
SCORING SYSTEMS FOR INJURY AND EMERGENCY GENERAL SURGERY
SCORING SYSTEMS FOR INJURY
Introduction
Modern injury severity scoring is an important aspect of managing injured patients because it allows the quantification of an injury and the probability of survival based on the injury scale score. In the field injury, scoring has been used to create field triage systems, and in smaller hospitals, it can be used to aid in the determination of which patients should be transferred to higher levels of care. An important purpose of any scoring system is to allow comparison between similarly injured patients treated at different hospitals and in different trauma systems. Injury scoring controls bias in research by allowing comparison between similarly injured patient populations. The ideal scoring system allows the correlation of increasing injury with mortality, and considers anatomic injury, physiologic derangement, and the comorbid conditions of the patient. The score should be easily calculated and reproducible. Injury scoring systems attempt to predict expected outcomes based on the severity of a given patient’s injury. The ability to quantify injury in this way makes accurate scoring systems excellent quality assurance tools.
For the acute care surgeon, extending organ injury severity grading into the realm of nontrauma emergency surgery is appealing and in some cases has been attempted. An example of this is the Hinchey classification of diverticular pericolonic abscesses. Similar to injury scoring, classifying the extent of the pathologic process allows quantification that facilitates quality improvement and research, and guides treatment.
Field Triage Scoring Systems
Triage can be broadly defined as identifying those patients who, if given immediate appropriate medical treatment, will likely survive their wounds. It endeavors to separate those who are minimally or fatally injured from those who will most benefit from timely care.1 Emergency medical system personnel usually make the first and often most critical triage decisions. For this reason, injury severity scoring systems that accurately and consistently quantify injury for triage purposes are extremely valuable. Field triage systems must categorize patients in such a way as to insure the most severely injured patients are taken to the most capable trauma facilities while ideally preventing such facilities from being overburdened with patients who have inconsequential injuries. The key components of field triage systems include injuries to the central nervous, cardiovascular, and respiratory systems.2
The Glasgow Coma Scale
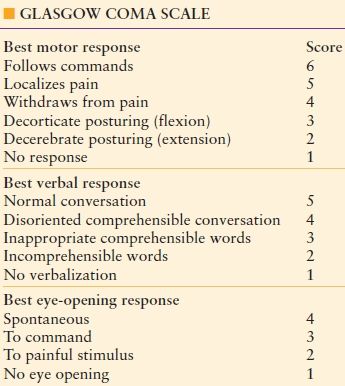
Among the first and most successful of the trauma grading systems was the Glasgow Coma Score (GCS). Developed by Teasdale and Jennett in 1974,3 this commonly used scale assesses the degree of head injury, and it has predictive value as to outcome. GCS includes three clinical evaluations of eye opening, verbal expression, and motor response. Each component is then assigned a numerical score (Table 63.1). The scale is graded with the best eye opening response receiving a maximum score of 4 points, the best verbal response receiving a maximum score of 5 points and the best motor response receiving a maximum score of 6 points. A lower score indicates worsening neurologic injury, and this allows for quantification of injury to mild, moderate, and severe. This has clinical implications that include indications for intubation, intracranial monitoring, and surgical decompression.4 The GSC was revised a single time in 1977 increasing the maximum score for motor response from 5 to 6, emphasizing the relative importance of the motor response in the overall evaluation in the patient’s neurologic exam.5 The relative ease of use and reproducibility of the GCS in the context of the overall contribution of neurologic injury to subsequent morbidity and mortality of trauma patients make it an important component of field triage systems.
TABLE 63.1
THE GCS IS A WEIGHTED SCORING SYSTEM FOR NEUROLOGIC INJURY WITH MOTOR RESPONSE THE MOST HEAVILY WEIGHTED COMPONENT
The Revised Trauma Score
The Revised Trauma Score (RTS) is a revision of the earlier Triage Index6 and subsequent Trauma score. The Trauma Score was developed by Howard Champion, William Sacco, Wayne Copes and others as both a quantitative injury scale with predictive value and as a simple and reproducible triage tool for EMS personnel for which it gained wide acceptance.7 The Trauma score assigned point values for respiratory rate (RR), respiratory effort, systolic blood pressure (SBP), capillary refill, and GCS. In revising the trauma score, the authors acknowledge respiratory effort and capillary refill were difficult to assess and some head injury patients were undertriaged. The RTS eliminated capillary refill and respiratory effort components, adopted commonly accepted intervals for GCS, adjusted values for SBP and RR, and validated the score with empirical data (see Table 63.2).
TABLE 63.2
THE TRIAGE-RTS IS AN ADDITIVE SCORE
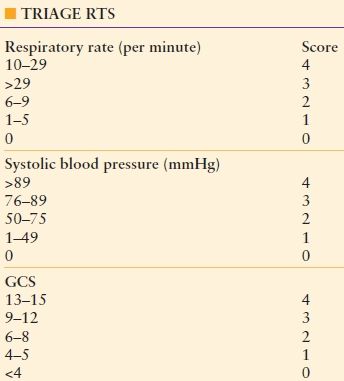
Any score ≤11 suggests the patient should be taken to a trauma center.
Two configurations of the score were created, one for triage (Triage RTS) and one to predict outcome (RTS).8 The field component (T-RTS) is strictly additive and can be quickly calculated in the field. The Triage-RTS is used in the prehospital setting and assigns a maximum of 4 points to the respiratory rate, systolic blood pressure, and the GCS. The maximum point value is 12. A T-RTS of ≤ 11 is a strong indicator that a patient should be transferred to a trauma center (Table 63.2).
The second iteration of the RTS is used for predicting outcome and comparing patient data sets. The RTS is defined as
RTS = 0.9368 GCS + 0.7326 SBP + 0.2908 RR
The RTS has a range from 0 to 7.841, is heavily weighted toward neurologic injury, and correlates well with the probability of survival. It is an important component of the trauma injury score methodology, to be discussed later in the text.8
Pediatric Trauma Score
The Pediatric Trauma score is similar to the RTS but designed for children. It has six components: weight, airway, systolic blood pressure, central nervous system, open wound, and skeletal injury. Each component is given a score of -1 to 2, and patients with a score <8 should be transferred to a pediatric trauma center.9
Center for Disease Control National Guidelines for Field Triage of Injured Patients
In 2009, the Center for Disease Control (CDC) issued Guidelines for the field triage of injured patients. The expert panel based the criteria on physiologic criteria, anatomical criteria, mechanism-of-injury criteria and special considerations to include age <5 or >55, pregnancy, burns, and comorbidities such as diabetes mellitus and coronary artery disease. Patients with a GCS < 14, systolic blood pressure <90 mmHg, or respiratory rate <10 or >29 or <20/min in an infant under 1 year of age are triaged to a trauma center. Similarly, patients with penetrating injuries to the head, neck, torso, and extremities proximal to the knee; flail chest; two or more proximal long bone fractures; crushed, degloved, or mangled extremity; amputation proximal to the wrist or ankle; pelvic fractures; open or depressed skull fractures; or paralysis should be taken to a trauma center. Finally, it is recommended that in patients older than 55, consideration for transport to a trauma center should be undertaken. The CDC’s recommendations include all of the elements of an effective injury scoring system to include physiologic, anatomical, and comorbid conditions.10
Anatomic Injury Scoring Systems
Abbreviated Injury Scale In 1969, a Joint Committee of the American Medical Association called the Society of Automotive Engineers and the Association for the Advancement of Automotive Medicine began to develop a scale to classify injuries and their severity. The first scale was published in the Journal of the American Medical Association in 1971.11 The AIS has been revised several times by the Association for Advancement of Automotive Medicine, including the most recent 2008 update.
The AIS is not a scoring system. It is rather an anatomically based scale that classifies injuries on a 6-point scale with a score of 1 representing a mild injury and 6 representing an almost always nonsurvivable injury (Table 63.3). The scale is based on consensus opinion and simply describes the organ injury. The AIS does not attempt to predict survivability of injuries, and there is not a linear correlation to the injuries classified and patient outcome. AIS has been revised to have comparability with the Organ Injury Scales of the American Association for the Surgery of Trauma.
TABLE 63.3
GENERAL CATEGORIES OF THE ABBREVIATED INJURY SCALE
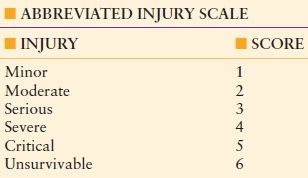
The use of the AIS scale can often be confusing. For example, for a given body region, a scale of 4 represents severe injury and a scale of 5 represents critical injury. To know the difference between a severe and critical injury for a given organ requires referencing the AIS manual. As an example, a grade 4 liver injury involves “parenchymal disruption of ≤75% hepatic lobe; or multiple lacerations >3 cm deep; or a ‘burst’ injury.” A grade 5 liver injury involves “parenchymal disruption of >75% of hepatic lobe or >3 Couinard’s segments within a single lobe or involving retrohepatic vena cava, or central hepatic veins.”12 The documentation of injury grade is sufficiently complicated to require training for coders who document scores.
The Injury Severity Score The injury severity score (ISS) was introduced in 1974 by Susan P. Baker and others. In their landmark paper, the authors pointed out the difficulty of comparing large numbers of patients with very similar injuries and instead proposed comparing patients who did not necessarily have similar injuries but instead had similar injury severity. In evaluating the AIS as a scoring system, they found that the AIS was nonlinear as mortality increased disproportionately with increasing severity. Further, the death rates for persons with two injuries of grade 4 and 3 (mortality 24%) did not have comparable mortality to patients with injuries of grade 5 and 2 (mortality 54%). They also recognized that the AIS pertained to individual injuries and state in their paper that most automotive crashes involve multiple injuries.13
Deducing that the simplest nonlinear equation is quadratic, the authors then determined to square the AIS grades for the most severe injury in each body region and then add the scores together. When adding the sums of the two highest squared AIS grades, death rates were found to be similar for comparable totals. The sum of the three highest squared AIS grades improved the correlation between the ISS and mortality. Adding the fourth squared AIS did not improve accuracy. The ISS was therefore defined as the “sum of the squares of the highest AIS grade in each of the three most severely injured areas.”13
The ISS divides the body into six anatomical regions including the head or neck, face, chest, abdomen/pelvis, extremities, and external and then assigns a score to each region based on the AIS scale. The three highest scores are then squared and added together resulting in the ISS. If a patient receives an ISS of 6 in any anatomical region, a score of 75 is assigned, and the patient is presumed to have nonsurvivable injury.
The ISS has been found to correlate well with mortality and revolutionized trauma research. The immediate impact of the ISS was to allow retrospective analysis of treatment quality and effectiveness as well as comparison between similarly injured patients treated at different hospitals and in different trauma systems.14,15 However, the ISS does have notable limitations.
The ISS only considers one injury in a body region when multiple serious injuries may exist which may result in the ISS underestimating injury in these cases. For example, a patient with a severe liver injury given an ISS score of 25 and a patient with the same liver injury and an inferior vena cava injury with an injury severity score of 16 would be given the same ISS of 25. The ISS is derived from the AIS scale, which was designed to categorize victims of motor vehicle crashes and therefore is primarily a measure of blunt trauma. Recent revisions have added penetrating injury, but the ISS may underestimate penetrating injury severity. The ISS places equal emphasis on injuries in all body regions. Because the score is not weighted, an injury to the head with an ISS score of 25 may have a different mortality compared to an extremity injury with a score of 25. The ISS is only an anatomic score as it does not consider physiologic derangement or patient comorbidities. The ISS is thought to be ordinal (well ordered) and monotonic (always increasing); however, this is not true. Kilgo and colleagues using 171,149 patients from the National Trauma Data Base demonstrated that the ISS is nonmonotonic, an example being that an ISS of 25 had a mortality of 43% while an ISS of 27 had a mortality of 14%. Further the ISS scale is from 1 to 75, but only 44 values exist, and several different combinations of injury result in the same score with disparate mortalities for the same value.16
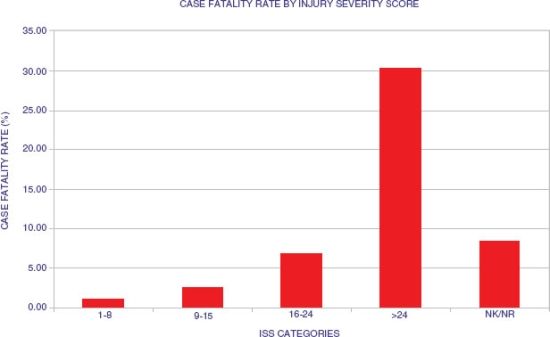
Despite substantial limitations, the ISS remains the most popular injury scoring system. The ISS is simple to understand and easy to calculate. Scores from 1 to 8 have a mortality of approximately 1% (minor injury), scores from 9 to 14 have a mortality of approximately 2% (moderate injury), scores from 16 to 24 have a mortality of approximately 7% (severe injury), and scores ≥25 have a mortality of >30% (very severe injury) (Fig. 63.1).
New Injury Severity Score Turner Osler, Susan Baker, and William Long introduced the New Injury Severity Score (NISS) in 1997. This score attempted to improve on the original ISS by using the three most severe injuries regardless of anatomical region. This modification eliminated one of the primary criticisms of the ISS, and ability of the NISS to predict mortality was found by the authors to be superior to that of the ISS. In their original paper, the authors reported that approximately 60% of patients had different NISS scores compared to ISS scores with the NISS being higher than the ISS in all cases. The authors reported data from two separate hospitals and using receiver operating characteristics found the ISS to have a 0.869 predictive value in one institution compared to 0.896 using NISS. In the second institution, ISS was found to have 0.896 predictive value compared to 0.907 using NISS. In both cases the improvement was found to be statistically significant.17 The NISS, however, like ISS is nonmonotonic, nonlinear, and not ordinal, and it has failed to replace ISS as the standard anatomical ISS.16
Anatomic Profile Score Wayne S. Copes, Howard R. Champion, and others identified three fundamental problems with the ISS. They felt the ISS underestimates in many cases the severity of injury because it is limited to the single worst injury in three body regions. Second, the ISS has multiple diverse injury combinations that result in similar ISS, but have clearly distinct survival differences, and third and importantly, the ISS gives the same importance or weight to the same AIS score in different body regions. Their example is that a laceration to the brain and stomach give an AIS score of 4, and an ISS of 16 would predict the same outcome.18
Their solution was to develop the anatomic profile (AP). The AP adjusts for severity in body regions by creating the modified components mA, mB, and mC. Each modified component includes all injuries in the given body region, and the regions are weighted differently based on the expected outcome in the body region. The mA component includes the head/brain and spinal cord, the mB component includes the thorax and neck injuries, and the mC component consists of all other injuries. AIS scores of 1 and 2 are not included. The score itself is derived by adding the squares of each AIS injury ≥3, adding the scores and then determining the square root of the total. A coefficient is then assigned to each component.
Although the authors showed that AP better discriminated survivors from nonsurvivors compared to ISS and was more sensitive than ISS, it has failed to replace the venerable ISS.
Scores Used to Predict Outcome
The Triss Methodology The TRISS method combines the components of the RTS with the ISS to generate a probability of survival for individual trauma patients. Additionally, TRISS adds a calculation for age and separate coefficients for blunt and penetrating mechanisms. The TRISS method is used to quantify the severity of injury of a patient population, calculates the probability of survival of patients for identification of cases for peer review, and compares the death or survival rates of different populations.19
The TRISS methodology is most commonly used to generate a probability of survival for a patient using the following equation:
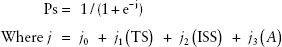
The b coefficients in the equation were derived using Walker-Duncan regression analysis of thousands of patients from the Major Trauma Outcome Study.20 A represents age with A = 1 for patients age 55 and older and A = 0 for patients 54 and younger. Given a 55-year-old male with a GCS of 10, a systolic blood pressure of 88 mmHg, and a respiratory rate of 22/min, the RTS is 6.171. Assuming a blunt head injury with an ISS of 25:
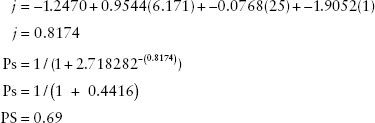
This patient, aged 55, with a blunt head injury has a probability of survival of 69%. The same patient with a penetrating injury would have a probability of survival of 70%. A 44-year-old with the same injury scores would have a probability of survival of 92% for a blunt injury and 88% for penetrating injury.
Once survival probabilities of a group of patients have been determined, they can be plotted against an S 50 isobar using the RTS on the vertical axis and ISS on the horizontal axis. Patients are thought to be unexpected deaths if they have a probability of survival of 50% or higher and die. Patients with a survival probability of <50% who survive are unexpected survivors. It has been suggested that patients who are unexpected deaths should undergo peer review. Using statistical analysis, survival probabilities can be used to compare subsets of patients to determine if survivors and deaths fall within expected parameters.21
Criticisms of the TRISS methodology are several. The MTOS database from which the coefficients were derived may be quite different than the population being evaluated. Care must be taken to assure a sufficient match among populations. The sensitivity of the S 50 isobar is also questioned. While a patient with a 52% survival probability who dies is categorized as an unexpected death, the patient had a 48% probability of dying. Therefore, care must be exercised when using the TRISS methodology for evaluating isolated patients.
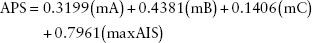
A Severity Characterization of Trauma The AP score is an attempt to replace the ISS with a weighted anatomical scoring system. Champion and colleagues with a severity characterization of trauma (ASCOT) upgrade TRISS using the AP score in place of the ISS. The equation for the ASCOT methodology is similar to TRISS.
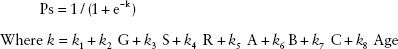
The k coefficients for ASCOT like TRISS are derived from regression analysis of patients from the Major Trauma Outcome Study. The constants G, S, and R represent the GCS, systolic blood pressure, and respiratory rate from the RTS, and the constants A, B, and C are obtained from the first three components of the APS score. The age component of ASCOT has five categories with a numeric scale of 0–4 with the assigned value increasing as age increases.22 ASCOT has not replaced TRISS. It is substantially more complex than TRISS, and the improvements it offers are not dramatic. A subsequent comparison of TRISS versus ASCOT found the two to be essentially equal in their predictive power.23
International Classification of Disease Injury Severity Score The International Classification of Disease Injury Severity Score (ICISS) instead of using AIS grades uses survival risk ratios derived from ICD-9 codes. Survival risk ratios (SRR) are derived for each ICD-9 code by determining the number of patients who survive the coded injury and dividing that number by the total number of patients with the injury. Once SRRs have been developed for a group of patients from a database, the ICISS score is determined by the formula

The ICISS is the product of all available SRRs for a given patient and is bounded by 0 and 1. An ICISS of 0.5 corresponds to a predicted survival of 50%.
Osler and colleagues introduced ICISS in 1996. In their original description, they developed SRRs for ICD-9 codes using 314,402 patients from the North Carolina database. Once the ratios were obtained, they compared ICISS to ISS using 3,142 trauma patients from the University of New Mexico. ICISS was found in their study to outperform ISS for both penetrating and blunt trauma.24 They also combined RTS and age to ICISS to create a survival probability model, which they then compared to the TRISS methodology. They found the ICISS model outperformed TRISS in determining probability of survival for both penetrating and blunt injury.22
The appeal of a scoring system that used ICD-9–based codes is that smaller trauma centers that do not have the resources to calculate AIS and ISS scores can use the universal ICD-9 codes to predict mortality and develop probability of survival models. ICISS is derived empirically and is not determined by consensus. When large databases are used to derive SRRs, the predictive value of a specific injury is powerful. Because all injuries to a particular patient are used to calculate ICISS, the significance of lesser injuries is overestimated. This is mitigated to some degree. Indeed, Osler and his coauthors identified approximately 100 injuries that were associated with most fatalities. Chief among these were head, burn, and thoracic and abdominal vascular injuries.22 This finding lends credibility to scoring systems that use only the worst injury like MAXAIS which in one study outperformed multi-injury scoring systems.25
Trauma scoring systems are useful as they allow the quantification of injury and the probability of survival based on injury scale score. They have been used to create field triage systems and allow comparison of similarly injured patients treated in different hospital and trauma systems. They are also valuable as a screening tool for quality assurance programs. They are not, however, effective for screening individual patients. A patient with a predicted survival of 55% also has 45% mortality. The variables that determine such a patient’s outcome are complex and include the patient’s age, comorbidities, prehospital care, and the capabilities of the hospital staff and surgeons, to name a few. The closer the probability of survival to the Survival 50 Isobar, the less able any scoring method is to discriminate outcome. For the purpose of quality improvement, scoring systems are best used to evaluate trauma populations and system outcomes.
SCORING SYSTEMS FOR EMERGENCY GENERAL SURGERY
Introduction and Background
Scoring systems for emergency general surgery must describe the severity of each surgical disease in a way that relates to treatment, complications, and outcomes. The accuracy of a scoring system can be evaluated using statistical measures such as sensitivity, specificity, positive predictive value, and the negative predictive value. The scoring systems in trauma describe the anatomic and physiologic parameters present in the patient. Cancer scoring systems describe the primary tumor, the nodal status, and metastasis. These allow for standardization of patients and comparison of treatment and outcomes. The scoring systems for emergency general surgery are not as well developed, making it difficult to construct research studies and reach firm conclusions about many of these conditions.
Emergency general surgical conditions can be broadly classified as obstruction, perforation, ischemia, infection, or bleeding affecting an organ system or specific anatomical site. Examples are found in the respiratory, cardiovascular, gastrointestinal, and genitourinary systems. These conditions include airway obstruction, pneumothorax, vascular thrombus and embolus, small bowel obstruction, cholecystitis, diverticulitis, duodenal ulcer disease, pancreatitis, and urinary retention, to name a few. There is an opportunity to develop scoring systems for many of these conditions (Table 63.4).
TABLE 63.4
CLASSIFICATION OF EMERGENCY GENERAL SURGERY CONDITIONS
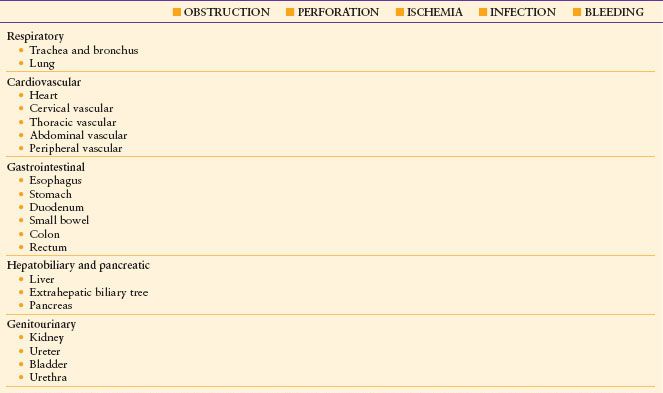
Adapted from the AAST Organ Injury Scaling. Scoring systems for emergency general surgery conditions exist for some of the common problems that could be included in this array. There is little uniformity among them as you would find in trauma or cancer scoring systems.
Related posts:


Stay updated, free articles. Join our Telegram channel

Full access? Get Clinical Tree


