I. MONITORING
A. Respiration is the transport of oxygen from the environment to the cells of the body and the transport of carbon dioxide from those cells to the environment. Consequently, in its broadest sense, respiratory monitoring refers to the assessment of the processes involved with the exchange of respiratory gases between the environment and the subcellular pathways in which those gases are utilized and produced. Respiratory monitoring is performed to assure patient safety, maintain homeostasis, and titrate treatment.
B. The main components of respiratory physiology are gas exchange, respiratory mechanics, control of breathing, and pulmonary circulation. This chapter will address the monitoring of gas exchange and respiratory mechanics, and comment on control of breathing. Monitoring of the circulation is addressed in Chapter 1.
II. MONITORING GAS EXCHANGE
A. Basic Concepts:
1. Hypoxia is the condition of deprived oxygen supply. It can apply to a region of the body (tissue hypoxia) or the whole body (generalized hypoxia). The complete deprivation of oxygen supply is denominated anoxia. These concepts are not equivalent to those of hypoxemia, which refers to the reduction of oxygen, i.e., low partial pressure of oxygen, in arterial blood. Reasons for hypoxia include the following:
a. Hypoxemia: low partial pressure of O2 in the blood
b. Ischemia: a deficiency in oxygen supply due to insufficient blood flow
c. Hystotoxic: inability of cells to use oxygen despite appropriate delivery (i.e., cyanide toxicity)
d. Anemia
e. Inhibition of the function of hemoglobin such as in carbon monoxide poisoning.
f. As can be seen, in general, it is easier to monitor hypoxemia than hypoxia.
2. Arterial blood gases and pH
a. Arterial blood gas analysis is often considered the standard for assessment of pulmonary gas exchange.
3. Arterial partial pressure of oxygen (PaO2)
a. The normal PaO2 is 90 to 100 mmHg breathing room air at sea level.
4. Decreased Pao2 (hypoxemia) occurs with pulmonary diseases or conditions resulting in increased shunt ( S/
S/ T), ventilation–perfusion (
 /
/ ) mismatch, hypoventilation, and diffusion defect. A low mixed venous PO2 (e.g., decreased cardiac output) will magnify the effect of shunt on PaO2. The PaO2 is also decreased with decreased inspired oxygen (e.g., at high altitude).
5. Increased Pao2 (hyperoxemia) may occur when breathing supplemental oxygen. The PaO2 also increases with hyperventilation.
6. Effect of FIO2 (fraction of inspired oxygen)
a. The PaO2 should always be interpreted in relation to the level of supplemental oxygen. For example, a PaO2 of 95 mmHg breathing 100% oxygen is quite different from a PaO2 of 95 mmHg breathing air (21% oxygen).
7. Arterial partial pressure of CO2 (PaCO2)
a. The PaCO2 reflects the balance between carbon dioxide production ( CO2) and alveolar ventilation (
 A):
A):
PaCO2 = K ×  CO2 /
CO2 /  A
A
where K is a constant.
8. Alveolar ventilation: the fraction of the minute ventilation that participates in gas exchange. Minute ventilation = tidal volume (VT) × respiratory rate.
a. PaCO2 varies directly with carbon dioxide production and inversely with alveolar ventilation.
b. PaCO2 is determined by alveolar ventilation, not minute ventilation. The difference between them is the dead-space ventilation, which is ventilation that does not participate in gas exchange. Dead-space ventilation is made up of ventilation of the portions of the airway that do not participate in gas exchange (anatomical dead space) and those alveolar regions that do not exchange gas optimally because of absence of (or insufficient) blood flow in relation to the corresponding ventilation (physiological dead space), e.g., embolized regions after a pulmonary embolism.
c. Minute ventilation affects PaCO2 only to the extent that it affects the alveolar ventilation.
d. Note that the Pao2 is predominantly related to  /
/ mismatch and shunt, while Paco2 is predominantly related to alveolar ventilation.
e. The physiological dead space can be estimated using the Bohr equation:
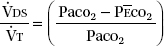
where P CO2 is the mixed expired CO2 partial pressure, as measured in exhaled air collected in a mixing bag or chamber, or computed from a volumetric capnogram. Very large
  DS/
DS/ T has been recently associated with poor prognosis in acute respiratory distress syndrome (ARDS).
9. Arterial pH is determined by bicarbonate (HCO3−) concentration and PaCO2, as predicted by the Henderson–Hasselbalch equation:

10. Blood gas errors
a. Care must be taken to avoid sample contamination with air, as the PO2 and PCO2 of room air at sea level are approximately 155 and 0 mmHg, respectively. Care should also be taken to avoid contamination of the sample with saline or venous blood.
b. A specimen stored in a plastic syringe at room temperature should be analyzed within 30 minutes.
c. Leukocyte larceny (spurious hypoxemia, pseudohypoxemia). The PaO2 in samples drawn from subjects with very high leukocyte counts can decrease rapidly. Immediate chilling and analysis are necessary.
11. Blood gases and pH
a. Blood gases and pH are measured at 37°C. Once the results of blood gases are available, they are often used to adjust the patient’s acid–base status through ventilation or medications. Two strategies for management exist. α-stat management is the acid–base adjustment method in which blood gas measurements (pH, PaCO2) obtained at 37°C from the blood gas machine are directly used to reach the targets (PaCO2 = 40 mmHg, pH = 7.4). Using empiric equations, the blood gas analyzer can adjust the measured values to the patient’s body temperature. pH-stat management is an alternative method in which measurements obtained at 37°C are corrected to the patient’s actual body temperature before use to achieve those same numerical targets. It may be necessary to enquire with your laboratory to determine whether the laboratory is reporting temperature-compensated values (that may facilitate the use of the pH-stat strategy).
b. Most intensive care units (ICUs) utilize the α-stat strategy. The choice of ventilation strategy is becoming increasingly important with the use of induced hypothermia as a therapeutic tool. Because of increased gas solubility during hypothermia, the α-stat strategy results in relative hyperventilation. The pH-stat approach results in increased cerebral blood flow. There are different conditions in which each of these methods can be more or less advantageous.
B. Venous Blood Gases reflect PCO2 and PO2 at the tissue level.
1. There is a large difference between Pao2 and venous Po2 (Pvo2). PvO2 is affected by oxygen delivery and oxygen consumption, whereas PaO2 is affected by lung function. Thus, PvO2 should not be used as a surrogate for PaO2.
2. Normally, venous pH is lower than arterial pH, and venous Pco2 (Pvco2) is higher than PaCO2. However, the difference between arterial and venous pH and PCO2 is increased by hemodynamic instability. During cardiac arrest, for example, it has been shown that PvCO2 can be very high even when PaCO2 is low, a consequence of low cardiac output for a similar CO2 production.
3. When venous blood gases are used to assess acid–base balance, mixed venous or central venous samples are preferable to peripheral venous samples. Mixed venous blood is the blood present in the pulmonary artery, a result of the mix of blood from the superior and inferior vena cavae, and coronary sinus.
4. The partial pressure of mixed venous oxygen (P O2) provides an indication of global tissue oxygen extraction. Normal mixed venous P
 O2 is 35 to 45 mmHg, and normal mixed venous oxygen saturation (S
 O2) is 65% to 75%. Factors affecting mixed venous oxygen level can be illustrated by the following equation, which is a rearrangement of the Fick equation:
S O2 = SaO2 − VO2/CO × Hb × 1.34
where S O2 is the mixed venous oxygen saturation; SaO2, arterial oxygen saturation; VO2, oxygen uptake; CO, cardiac output; Hb, hemoglobin.
S O2 is decreased if:
a. Oxygen consumption is increased in the absence of increased delivery, such as in hyperthermia or pain.
b. Cardiac output is decreased, such as in hypovolemia or shock.
c. The patient is anemic.
d. Oxygen saturation is decreased.
S O2 is elevated under conditions of increased oxygen delivery such as increased inspired oxygen concentration or conditions of decreased oxygen utilization, such as hypothermia and sepsis.
C. CO-oximetry
1. Spectrophotometric analysis of arterial blood is used to measure levels of oxyhemoglobin (oxygen saturation of hemoglobin), carboxyhemoglobin (carbon monoxide saturation of hemoglobin), and methemoglobin (amount of hemoglobin in the oxidized ferric form rather than the reduced ferrous form).
D. Oxyhemoglobin (HbO2) measured by CO-oximetry is the gold standard for the determination of oxygen saturation. It is superior to other means of determining oxygen saturation, such as that calculated empirically by a blood gas analyzer or that measured by pulse oximetry. Normal HbO2 is approximately 97%.
E. Carboxyhemoglobin (HbCO) levels should be measured whenever carbon monoxide inhalation is suspected. Endogenous HbCO levels are 1% to 2% and can be elevated in cigarette smokers and in those living in polluted environments. Because HbCO does not transport oxygen, the HbO2 is effectively reduced by the HbCO level.
F. Methemoglobin
1. The iron in the hemoglobin molecule can be oxidized to the ferric form in the presence of a number of oxidizing agents, the most notable being nitrates. Because methemoglobin (Hbmet) does not transport oxygen, the HbO2 is effectively reduced by the Hbmet level.
G. Point-of-care Blood Gas Analyzers are available to measure blood gases, pH, electrolytes, glucose, lactate, urea nitrogen, hematocrit, and clotting studies (activated clotting time [ACT], prothrombin time [PT], and partial thromboplastin time [PTT]) at the patient’s bedside.
1. Advantages: Point-of-care analyzers are small and portable (some are handheld), they use very small blood volumes (several drops), and they provide rapid reporting of results (a few minutes). They are relatively easy to use (e.g., self-calibrating) and typically incorporate a disposable cartridge that contains the appropriate biosensors.
2. Disadvantages: The cost/benefit of these devices need to be assessed on an individual basis. Accuracy and precision are variable in different systems and for different variables. Furthermore, appropriate quality control is necessary for compliance with the Clinical Laboratory Improvement Amendments or Joint Commission requirements.
H. Pulse Oximetry
1. Principles of operation
a. The commonly used pulse oximeter emits two wavelengths of light (e.g., infrared at 940 and red at 660 nm) from light-emitting diodes through a pulsating vascular bed to a photodetector. The ratio of absorption of red and infrared lights is used to determine the fraction of oxygenated hemoglobin. A variety of probes are available in disposable or reusable designs and include digital probes (finger or toe), ear probes, and nasal probes.
2. Accuracy
a. Pulse oximeters use empiric calibration curves developed from studies of healthy volunteers. They are typically accurate within ±2% for SpO2 readings as low as 70%. Thus their accuracy may be reduced in the clinical setting (see Limitations later). As illustrated by the oxyhemoglobin dissociation curve (Fig. 2.1), if the pulse oximeter displays an oxygen saturation (SpO2) of 95%, the true saturation could be as low as 93% or as high as 97%. This range of SpO2 translates to a PaO2 range from as low as about 60 mmHg to greater than 150 mmHg.
3. Multiple-wavelength pulse oximetry
a. Multiple-wavelength pulse oximeters measure and report the concentrations of HbCO, Hbmet and total hemoglobin in addition to SpO2.
4. Limitations of pulse oximetry should be recognized and understood by everyone who uses pulse oximetry data.
a. Saturation versus Po2. Because of the shape of the oxyhemoglobin dissociation curve, pulse oximetry is a poor indicator of hyperoxemia. It is also an insensitive indicator of hypoventilation. If the patient is breathing supplemental oxygen, significant hypoventilation can occur without HbO2 desaturation.
b. Ventilation versus oxygenation. Pulse oximetry provides little, if any, clinical information related to PaCO2 and acid–base balance.
c. Differences between devices and probes. Calibration curves vary from manufacturer to manufacturer. The output of the light-emitting diodes of pulse oximeters varies from probe to probe.
d. The penumbra effect occurs when the pulse oximeter probe does not fit correctly and light is shunted from the light-emitting diodes directly to the photodetector. It leads to an SpO2 reading that is erroneously lower than the actual value.
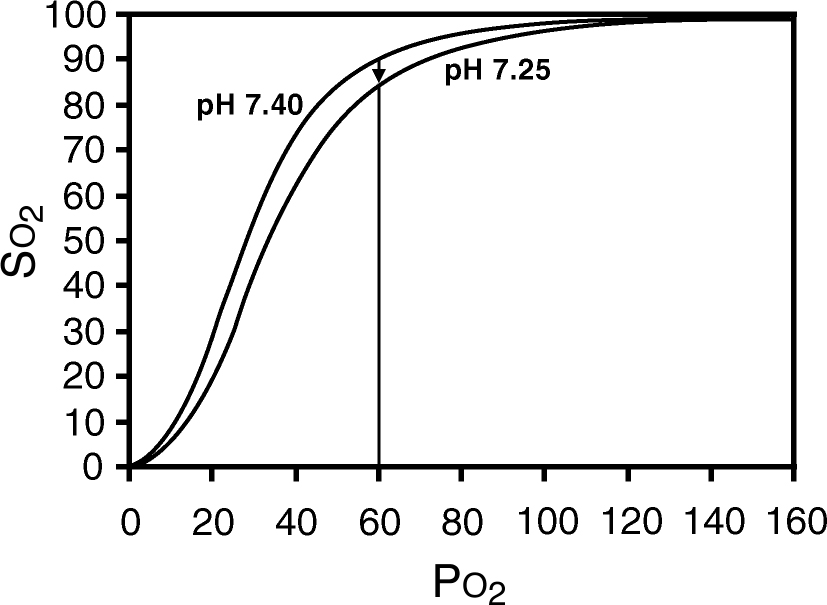
FIGURE 2.1 Oxyhemoglobin dissociation curve. Note that small changes in oxygen saturation relate to large changes in partial pressure of oxygen (PO2) when the saturation is greater than 90%. Also note that the saturation can change without a change in PO2 if there is a shift of the oxyhemoglobin dissociation curve.
Related posts:


Stay updated, free articles. Join our Telegram channel

Full access? Get Clinical Tree


