for Calculated Values*
PAOP
PAP
CO
SvO2#
RVEDP
CI
PVR
SVR
O2 delivery#
LVEDP
CI, Cardiac index; CO, cardiac output; CVP, central venous pressure; LVEDP, left ventricular end-diastolic pressure; O2, oxygen; PAOP, pulmonary artery occlusion pressure; PAP, pulmonary artery pressure; PVR, pulmonary vascular resistance; RAP, right atrial pressure; SV, stroke volume; SVO2, mixed venous oxygen saturation in the pulmonary artery; SVR, systemic vascular resistance.
* See Box 5-2 and Table 5-4 for calculation of values using data obtained from a pulmonary artery catheter
* See Box 5-3 for calculation of the cardiac index
# See Chapter 6 for calculations related to venous oxygen saturation and oxygen delivery
This chapter will provide a historical overview of PACs; physiologic review, including cardiac function, indications for use, insertion procedure, measurement methods and waveform interpretation.
Historical Milestones
The first human heart catheterization was performed in 1929 by Warner Forssmann, a German physician who inserted a catheter into the right atrium of his own heart.1,2 In 1941, André Frédéric Cournand and Hilmert Ranges performed eight heart catheterizations in four patients and measured cardiac output using the Fick method. The catheters were left in place for several days.2 In 1956 Cournand, Forssmann, and Dickinson W. Richards were awarded the Nobel Prize in Physiology and Medicine for their work on heart catheterization and intracardiac catheter development.
The PAC with a balloon flotation device and temperature measurement for thermodilution cardiac output was introduced in 1970 by William Ganz and HJC Swan.2,3 These catheters have since been developed to not only measure right atrial pressure (RAP), pulmonary artery pressure PAP, pulmonary artery occlusion pressure (PAOP) also known as the ‘wedge’ pressure but also measure cardiac output, and some catheters measure venous oxygen saturation and provide intracardiac pacing. Table 5-1 provides a summary of historical milestones in the development of diagnostic right heart catheterization.
Table 5-1
Pulmonary Artery Catheter Historical Milestones
| Date | Pulmonary Artery Catheter | |
| 1844 | Claude Bernard | Physiologist credited with inventing the term cardiac catheterization. Inserted a glass tube into the internal jugular vein to reach the right ventricle, and into the left carotid artery to reach the left ventricle in a horse. |
| 1870 | Adolf Fick | Published the formula for calculating cardiac output |
| 1929 | Warner Forssmann | Performed a right heart catheterization on himself by inserting a ureteral catheter into his right atrium and taking a chest radiograph as proof. |
| 1941 | Cournand and Ranges | Described right atrial catheterization and calculation of cardiac output in 4 patients |
| 1945 | Cournand et al. | Right heart catheterization (right atrium or ventricle) with calculation of Fick Cardiac Output in 260 catheterizations published in the Journal of Clinical Investigation |
| 1949 | HK Hellems et al. | Right heart catheterization with a venous catheter advanced into a pulmonary artery capillary in 13 patients, both wedge pressures and waveforms were obtained, published in the Journal of Applied Physiology. |
| 1956 | Cournand, Forssmann and Richards | Nobel prize awarded for advancements in heart catheterization |
| 1970 | HJC Swan and William Ganz | Right heart catheterization with the “Swan-Ganz” pulmonary artery catheter (PAC) in 70 patients. Case series published in The New England Journal of Medicine. The “Swan-Ganz” PAC was novel because it could be inserted at the bedside using waveform analysis and did not require fluoroscopy in the cardiac catheterization laboratory |
Although pulmonary artery catheters are used to guide various therapies, their use has not come without controversy. In the 1980s, several early observational studies reported an increase in mortality in patients with PACs, although it was hypothesized that these patients were often the most critically ill and had a poor prognosis.4,5 Following the observational studies, several randomized controlled trials (RCTs) have been completed.6–8 Many report little evidence of efficacy and possible complications and costs.5–8 More recent reviews of these studies showed no significant changes in morbidity or mortality and possible increase in complications and costs.9,10 A review by Koo et al. (2011) concluded that there was a lack of significant evidence to support the use of PACs in patients with acute coronary syndrome, high-risk noncardiac surgery, congestive heart failure, shock, acute respiratory distress syndrome (ARDS), and critical illness. In addition, Koo reported a decline in PAC use by greater than 50% between 2002 and 2006.11 Criticisms of these studies cite poor patient selection, misinterpretation of hemodynamic data, inappropriate therapy in response to the data obtained, and complications occurring because of less experienced clinicians.1
In 2013, the Cochrane Collaboration published a review on 13 randomized controlled trials that evaluated the use of the PAC.12 Nine of these studies had adequate randomization and consequently a decreased risk for bias. In all randomized controlled trials combined, 5686 patients were included. There was no significant difference in overall mortality rate between the PAC group and the central venous catheter (CVC) group. Also, no significant difference was observed in hospital length of stay in the 9 randomized controlled trials that reported hospital length of stay; nor was a significant difference seen in critical care unit length of stay in the 11 randomized controlled trials that reported critical care unit length of stay. Of the 13 studies, 4 of the trials based in the United States reported an increased cost in the PAC group versus the CVC group. However, because of lack of data, only 2 of the trials were statistically analyzed, and no significant difference existed in overall hospital cost.
To date, no randomized controlled trial has conclusively proven that any form of monitoring will improve outcomes.2 Ultimately, the decision to insert a PAC should be based on clinical judgment, preferably by an experienced operator who can accurately interpret data and guide treatments using the PAC as a diagnostic tool as one component of a comprehensive clinical assessment.
Key Physiologic Concepts
Cardiac Function
Cardiac output or the volume of blood pumped by the heart, delivers oxygen and nutrients to the body to meet metabolic demands. As physiologic demands increase, cardiac output must also increase. Cardiac output is determined by two factors: heart rate and stroke volume. Heart rate multiplied by stroke volume produces cardiac output, expressed in liters per minute (L/min) (see Chapter 1, Figure 1-7).
Heart rate is regulated by both the parasympathetic and sympathetic nervous systems. As metabolic demands increase, heart rate should also increase to provide adequate cardiac output. Careful consideration should be paid to this rising heart rate, as excessively rapid heart rates are associated with decreased diastolic filling time, which contributes to cardiac ischemia, decreased contractility, and reduced cardiac output.
Stroke volume is the amount of blood pumped from the ventricle with each cardiac contraction, usually measured in milliliters (mL). It is calculated in the cardiac catheterization laboratory by subtracting the end-systolic volume from the end-diastolic volume within the ventricle (see Chapter 1, Figure 1-8). Stroke volume is determined by three factors: preload, afterload, and contractility. When using the PAC it is calculated by dividing the cardiac output by the heart rate.
Preload is a measure of force, but conceptually, it relates to the end-diastolic volume of the ventricle. The stretch of the cardiac muscle fibers at the end of diastole is directly related to ventricular compliance. For example, a heart with a thick ventricular wall and decreased compliance will require increased preload, or volume, compared with a heart of normal size with normal compliance. Decreased preload in an injured heart greatly decreases stroke volume, ultimately decreasing cardiac output. Measurement of pressure in the right atrium (RAP) is used as a proxy for preload volume in the right heart, and PAOP is used to estimate preload volume in the left heart.
Afterload is the tension against which the ventricular muscle fibers must eject during systole. Afterload is affected by ventricular size, ventricular wall thickness, and blood pressure. A quantitative assessment of afterload can be calculated using hemodynamic pressure and flow data obtained from the PAC. The calculations for pulmonary vascular resistance (PVR), and systemic vascular resistance (SVR) are listed in Box 5-2.
Box 5-2
Equations for Calculated Values Obtained via the Pulmonary Artery Catheter
PVR=meanPA−meanPAOPCO×80

SVR=MAP−CVPCO×80

CI, Cardiac index; CO, cardiac output; HR, heart rate; MAP, mean arterial pressure; mean PA, pulmonary artery mean pressure; PAOP, pulmonary artery occlusion pressure; PVR, pulmonary vascular resistance; SV, stroke volume; SVI, stroke volume index; SVR, systemic vascular resistance.
PVR represents the afterload on the right ventricle. When pressures in the pulmonary vasculature rise, as is seen with volume overload or left heart failure, PVR increases, which results in an increased afterload for the right ventricle. Any increase in PVR increases the workload of the right ventricle.
SVR represents the afterload on the left ventricle. Increased afterload may be seen with conditions that cause vasoconstriction, for example, systemic hypertension or hypothermia induced vasoconstriction. Afterload reduction can be accomplished with peripheral vasodilators such as nitroprusside or nitroglycerin. Decreased afterload is seen in conditions that cause vasodilation, for example, hyperthermia and sepsis-induced vasodilation. Afterload or SVR may be increased by using vasopressors such as phenylephrine or norepinephrine. Although increasing SVR may improve blood pressure initially, the increased afterload may ultimately decrease cardiac output if there is a fall in the ejected stoke volume in a poorly contractile heart. The physiologic effects of vasopressors, vasodilators, and inotrope medications are discussed in detail in Chapter 9.
Contractility is the ability of the heart muscle to forcibly contract and, thus, to eject blood. Independent of preload and afterload, many forces may affect contractility. Sympathetic activity and circulating catecholamines may increase contractility. In addition, various medication infusions such as epinephrine, dobutamine, and milrinone are used to improve contractility. Contractility may decrease with acidosis, electrolyte abnormalities, hypoxia, ischemia, or medications that slow the heart rate such as beta-blockers. Sepsis may decrease cardiac output and contractility because of the effects of circulating cytokines. Myocardial infarction also decreases contractility due to lack of myocardial blood flow and poor oxygenation to the area of damaged heart muscle.
Clinical Procedures and Technical Considerations
Indications
The PAC is used to assess volume status, for regulating fluid management, monitoring cardiac output, and titration of vasoactive and inotropic medications. Pulmonary artery catheterization is necessary for the diagnosis of pulmonary hypertension. These catheters are often used in patients undergoing major cardiac or vascular surgery and refractory shock states. The decision to use a PAC should be based on a clinical need. It is important to understand that the catheter is a diagnostic tool and not a therapeutic intervention.
In a 2012 review on the role of the PAC, Jean-Louis Vincent suggested the following indications for use in critically ill patients:
For patients with acute heart failure, the American College of Cardiology (ACC) and the American Heart Association (AHA) have published guidelines for PAC use.13 See Table 5-2.
Table 5-2
Recommendations for Invasive Hemodynamic Monitoring
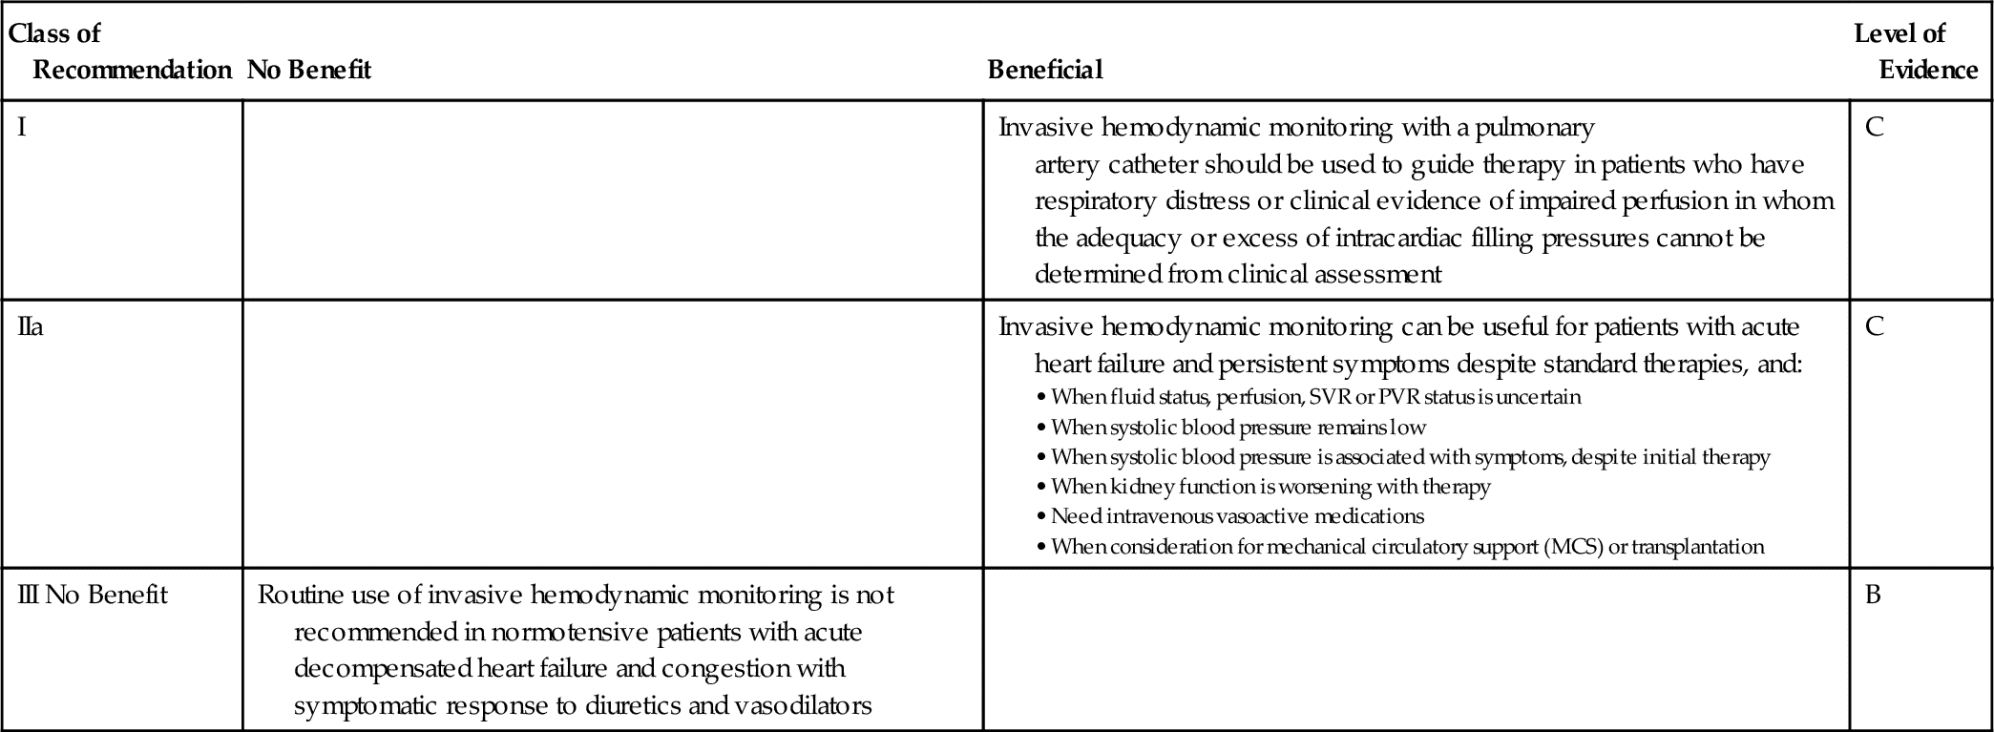
Data from Yancy CW, Jessup M, Bozkurt B. et al.: ACCF/AHA 2013 Guideline for the management of heart failure: A report of the American College of Cardiology Foundation /American Heart Association Task Force on Practice Guidelines. Circulation, 128:e240-e327, 2013.
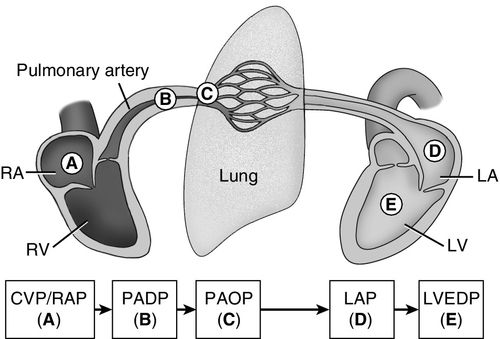
A major benefit of using a PAC is its ability to guide therapy when the patient’s clinical trajectory does not follow an expected pattern, as described in the case study at the end of this chapter. The PAC monitors intracardiac pressures from the right heart, the pulmonary vasculature, and end-diastolic pressures in the left heart (Figure 5-1). The PAC also provides real-time data on volume status, cardiac output, and venous oxygen saturation. In addition, PVR and SVR may be calculated, along with other calculated data to give estimates of left-sided heart function (see Box 5-2). The immediate availability of information is useful in providing ongoing assessment of a patient’s clinical picture to assist a clinician with therapeutic interventions.
Equipment
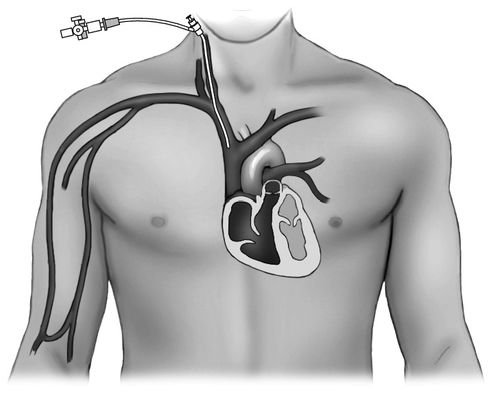
Introducer
Typically, an 8-French (Fr) introducer catheter is used for insertion of a PAC (Figure 5-2). This catheter has a port with a one-way valve through which the PAC can be inserted (Figure 5-3). In addition, the introducer usually has a side port that can be used to infuse medications or large volumes of fluid.
Pulmonary Artery Catheter
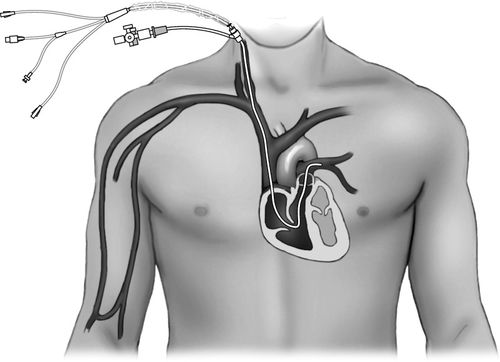
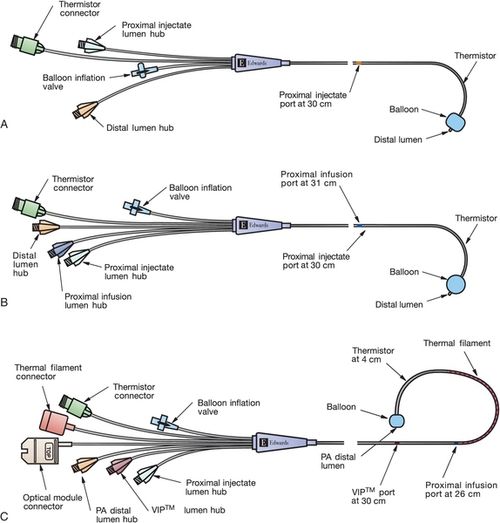
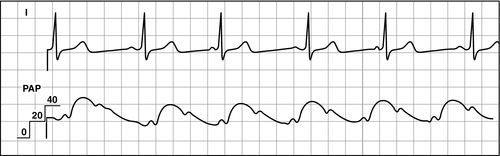
Most current PACs have multiple lumens. The different lumens are identified by a terminal “port” with a distinctive color or shape for easy identification. The basic PAC includes a proximal right atrial lumen, a distal pulmonary artery lumen, a thermistor, and an inflation balloon (Figure 5-4, A). The proximal injectate lumen rests in the right atrium and measures the RAP or central venous pressure (CVP). This lumen is also used to obtain a bolus thermodilution cardiac output. The distal lumen rests in the pulmonary artery and is used for measuring PAP and PAOP. Some PAC catheters have an additional right atrial proximal infusion lumen for infusion of medications (Figure 5-4, B). Some multilumen PACs have a specialized electrical wire that connects to a filament on the catheter to obtain continuous cardiac output waveform on the bedside monitor (Figure 5-4, C). Some PACs have yet another lumen that allows for transvenous pacing in patients who require invasive hemodynamic monitoring and temporary pacing. Other PACs provide continuous measurement of SVO2 (see Chapter 7).
Transducer
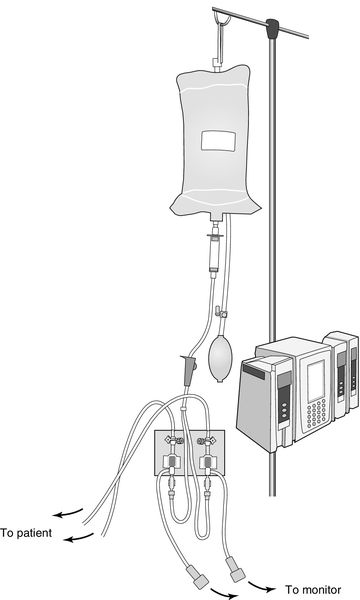
Two transducer setups are needed to measure the waveforms of both the right atrium and the pulmonary artery from the catheter. The transducers are connected separately to the catheter proximal port (RA) and distal port (PA) using saline-flushed, noncompliant tubing. The tubing maintains patency via a 500 mL bag of normal saline, enclosed by a pressure bag inflated to 250 to 300 millimeters of mercury (mm Hg). Approximately 3 mL per hour of saline is delivered to the patient. The tubing is connected to the transducer and an electrical cable connects the transducer to the monitor to display the hemodynamic waveforms and pressure measurements (Figure 5-5).
Insertion of a Pulmonary Artery Catheter
Intravenous access is obtained by placement of an introducer into a central vein. The PAC is inserted through the introducer. To promote ease of insertion, the preferred site is the right internal jugular (IJ) vein, but other options include the left IJ vein the subclavian vein or the femoral vein. The PAC comes packaged with a natural preformed curve that facilitates placement of the catheter. Given the curve of the catheter, the right IJ vein provides the easiest and most direct access to the right heart. The second best access point is the left subclavian vein. Femoral vein sites are the most challenging and may require placement via fluoroscopy. Black marks on the catheter, at 10 centimeter (cm) intervals, assist with placement.
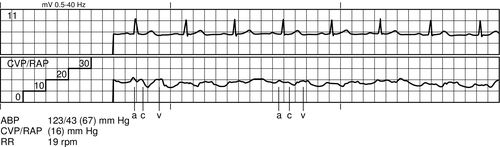
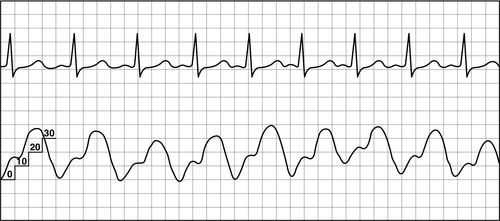
Once the access for the introducer has been obtained, the PAC is inserted under continued sterile conditions. The balloon at the catheter tip must be tested first by using the syringe provided in the packaging. This syringe has a maximum volume of 1.5 mL and is the only syringe that should be used on the catheter to prevent over inflation of the balloon. The balloon is first inflated and then deflated to ensure integrity. The proximal (RA) and distal (PA) ports are then connected to a transducer setup, and the lines are thoroughly flushed with saline. Finally, if an extra port is available, the line is flushed with saline and a screw cap should be placed on the extra port to exclude all air. A sleeve for the PA catheter must be placed prior to insertion. Once the catheter is inserted into the introducer, the tip is advanced to the right atrium (approximately 15 cm) and a right atrial waveform should be visualized on the monitor (Figure 5-6). At this point, the balloon is inflated. The catheter is then carefully advanced to the right ventricle (see Figure 5-7) and then into the pulmonary artery (see Figure 5-8). The catheter is advanced, or “floated,” using the balloon on the catheter tip, until the tip of the catheter wedges into a small pulmonary blood vessel (see Figure 5-9). Once the catheter is in the wedge position, the PAOP pressure should be noted, and then the air in the balloon is released. Once the balloon is deflated, the PAOP waveform should return back to the PA waveform, with corresponding PA digital pressure values (see Figure 5-7) on the monitor. At this time, the black mark at the insertion site of the PAC should be documented (in cm) to note the distance of the catheter from the insertion site into the heart. If any difficulty arises during the process of advancing the catheter, the balloon should be deflated, and the catheter withdrawn back into the RA to re-attempt insertion. During insertion, the bedside nurse assists the physician or the advanced practice provider with the setup and flushing of the catheter. The nurse will also assist in monitoring the catheter waveforms and electrocardiography (ECG) reading during insertion. Portable anteroposterior chest radiography is performed to confirm placement (Figure 5-10). Once the catheter is correctly placed, waveform analysis may begin.
Related posts:
 Hemodynamics of Sepsis
 Hemodynamic Management of Heart Failure and Cardiogenic Shock
 Hemodynamics of Mechanical Ventilation and Acute Respiratory Distress Syndrome
 Ultrasonography-Based Hemodynamic Monitoring
 Hemodynamic and Intracranial Dynamic Monitoring in Neurocritical Care
 Oxygenation and Acid–Base Balance Monitoring
Stay updated, free articles. Join our Telegram channel

Full access? Get Clinical Tree


