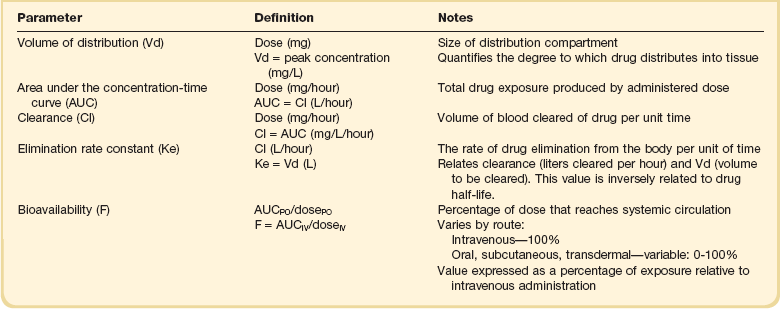
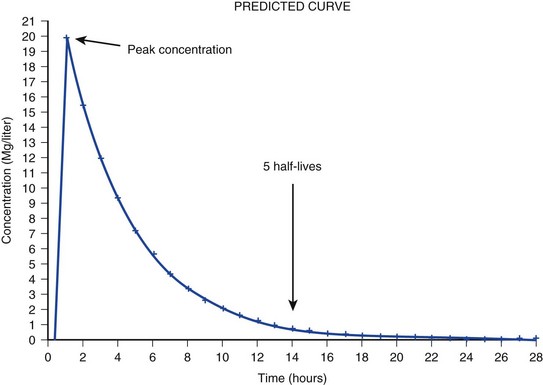
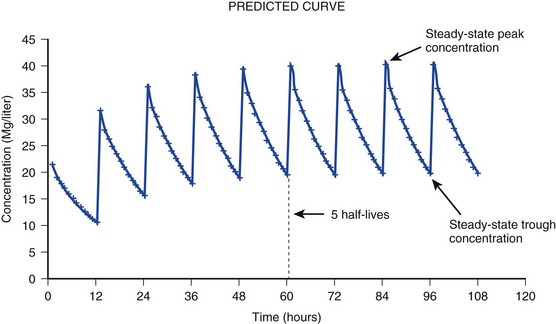
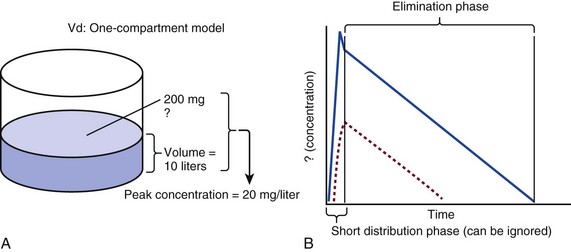
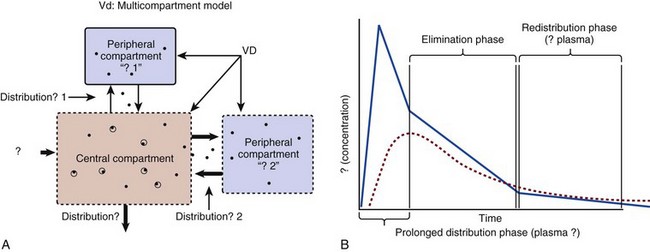
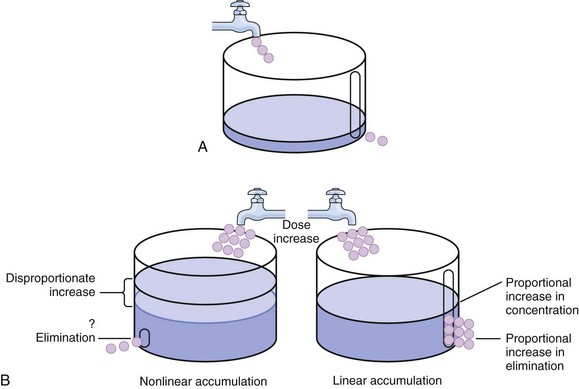
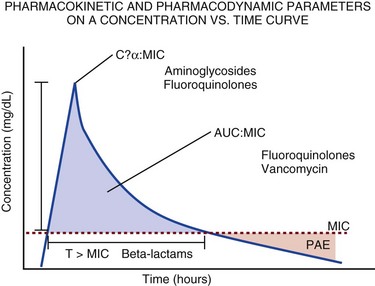
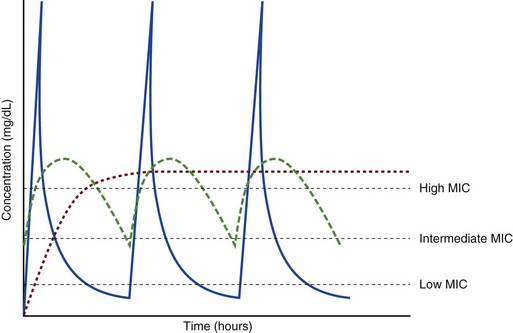
20 The pharmacokinetic profile of a drug is a mathematical model that describes the determinants of drug exposure. A complete model provides quantitative estimates of drug absorption, distribution, metabolism, and excretion after single doses, in addition to the extent of serum and tissue accumulation after multiple doses. Figure 20.1 depicts the concentration-time curve for a single intravenous (IV) dose of tobramycin. The curve allows for estimation of the maximum concentration achieved by the dose in addition to the time course of drug elimination. If dosing is repeated before elimination is complete, accumulation occurs and will continue until the system reaches “steady state,” at which time the rate of administration is in equilibrium with the rate of elimination (Fig. 20.2). The definition of common PK terms can be found in Table 20.1. Factors that determine absorption from the gastrointestinal (GI) tract include drug characteristics such as lipid solubility, ionization, and molecular size, in addition to physiologic factors such as gastric emptying rate, intestinal blood flow, motility, gastric and intestinal pH, gut wall permeability, and whether the dose is administered during the fasted or fed state.1 Most drugs are orally absorbed through passive diffusion; although carrier-mediated absorption can also be important. The most important sites of absorption are the upper and lower segments of the small intestine.2 The stomach regulates absorption through gastric emptying but is not an important site for absorption. Similarly, little drug absorption occurs in the colon with the exception of extended-release products.1 Drugs with low oral bioavailability will require larger doses administered orally to produce equivalent exposure to that obtained from IV administration. Some drugs (e.g., vancomycin) have such poor bioavailability after oral administration that they cannot be used to treat the same disease processes as the IV formulations. Bioavailability is an important consideration when converting between oral and IV routes. For example, a patient who takes furosemide 80 mg orally at home would need only 40 mg given intravenously because this drug has 50% bioavailability on average. Other routes of administration include subcutaneous (SC) and intramuscular injection, transdermal absorption, buccal absorption, and inhalation. Many drugs that are available as IV preparations are amenable to SC and intramuscular administration. However, some IV drugs have characteristics that preclude administration by routes other than large-bore catheters. These drugs include those with very basic or acidic pH, or those that act as vesicants and therefore need diluents added to maintain solubility. Drugs with adequate lipid solubility are amenable to transdermal and buccal administration. After reaching the systemic circulation an administered dose then distributes throughout the body to produce a peak concentration. The relationship between the dose administered and the peak concentration observed after accounting for bioavailability is termed the volume of distribution (Vd). Vd estimates the size of the compartment into which the drug distributes. Total plasma volume in the average adult is 3 to 4 L.1 However, the Vd for most drugs is much greater than this value. The discrepancy between plasma volume and a drug’s Vd is accounted for by the extent that drugs concentrate in various tissues. The main determinants of Vd are the drug’s lipid solubility, degree of protein binding, and extent of tissue binding.1 High lipid solubility increases Vd through improved passage across cell membranes. Avid tissue binding also increases Vd as this concentrates drug outside the vascular space. Conversely, because only unbound drug can cross cell membranes and bind to tissue, high protein binding decreases Vd. The simplest conceptualization of Vd is to view the body as a bucket—one large compartment where drug rapidly equilibrates between plasma and tissue and has uniform distribution (Fig. 20.3A). The one-compartment assumption is useful for drugs with small to intermediate Vds, such as aminoglycoside antibiotics, because these drugs have a short distribution phase owing to their limited tissue penetration. Drugs with large Vds, such as fentanyl and amiodarone, require longer periods of time to achieve equilibrium between serum and tissue and thus have a prolonged distribution phase. As a result, the one-compartment assumption fails to accurately describe large Vd drugs. An alternative is to view the body as multiple compartments: a central compartment composed of blood, extracellular fluid, and highly perfused tissues; and one or more peripheral compartments composed of tissue beds with lower perfusion and drug binding affinity (Fig. 20.4A). The number of peripheral compartments required will be determined by the differential distribution rate in each tissue. Two-compartment models adequately describe most large Vd drugs; however, a three-compartment model can be useful for agents that act in the central nervous system because of slower distribution as a result of the blood-brain barrier. The rate of drug removal via all routes of elimination is termed clearance, which is expressed as the volume of plasma cleared per unit of time. This value is assumed to be constant for most drugs. Defining total body clearance in terms of volume has important implications. If the volume of blood cleared per unit of time is constant, it then holds that the amount of drug cleared per unit of time must change in proportion to serum concentration. An increase in the rate of drug administration will lead to an increase in serum concentration, which in turn leads to commensurate increases in the rate of drug removal. Serum and tissue concentrations will accumulate until the rate of elimination is in equilibrium with the rate of administration, at which time the system is said to be at “steady state” (Figs. 20.2 and 20.5). Accumulation follows a linear pattern for most drugs, meaning that increases in dose are always matched by proportional increases in elimination, thus producing proportional changes in serum concentration (see Fig. 20.5). Drugs that follow this pattern of accumulation are said to have first-order kinetics. However, some drugs exhibit saturable elimination. These drugs follow linear accumulation until the saturation point for elimination is reached. Once elimination is saturated, small changes in dose can produce substantial increases in concentration (see Fig. 20.5). Drugs that follow this pattern of accumulation have zero-order kinetics. Examples of drugs used in critically ill patients that have saturable elimination include phenytoin, heparin, propranolol, and verapamil. ke can be further transformed into half-life: For any system that follows exponential decay, half-life can be used to estimate the amount of elimination that has occurred: after 5 half-lives more than 90% is eliminated. Elimination approaches 100% after 7 half-lives. The time required for a dosing regimen to reach steady state is also an exponential function and thus can be estimated using half-life. This “5-7” rule of thumb is useful at the bedside. Dosing regimens approach maximal effects after 5-7 half-lives. Similarly, drug effects are usually completely dissipated after 5-7 half-lives. Using this rule, it can be predicted that drugs with long half-lives may take several days to produce target effects. This is less than ideal in the critically ill population when effective treatment is needed rapidly. As a result, loading doses are frequently used to hasten the time to steady state. Loading doses can be calculated by multiplying the target steady-state peak concentration by the patient’s Vd. Recommendations for effective loading doses of most long half-life drugs are provided in the package labeling as applicable. When estimations of bioavailability, Vd, and clearance are available, the concentration-time curve can be modeled. As discussed earlier, the one-compartment model is useful for hydrophilic drugs with small Vd. Figure 20.3B depicts serum concentration-time curve of a one-compartment model drug after IV administration plotted on a logarithmic scale. The initial peak concentration can be estimated using Vd and the size of the dose. The peak is followed by a short distribution phase, during which time drug is removed from the plasma through distribution to tissue in addition to being eliminated. After distribution is complete, the curve is defined by a second phase when drug is removed from plasma via elimination only. The time course of this phase can be estimated using half-life. The transition from distribution to elimination phase can be seen as a change in slope of the concentration curve. This is known as a bi-exponential pattern of decay. Because the distribution phase is short (usually 15-30 minutes) it can usually be ignored when performing calculations. Conversely, large Vd drugs are more accurately represented using a two-compartment model (Fig. 20.4B). The important difference between one-compartment and two-compartment models is the significance of the distribution phase, which is much longer for drugs following a two-compartment model. As in the one-compartment model, the transition between distribution and elimination phases can be seen. However, a third phase is also evident near the end of the curve. This redistribution phase is a result of slow release of drug from the tissues back into the serum. This slow tissue release, known as the “context-sensitive half-life,” is responsible for the increased duration of pharmacologic effect seen after continuous infusions of highly lipophilic drugs such as fentanyl, midazolam, and propofol. As described in preceding sections, PK allows the clinician to estimate serum and tissue concentrations produced from dosing regimens. For example, a clinical pharmacist can use pharmacokinetic calculations to determine that 200 mg of tobramycin given as a 30-minute IV infusion will produce a peak concentration of 20 mg/L and will have an elimination half-life of 5 hours (see Fig. 20.1). Unfortunately, this information alone is not sufficient to guide dosing. From this example it is obvious that PK gives no information regarding whether these concentrations are appropriate. The clinician must still determine whether the peak concentration will be effective in treating the patient’s infection while also determining the risk of nephrotoxicity associated with this level. This is when the study of pharmacodynamics (PD), which defines the relationship between drug concentration and effect, becomes important. Although PD concepts are important for all dosing decisions, PD parameters have been best defined for antibiotics in part because the effect of interest (bacterial killing) can be readily measured through in vitro and in vivo studies. Therefore, the PD portion of this chapter will focus on antibiotics. However, the basic concepts can be applied to all drugs. Minimum inhibitory concentration (MIC) was the first PD parameter to show utility in predicting the effectiveness of antibiotic regimens. The MIC of an antibiotic is the minimum concentration needed to inhibit bacterial growth in vitro. It is intuitive from this that effective dosing regimens in humans would produce concentrations above this value. Less intuitive is determining how much higher the MIC concentrations need to be and for how long. Decades of research into these questions have elucidated additional PD parameters that help to optimize antibiotic dosing (Fig. 20.6). Interest in PD dose optimization has resurged in recent years in response to the convergence of increasingly drug-resistant bacteria with the lack of novel compounds in the drug development pipeline to treat these dangerous pathogens.3 Consequently, it is more important now than ever to maximize the effectiveness of the agents currently in use. Two main factors determine the PD profile of an antibiotic: the dependence of effect on concentration and the persistence of effect after dosing. Antibiotics are first classified by the extent to which the rate of bacterial killing increases in response to increases in concentration. Some antibiotics show a robust dose response, whereas others do not. This relationship was elucidated in the neutropenic murine thigh infection model, when the effect of increasing antibiotic concentration on bacterial killing was examined.4 In repeated studies, the model showed that increasing concentration substantially increases both the magnitude (change from baseline) and the rate (change over time) of bacterial killing for aminoglycoside antibiotics such as tobramycin and the fluoroquinolone antibiotics such as ciprofloxacin. However, the same effects are not observed for the β-lactam classes of antibiotics. Although small concentration effects are observed in some models, the effect is saturated at a relatively low concentration (4-5 times the MIC). The difference in effect is related to the location of each agent’s target receptor. Both aminoglycoside and fluoroquinolone antibiotics have receptor targets that are intracellular. Penetration of these antibiotics into the cell is enhanced by high concentrations. As a result, the activity of these agents can be predicted by the ratio of the peak concentration achieved by a given dose to the MIC of the organism. Accordingly, these agents are classified as concentration-dependent antibiotics. Conversely, β-lactams inhibit the formation of bacterial cell wall via inhibition of penicillin-binding protein (PBP). This protein is located on the bacterial cell surface, allowing effective binding at lower concentrations. In fact, in vitro analyses have shown that nearly all available PBP targets become saturated at concentrations that are four to five times the bacteria’s MIC.5 Above this level, the action of β-lactams is relatively independent of concentration, making the duration of time that concentrations remain above the MIC the parameter most predictive of effect. Another important observation from in vitro models is the persistent inhibition of bacterial growth after drug concentration falls below the MIC. This phenomenon, known as the postantibiotic effect (PAE), is common to all antibiotics, although the magnitude varies depending on the specific antibiotic and pathogen being analyzed. PAE is usually prolonged (3-6 hours) for agents that inhibit nucleic acid and protein synthesis such as the aminoglycosides.4 Most cell wall active agents such as the β-lactams have a short PAE for gram-positive bacteria and complete absence of PAE against gram-negative bacteria. As a result, bacterial regrowth occurs immediately as concentration falls below the MIC.4 Carbapenems are an exception to this as they are cell wall active agents and have a prolonged PAE. Alexander Fleming first discovered penicillin in 1928, marking the dawn of the antibiotic era. It was more than 2 decades later when Harry Eagle first noted that penicillin’s effect could be modulated by dosing regimen. Specifically, he observed that penicillin’s ability to kill bacteria was dependent on the amount of time that the drug was maintained at or above the bacteria’s MIC.6 Later experiments confirmed time above MIC (T > MIC), as the PD index that predicts bacterial killing for penicillin and other β-lactam agents.4 The T > MIC required for optimal response varies among the different β-lactams and is likely related to differences in the rate of bacterial killing and presence of PAE. Cephalosporins require the highest T > MIC (50-70%), followed by the penicillins (30-50%) and the carbapenems (20-40%). The importance of T > MIC has gained increasing attention in the last decade as a result of increasing bacterial resistance. Resistant bacteria have elevated MICs, making it more difficult to achieve adequate T > MIC (Fig. 20.7). In addition, PK studies conducted in critically ill patients have shown that standard β-lactam dosing regimens may produce unacceptably low serum concentrations, resulting in diminished T > MIC.7,8 Although failure to achieve adequate T > MIC has been shown to predict outcome in numerous animal models,9 there have been relatively few data in humans until recently. One study of patients with gram-negative bacteremia found mortality rates to double as the MIC increased from 4 mg/L to 8 mg/L in patients who were treated with cefepime.10 The importance of this finding is magnified when one considers that an MIC of 8 mg/L is considered to be within the susceptible range for cefepime. A similar increase in mortality rate was found in patients with bacteremia due to Pseudomonas aeruginosa: the relative risk of 30-day mortality was increased nearly fourfold when standard doses of piperacillin were used to treat isolates with elevated MICs to piperacillin.11 Although serum concentrations were not measured in these studies, the data provide indirect evidence that links reduced T > MIC to poor clinical outcome. In another study of gram-negative infection treated with cefepime, actual T > MIC was calculated using serum concentration data. The study showed that likelihood of achieving bacterial eradication was significantly correlated with T > MIC.12 The inability to achieve adequate T > MIC has led to the investigation of alternative dosing regimens. Simple dose escalation strategies are hampered by increasing the risk for toxicity. One alternative is to change the shape of the concentration-time curve using continuous or extended infusions. As seen in Figure 20.7, extending the infusion duration changes the shape of the concentration-time curve to promote longer T > MIC. Several PK studies have confirmed that these alternative dosing strategies can increase T > MIC without increasing the size of the dose. One study found that T > MIC following a 2-g dose of meropenem was increased 15% by extending the infusion duration from 0.5 hour to 3 hours.13 Although there are no outcome data in humans comparing extended infusions to continuous infusions, PK studies suggest a similar probability of target attainment.14 An additional theoretical consideration when comparing the extended and continuous strategies is the risk of selecting resistant bacteria. Mathematical modeling of bacterial growth dynamics suggests that a constant rate of bacterial killing creates more opportunity for generating resistant mutants than does a fluctuating kill rate.15 This effect has been demonstrated in an in vitro model of ceftazidime continuous infusion, when maintenance of steady-state serum concentrations slightly above the bacteria’s MIC resulted in the emergence of resistant bacteria subpopulations.16 This has led some investigator to recommend serum concentration monitoring if continuous infusions are used, with adjustment of the infusion rate to ensure steady-state concentrations are adequate.17 Although extended infusions produce more consistent concentrations compared to standard infusions, they produce greater fluctuation compared to continuous infusion. Extended infusions also possess the logistical advantage of less infusion time and therefore greater IV access. This is of particular benefit in patients who require multiple vasoactive and nutritional infusions. Despite having sound PK/PD rationale, the clinical benefit of extended or continuous infusion strategies has yet to be documented in randomized clinical trials.18 Most available trials have important methodologic limitations. Although extended infusions increase T > MIC compared to standard infusions, the benefit is of greatest importance for bacterial isolates with elevated MICs because standard doses already provide optimal T > MIC when MIC is low. The benefit of extended infusions is also a function of the patient’s renal function. Nicasio and associates recently found 3-hour infusions of cefepime increased T > MIC compared to standard 0.5-hour infusions but the effect was limited to patients with preserved renal function (creatinine clearance [CrCl] 50-120 mL/minute).19 This effect modification is due to the prolonged half-life of cefepime in renal dysfunction, leading to higher trough concentrations and increased T > MIC. In light of these considerations, it is likely that the benefit of extended infusion strategies is greatest in patients with preserved renal function who are infected with high MIC pathogens, such as P. aeruginosa and Acinetobacter baumannii. Aminoglycosides are broad-spectrum gram-negative agents that have been in clinical use since the 1960s. These agents quickly developed a reputation for having poor effectiveness and a high rate of nephrotoxicity compared to β-lactam agents. However, much of the initially dismal results observed with these agents are likely related to an inadequate knowledge of their PD profile. At the time, PD data available from β-lactam studies demonstrated T > MIC to be the important factor predicting efficacy.6 As a result, early dosing strategies used small (1-2 mg/kg) doses given every 8 to 12 hours and little attention was paid to peak concentrations. The importance of achieving an adequate peak:MIC ratio was first described in patients by Moore and colleagues, who found that the likelihood of having a positive clinical response was greater than 90% when peak concentrations were 8 to 10 times the infecting organism’s MIC.20 A later study found that time to defervescence and normalization of leukocytosis was greater than 90% when peak:MIC ratio was 10 or greater.21 These data suggest that achieving high peak aminoglycoside concentrations is fundamental to successful treatment. In recognition of this, clinicians began to monitor peak aminoglycoside levels and adjust dosing regimens to ensure optimal peak:MIC ratios. Aminoglycosides also exhibit a prolonged PAE. The duration of PAE in neutropenic animal models varies from 1 to 8 hours and is a function of the peak:MIC ratio.22 Higher ratios produce longer PAE. In addition, data suggest that PAE may be enhanced in patients with an intact immune system.4 Based on the combination of concentration-dependent activity and a prolonged PAE the efficacy of these agents could be maximized by giving large doses less frequently. This strategy is known as extended interval dosing (EID). Because aminoglycosides have short half-lives, the drugs are completely cleared from serum near the end of a 24-hour dosing interval in patients with normal renal function. Although the absence of drug may be concerning for the regrowth of bacteria, this is prevented by the PAE. In addition, a drug-free period near the end of the dosing interval minimizes the phenomenon known as adaptive resistance. Primarily described in P. aeruginosa infection, adaptive resistance refers to the diminished rate of bacterial killing after initial exposure to aminoglycosides.23 This effect is caused by up-regulation of membrane-bound efflux pumps, which decrease the amount of drug that reaches the site of action inside the cell.23 When the bacteria are free from drug exposure for a sufficient amount of time the adaptive resistance is lost and the bacteria will become fully sensitive again. Thus, in addition to achieving high peak:MIC ratios, EID may also allow for the reversion of adaptive resistance and greater bactericidal effect. A wide variety of doses have been utilized in EID strategies. However, the most common are 5 to 7 mg/kg for gentamicin and tobramycin and 15 to 20 mg/kg for amikacin.24 These doses were chosen based directly on PK/PD relationships. EID assumes that patients have a Vd that is within the normal range (0.25-0.3 L/kg). When given to patients who meet this assumption, the doses will produce peak concentrations that range from 16 to 24 mg/L and will achieve target peak:MIC ratios for isolates with an MIC up to 2 mg/L.25 EID is also designed to achieve a drug-free period of at least 4 hours at the end of the dosing interval.25 Because aminoglycosides are cleared renally, dosing frequency is based on renal function assessment using estimated CrCl. To achieve an adequate drug-free interval, doses are given every 24 hours for patients with CrCl greater than 60 mL/minute, every 36 hours with CrCl 40 to 59 mL/minute, and every 48 hours with CrCl less than 40 mL/minute.25 If aminoglycosides are used in renal dysfunction it is important that they still be dosed on weight owing to their peak:MIC dependent activity. EID of aminoglycosides has not been adequately studied in some patient populations (i.e., cystic fibrosis, thermal injury, pregnancy). The lack of validation data leads to the exclusion of these patients from EID nomograms, with the alternative being to use traditional dosing. However, based on our knowledge of the optimal PD parameter and the increased clearance seen in these populations, traditional dosing strategies may result in higher failure rates. The benefit of EID has been studied in many small clinical trials and the results summarized in multiple meta-analyses. The conclusion from these studies is that EID produces similar efficacy to traditional dosing that is guided by close monitoring of peak concentrations.26 However, most trials employed combination therapy with a β-lactam agent with activity against the infecting pathogen, potentially masking the effect of aminoglycoside dosing strategy. As mentioned earlier, the use of aminoglycosides is limited by their propensity to induce nephrotoxicity. Nephrotoxicity is the result of accumulation in the epithelial cells of the proximal renal tubule. Of great importance is the fact that the rate of accumulation is saturable at relatively low concentrations in the tubule lumen.27 This means that toxicity is not concentration dependent but rather time dependent. The implication is that high peak concentrations are just as safe as low peak concentrations. Once saturated, the rate-limiting step of tissue accumulation becomes the duration of exposure. Because EID produces a drug-free period near the end of the dosing interval, it reduces the amount of time drug can accumulate, potentially reducing toxicity. In vivo studies have confirmed that EID reduces renal accumulation.28 It has been shown that a threshold of accumulation is needed before nephrotoxicity is produced and that this threshold is typically reached after 5 to 7 days of therapy.29 Importantly, using EID prolongs the time to toxicity but the risk is not abolished. Once the duration of therapy exceeds 1 week, toxicity increases substantially regardless of dosing strategy. Duration of therapy was found to be a significant risk factor for toxicity in a cohort of elderly patients receiving once-daily aminoglycoside therapy.30 The incidence of nephrotoxicity was only 3.9% in the 51 patients who received aminoglycoside therapy for less than 7 days compared to 30% in the 37 patients who received 8 to 14 days of therapy, and 50% of 8 patients receiving more than 14 days. Methicillin-resistant Staphylococcus aureus (MRSA) remains one of the most important pathogens causing infection in critically ill patients.31 Vancomycin has been the drug of choice for treating this pathogen for nearly 50 years. It inhibits cell wall formation in gram-positive bacteria in a similar fashion to the action of β-lactams. However, vancomycin binds a different receptor and produces a slower bactericidal effect. This slow bactericidal activity likely explains the slower symptom resolution and higher failure rates with vancomycin compared to β-lactams in the treatment of MRSA infections.32 The current breakpoint for vancomycin susceptibility against Staphylococcus species is an MIC of 2 mg/L.33 In recent years, studies have identified MIC to be an important indicator of response to vancomycin therapy, which serves as a good example of how MIC can modify the ability of dosing regimens to achieve PD targets.34 It was unclear for many years which PD parameter correlated best with vancomycin activity. Because vancomycin, like the β-lactams, inhibits cell wall formation, one might presume T > MIC to be the best parameter. This assumption is supported by in vitro models showing that bacterial killing rate is concentration independent once above the MIC.35 Other models show total drug exposure, as measured by the 24-hour AUC, to be more important for clinical response. In a study of patients with lower respiratory tract infection, Moise-Broder and coworkers found the AUC:MIC ratio to predict clinical response better than T > MIC.36 They found a sevenfold increased probability of clinical cure and a decreased time to bacterial eradication when the AUC:MIC ratio was at least 400. No correlation with outcome was found for T > MIC. The discrepancy between vancomycin PD targets identified with in vitro models and human data underscores the importance of understanding the role of protein binding and tissue penetration. This is especially important for critically ill patients who can have altered tissue permeability and serum protein concentrations. Despite these limitations, total AUC:MIC ratio seems to be the best predictor of vancomycin activity and provides a parameter that can be easily monitored at the bedside. Vancomycin dosing guidelines published in 2009 state that an AUC:MIC ratio of 400 or greater is the most appropriate PD target and that vancomycin trough concentrations should be monitored as a surrogate for AUC.37 The guidelines recommend targeting steady-state trough concentrations of 15 to 20 mg/L for infections difficult to treat such as endocarditis, osteomyelitis, bacteremia, meningitis, and pneumonia. These troughs will achieve an AUC:MIC ratio of 400 or greater for pathogens with an MIC less than 1 mg/L. It is important to note that the success of this trough target is dependent on pathogen MIC. Mathematical simulations show that trough concentrations of 15 to 20 mg/L are unable to achieve target AUC:MIC ratios when the pathogen MIC is greater than 1 mg/L.38 These simulations are supported by a recent meta-analysis that found a 64% relative increase in mortality risk when comparing high MIC (>1.5 mg/L) isolates to low MIC (<1.5 mg/L) isolates.34 Although most MRSA isolates still have an MIC of 1 mg/L or less, many institutions have documented gradual increases in the number of isolates with MIC greater than 1 mg/L over the past decade.39 MRSA isolates with a high MIC represent a currently unsolved therapeutic dilemma. An intuitive solution would be to increase target trough concentration in hopes of achieving target AUC:MIC. Steady-state troughs of 25 to 30 mg/L would reliably achieve AUC:MIC ratios greater than 400 against an MIC of 2 mg/L. This strategy would likely be unfeasible, however, as recent data have linked high troughs with increased risk of nephrotoxicity. One observational study showed the risk to increase when the initial trough concentration was greater than 20.40 This finding is in agreement with data from a recent randomized clinical trial comparing vancomycin to linezolid for treatment of pneumonia.41 The rate of nephrotoxicity was increased in patients who receive vancomycin compared to linezolid (18.2% vs. 8.4%, respectively). In addition, a dose response was observed in the vancomycin arm: toxicity was observed in 37% of patients with initial trough greater than 20 mg/L, 22% when initial trough was 15 to 20 mg/L, and 18% when initial trough was less than 15 mg/L. Although these data use trough concentration to assess the dose:response relationship, trough is closely correlated with peak concentration and total AUC. Consequently, it is unclear which parameter is most closely associated with toxicity. An observational study showed continuous IV (CIV) infusions of vancomycin to have a slower rate of onset of nephrotoxicity compared to intermittent IV (IIV) infusion despite having similar cumulative doses in the two groups.42 This study suggests that toxicity may be related to high peak concentrations, although more data are needed to verify these findings. The only randomized clinical trial to date of this strategy found no difference in safety or efficacy of continuous versus intermittent IV vancomycin.43 Consequently, until more data are available, targeting troughs above 15 to 20 mg/L or the use of high-dose CIV infusions cannot be recommended. Another option for treating high MIC isolates is to use alternative agents with activity against MRSA (i.e., linezolid, daptomycin, telavancin, and ceftibiprole). However, to date no agent has definitively been shown to provide improved outcome compared to vancomycin in the general treatment of MRSA. Additionally, few data are available that compare agents specifically in patients with high MIC isolates, and cross-resistance between vancomycin and alternative agents has been noted.44 Understanding the basic concepts of PK and PD is essential to providing safe and effective drug therapy. However, the physiologic derangements found in critically ill patients can significantly alter PK/PD relationships, which can lead to both exaggerated and diminished pharmacologic response with standard dosing regimens. Consequently, the ICU clinician must integrate a thorough understanding of critical illness physiology with PK/PD principles to provide appropriate drug therapy. A summary of these changes can be found in Table 20.2. The systemic inflammatory response syndrome (SIRS) is present to some degree in nearly all critically ill patients. Common insults such as sepsis, trauma, surgery, the acute respiratory distress syndrome, and pancreatitis all produce SIRS. Salient features of SIRS are increased heart rate, decreased arterial vascular tone, and increased vascular membrane permeability.45 Without adequate fluid resuscitation the result is low intravascular volume, inadequate preload, and subsequent low cardiac output. As a result, blood flow to organs such as the liver and kidneys can be compromised, leading to decreased drug clearance and serum and tissue accumulation. This physiology is commonly seen in patients admitted with sepsis when adequate resuscitation has not yet occurred. Fluid resuscitation restores preload and increases cardiac output. Because of increased heart rate and low systemic vascular resistance, patients with resuscitated SIRS or sepsis frequently have hyperdynamic physiology in which organ blood flow can be higher than normal.46 Consequently, drug clearance will also be higher than normal. This change is of special concern in patients with sepsis as it may lead to increased antibiotic clearance, suboptimal PD achievement, and worse treatment response.47 Low serum levels of cephalosporin antibiotics have been documented in septic patients given standard doses.7 In addition, the need for increased dosing frequency has been documented for trauma patients treated with vancomycin.48 Although there are no clinical trial data examining this issue, there is a physiologic rationale to administer higher doses or extended infusions of β-lactams and other renally cleared drugs to patients with hyperdynamic physiology.47
Principles of Drug Dosing in Critically Ill Patients
General Pharmacokinetic Principles
Absorption
Distribution
Clearance
Half-Life
Modeling the Concentration-Time Curve
Pharmacodynamics
β-Lactams
Aminoglycosides
Vancomycin
The Effect of Critical Illness on Pharmacokinetics and Pharmacodynamics
![]()
Stay updated, free articles. Join our Telegram channel

Full access? Get Clinical Tree


Anesthesia Key
Fastest Anesthesia & Intensive Care & Emergency Medicine Insight Engine

