I. HEMODYNAMIC MONITORING is one of the cornerstones of patient evaluation in the intensive care unit and provides diagnostic and prognostic value. The choice of monitoring depends on the diagnostic needs of the patient and the risk–benefit balance of monitor placement and maintenance. This chapter outlines an approach to assessment of hemodynamics and perfusion in critically ill patients and the technical principles of commonly used monitoring methods.
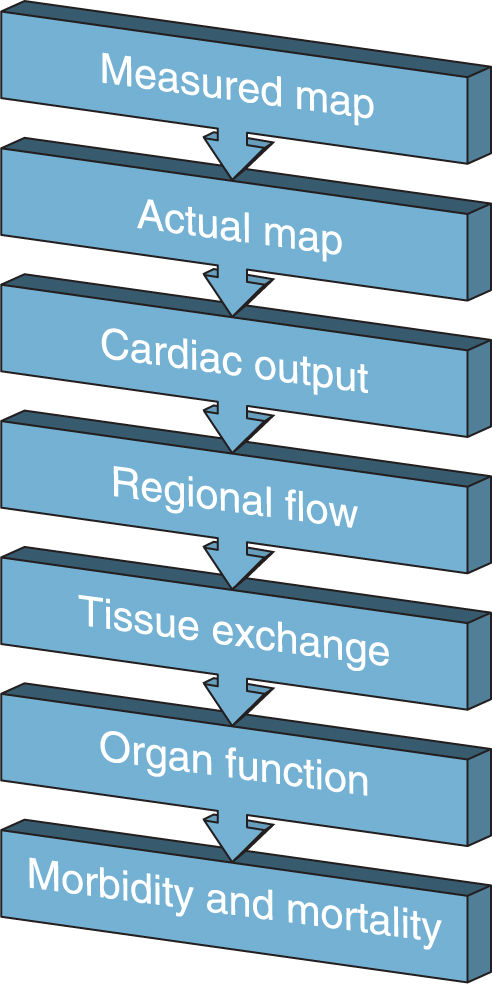
A. Perfusion: The goal of hemodynamic monitoring is to ensure adequate tissue perfusion for gas, nutrient, and waste exchange to ultimately decrease morbidity and mortality. To get from optimizing a single hemodynamic parameter to improving morbidity and mortality requires many assumptions (as shown in Fig. 1.1 for mean arterial pressure, MAP). For this reason, the intensivist should not rely solely on any one physical monitor and should look for other signs of adequate perfusion such as mental status, urine output, or laboratory findings (e.g., central venous oxygen saturation, base deficit, lactate).
B. Optimizing Perfusion: Hemodynamic monitors by themselves are not therapeutic. Hemodynamic data should be used to guide therapy. Optimizing perfusion may require fluid administration, diuresis, pharmacologic agents (e.g., vasoconstrictors, inotropic agents), or interventions (e.g., thrombectomy, intra-aortic balloon pump, ventricular assist devices, extracorporeal membrane oxygenation). With this in mind, any monitor must be used dynamically to ensure that employed therapies are optimizing perfusion over time.
1. Fluid challenge: The fluid challenge is a time-honored test that bears specific mention. Rapid administration of crystalloid (typically 500 cc–1 L) while monitoring hemodynamics is used to determine if a patient may benefit from fluid, as suggested by an increase in cardiac output or blood pressure, for example. A “passive leg raise” test provides similar information. To perform this test, a clinician passively elevates a supine patient’s legs. Blood moves to the central veins from the elevated limbs, providing an “autotransfusion” of approximately 150 to 300 cc. An improvement in hemodynamics suggests fluid responsiveness, whereas deterioration in hemodynamics can be quickly reversed by lowering the legs.
II. ARTERIAL BLOOD PRESSURE MONITORING
A. General Principles
1. Blood pressure describes the pressure exerted by circulating blood within the blood vessels. Since this pressure drives flow, it is used as a surrogate measure of blood flow and, in turn, organ perfusion (Fig. 1.1). This simplified view has limitations and notably poor correlation with cardiac output in some situations, such as emergency resuscitation of the hypovolemic critically ill patient. Nonetheless, arterial blood pressure monitoring as a target for perfusion is used in almost all critical care settings and has been linked to morbidity and mortality outcomes.
2. Under normal circumstances, tissue perfusion is maintained across a range of pressures by autoregulation, which describes the intrinsic capacity of vascular beds to maintain flow by adjusting local vascular resistance. However, pathological conditions common in the intensive care unit such as chronic hypertension, trauma, and sepsis may impair autoregulation, resulting in blood flow that may depend directly on perfusion pressure.
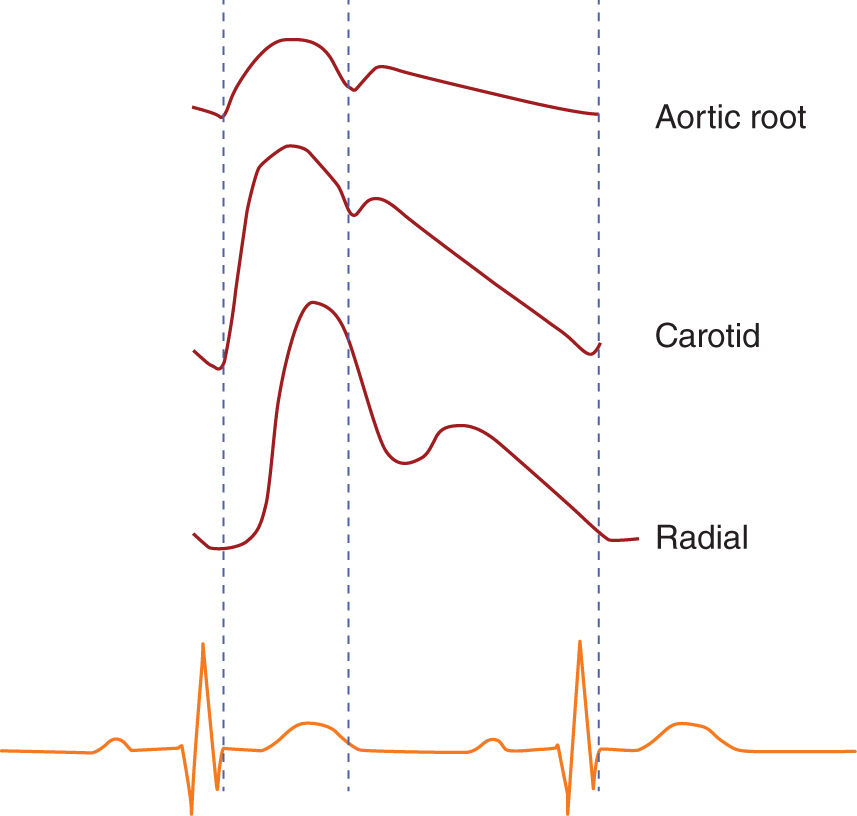
3. The “gold standard” for blood pressure measurement is aortic root pressure, which is representative of the stresses faced by the major organs (e.g., heart, brain, kidneys). As the pressure wave travels distally from the aorta, the measured mean pressure decreases while the measured pulse pressure (systolic pressure minus diastolic pressure) is increased owing to pulse wave reflection from the high-resistant distal arterioles. In addition to being amplified, as one progresses distally, the arterial waveform is slightly delayed (Fig. 1.2). The difference in mean pressure is typically minimal given the low arterial resistance, but can be significant in some situations (e.g., high-dose vasoconstrictor administration).
B. Noninvasive Blood Pressure Monitoring: Various techniques can be used to measure blood pressure noninvasively including manual palpation, determination of Korotkoff sounds with a sphygmomanometer and stethoscope or Doppler ultrasound, and automated oscillometric methods, which are most common in the ICU.
1. Function: The oscillometric method uses a pneumatic cuff with an electric pressure sensor, most commonly over the brachial artery. The cuff is inflated to a high pressure and then slowly deflated. Arterial pulsations are recorded as oscillations. The pressure that produces greatest oscillation recording is closely associated with mean arterial pressure. Systolic and diastolic pressures are then calculated, often using proprietary algorithms.
2. Technique: Accurate noninvasive blood pressure measurement requires appropriate cuff sizing and placement. Most blood pressure cuffs display reference lines for an acceptable arm length, and the cuffs should be sized as recommended in relationship to arm circumference. Cuffs that are too small may overestimate blood pressure, whereas cuffs that are too large may underestimate blood pressure.
3. Limitations and risks:
a. The pressure measured by a noninvasive cuff is the pressure at the cuff site. When an extremity pressure is measured to estimate coronary perfusion, either the extremity should be elevated to the level of the heart, or the fluid column should be accounted for (e.g., a pressure measured at a site 10 cm below the heart will be 10 cmH2O or approximately 7.4 mmHg greater than the pressure at the heart).
b. Tissues, including vessels and nerves, can be damaged by cyclical compression of pneumatic cuffs with frequent cycling. Automatic methods may not be reliable in rapidly changing situations, such as extremes of blood pressure, rapidly changing blood pressure, or patients with dysrhythmias.
C. Invasive Arterial Blood Pressure Monitoring provides beat-to-beat pressure transduction and allows convenient blood sampling.
1. Indications for placement of an arterial line include hemodynamic instability, need for tight blood pressure control, or need for frequent blood sampling.
2. Site: The radial artery is frequently selected given the existence of collateral circulation to distal tissues, convenient access for ongoing care, and patient comfort. Alternative sites in adults include the brachial, axillary, femoral, and dorsalis pedis arteries.
3. Function: Necessary equipment to monitor invasive arterial blood pressure includes an intra-arterial catheter, fluid-filled noncompliant tubing, transducer, continuous flush device, and electronic monitoring equipment. The flush device typically provides an infusion of plain or heparinized saline at a rate of 2 to 4 milliliters per hour through the tubing and catheter to prevent thrombus formation. Commonly employed arterial line pressure bag/transducer systems provide this slow flush by design. The transducing sensor is “connected” to arterial blood by a continuous line of fluid and measures a pressure deflection in response to the transmitted pressure wave of each heartbeat. The accuracy of intra-arterial blood pressure measurement depends on the proper positioning and calibration of the catheter–transducer monitoring system.
a. Positioning: The arterial pressure transduced is at the level of the transducer, not at the level of the cannulation site. This is because of the fluid-filled tubing between the patient and transducer, which maintains energy by exchanging potential energy for pressure (Bernoulli’s equation). For example, if the transducer is lowered, the fluid in the tubing exerts an additional pressure on the transducer and the measured pressure will be higher. Therefore, the arterial transducer should be placed at the level of interest. For example, positioning at the fourth intercostal space on the midaxillary line (“the phlebostatic axis”) corresponds to the level of the aortic root, and positioning at the external acoustic meatus corresponds to the Circle of Willis.
b. Static calibration zeroes the system to atmospheric pressure. The transducer is opened to air and the recorded pressure (the atmospheric pressure) is set to zero.
c. Dynamic calibration: The two components of dynamic calibration of an oscillating system are resonance (which increases pulse pressure amplitude) and damping (which decreases pulse pressure amplitude).
1. Resonance: When an arterial pulsation “hits” the elastic arterial wall, this vibrates and, just like a musical fork, generates an infinite series of sine waves of increasing frequency and decreasing amplitude. Typically, the natural frequencies of arterial pulse waveforms are in the 16-to-24-Hz range. The transducer system has its own natural frequency, commonly over 200 Hz. As the natural frequency of the arterial pulse approaches that of the transducer system, the system will resonate—pressure waveforms will be amplified versions of the intra-arterial waveform (“whipped” waveforms with erroneously wide pulse pressures). The resonant frequency of a system can be tested with a fast flush test. Displayed on a strip chart recorder, the resonant frequency of the system can be calculated by measuring the distance between two subsequent peaks of the trace. Tachycardia or a steep systolic upstroke will increase the natural frequency of the arterial pulse and may contribute to resonance.
2. Damping: The damping coefficient is a measure of how quickly an oscillating system comes to rest. A high damping coefficient indicates that the system absorbs mechanical energy well and will cause attenuation of the waveform. Factors that increase damping include loose connections, kinks, and large air bubbles. The ideal damping coefficient depends on the natural frequency of the system, though it is 0.6 to 0.7 for commonly used systems.
4. Complications: Arterial cannulation is relatively safe. Risks depend on site of cannulation. For radial cannulation, reported serious risks include permanent ischemic damage (0.09%), local infection and sepsis (0.72% and 0.13%, respectively), and pseudoaneurysm (0.09%). Fastidious attention to the adequacy of distal perfusion is of great importance. Thrombotic sequelae are associated with larger catheters, smaller arterial size, administration of vasopressors, duration of cannulation, and multiple arterial cannulation attempts. With regard to infectious risk, aseptic technique was not standardized in the studies that yielded the aforementioned percentage of risk, and longer duration of cannulation increased risk. Less serious risks include temporary occlusion (19.7%) and hematoma (14.4%). Axillary and femoral sites are associated with higher risks of infection. Brachial cannulation has been associated with median nerve injury (0.2%–1.4%).
5. Respiratory variation: Increased intrathoracic pressure decreases preload, arterial pressure, and pulse pressure. This effect is marked in hypovolemic patients who are more susceptible to increased intrathoracic pressures. Variation of more than 10% to 12% in systolic pressure or pulse pressure is suggestive of fluid responsiveness. Importantly, this is validated for patients with regular cardiac rhythm and breathing pattern, and it is dependent on the ventilatory pressure delivered.
6. Arterial waveform analysis has been used to gauge stroke volume and is discussed later in this chapter.
D. Discrepancies between Noninvasive and Invasive Arterial Blood Pressure Measurements exist, with noninvasive measurements tending to yield higher measurements during hypotension and lower measurements during hypertension. These discrepancies persist even with appropriate cuff sizing in critically ill patients. Retrospective data suggests that the higher noninvasive systolic blood pressures during hypotension are overestimates of perfusion, since the incidence of acute kidney injury and mortality is higher with noninvasive versus invasive systolic blood pressures. There was no difference in acute kidney injury or mortality when mean pressures were compared. This suggests that mean pressures should be targeted when the hypotensive critically ill patient is treated with a noninvasive cuff.
III. CENTRAL VENOUS PRESSURE MONITORING
A. Indications for placement of a central venous catheter (CVC) include administration of certain drugs, concentrated vasopressors, or TPN; need for dialysis; need for long-term medication administration such as chemotherapy or intravenous antibiotics; need for IV access in patients with difficult peripheral access; or need for sampling central venous blood.
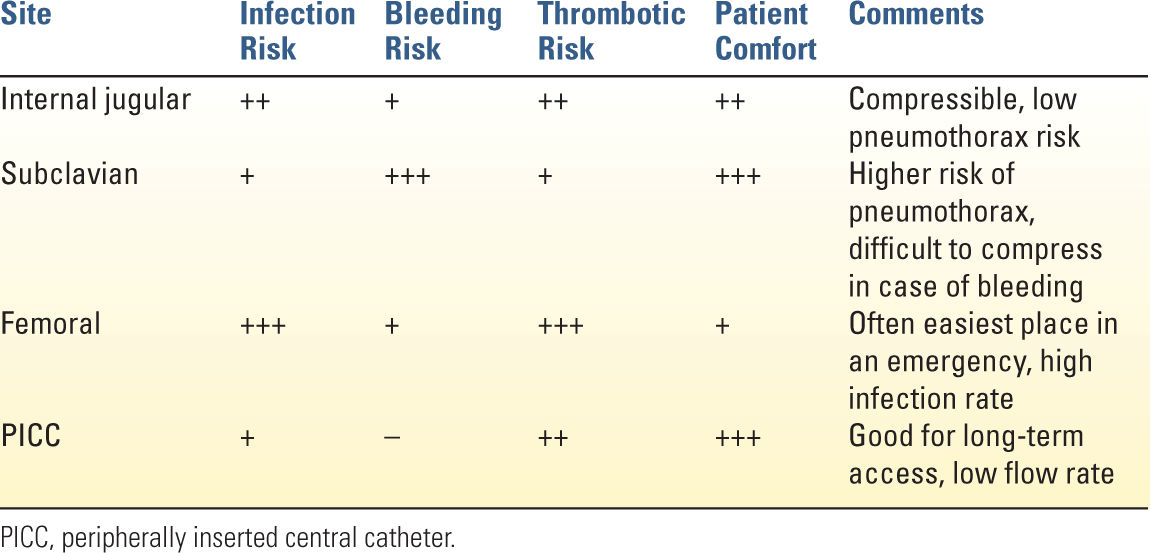
B. Site: Common central venous cannulations sites are the internal jugular, subclavian, and femoral veins. The ideal site of cannulation varies with the characteristics of the patient and the indications for insertion. For example, the subclavian site is relatively contraindicated in coagulopathic patients as it is not directly compressible, and the femoral vein may be ideal in emergency situations because of ease of cannulation. Table 1.1 summarizes the advantages and disadvantages of the most commonly used sites for venous access.
Related posts:


Stay updated, free articles. Join our Telegram channel

Full access? Get Clinical Tree


