Sidestream Capnography
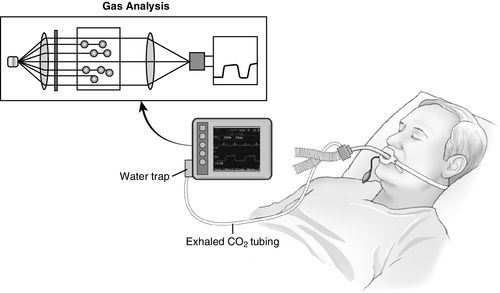
Sidestream capnography (Figure 8-2) is the most widely used method for continuous CO2 monitoring in the operating room. It involves the use of disposable tubing (6 feet long) and a T-piece adapter, which is inserted between the breathing circuit and the endotracheal tube or other airway device. The tubing is connected from the side port on the adapter to a separate monitor unit, which contains the CO2 sensor. A sample of gas is aspirated through this disposable tubing during the respiratory cycle into the capnometer for measurement. Because this gas sample must travel through the tubing to the CO2 sensor before it is processed, a slight delay occurs in the display of the CO2 waveform. One of the main advantages of sidestream capnography is that it can be used in nonintubated patients. For example, modified nasal cannulas allow the sampling of expired gases even while supplemental oxygen is administered. A drawback of sidestream capnography is that the tubing may become blocked by water vapor or secretions. The use of a filter between the tubing and the unit containing the CO2 sensor minimizes this problem. Keeping the sample tubing antigravity may also minimize contamination from water vapor or secretions.2
Mainstream Capnography
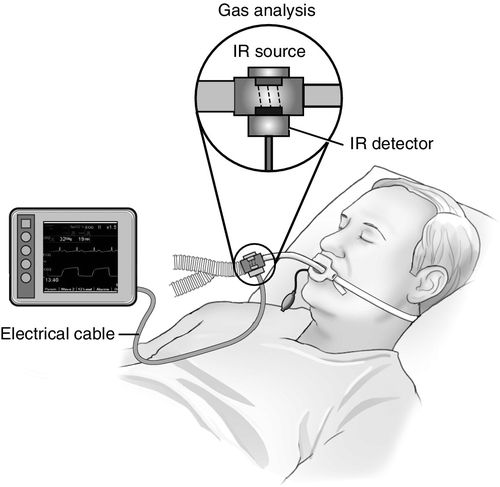
Mainstream capnography (Figure 8-3) involves the use of an adapter between the breathing circuit and the endotracheal tube. In this method, a lightweight infrared sensor is attached directly to the adapter. The sensor emits infrared light to a photodetector on the other side of the adapter. During the respiratory cycle, respiratory gases flow through the adapter, and the amount of CO2 in the sample is measured immediately. No extra tubing is required, and no delay occurs in the display of the waveform. The mainstream sensor is heated above body temperature, which prevents condensation and allows the sensor to function in high-moisture environments. Condensation of moisture may interfere with the functioning of the unit. The earlier generations of mainstream capnometers had significant disadvantages, including bulky sensors requiring sterilization after each use and a risk of facial burns from the heated sensor. Newer versions, however, are more lightweight and have disposable adaptors. The temperature of the sensors is lower with better shielding to minimize the risk of facial burns. Further advances in mainstream capnography have produced smaller lighter weight adapters for use in nonintubated patients also. These units attach directly to the oxygen facemask or nasal cannula, allowing for CO2 monitoring in a spontaneously breathing patient receiving sedation.2
Colorimetric Devices
Colorimetric devices are portable, disposable, single-use devices that contain a pH-sensitive chemical indicator, which changes color on exposure to CO2. Similar to the mainstream capnometer placement, this device is connected between the circuit and the endotracheal tube. The indicator changes from purple to yellow when exposed to a sufficient concentration of CO2 as a chemical reaction. The range of possible colors and the corresponding CO2 concentrations are listed in Table 8-1. Often it is difficult to evaluate the colors, which poses challenges in predicting the CO2 concentration in the expired gases. If the color changes to yellow during every exhaled breath, the CO2 concentration can be estimated to be more than 2%, or over 16 mm Hg. If the color change is not yellow, the expired CO2 level is less than desirable (Table 8-1).
Table 8-1
Exhaled CO2 Detection by Colorimetric Device
| Color | CO2 Concentration |
| Purple | < 0.5% |
| Tan | 0.5%–2% |
| Yellow | > 2% |
Although colorimetric devices are used frequently by critical care providers and paramedics to confirm the presence of CO2 after endotracheal intubation, these devices have their limitations. For example, acidic contents in the stomach may turn the indicator yellow, giving a false-positive reading. Also, a patient who is intubated during cardiac arrest may not expel sufficient CO2 because of the lack of circulation, and the indicator would not change colors even with the endotracheal tube in the correct place.2
The current recommendation from the American Heart Association is to use waveform capnography instead of colorimetric devices even for emergency intubations, as well as during cardiopulmonary resuscitation.1
Waveform Analysis
Normal Capnogram
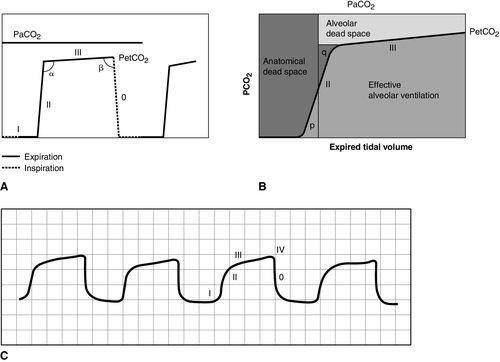
CO2 concentration (Figure 8-4) can be plotted against time (time capnogram), or expired volume (volume capnogram). A time capnogram is commonly used in clinical practice (see Figure 8-4). It is similar in shape in all healthy adults. Any abnormal shape other than the normal capnogram requires full investigation to determine if the alteration in the shape is caused by a physiologic or pathologic abnormality.
To understand the components of a capnogram, a basic understanding of lung anatomy and physiology is essential. The trachea divides into the right and left main bronchi, the right side being shorter, wider, and more vertical. The implication is that a mainstem intubation is more likely to occur with the tube in the right main bronchus rather than in the left. Each mainstem bronchus divides into lobar bronchi, two on the left and three on the right. These bronchi further divide multiple times and eventually end in terminal bronchioles, each of which gives rise to respiratory bronchioles and alveoli. The conductive airways include everything from the trachea to the terminal bronchioles. The portion of lung past the terminal bronchioles, composed of the respiratory bronchioles and alveoli, participates in gas exchange. The alveolus is the most important structure participating in gas exchange, and the contribution of each alveolus to the capnogram depends on its ventilation and perfusion. Air flow and blood flow are not distributed evenly within the lung. The alveoli in the apex of the lung have high ventilation–perfusion (V/Q) ratios (more ventilation, less perfusion), and they contain relatively less CO2 after gas exchange. In contrast, the alveoli in the lower portions of the lung have low V/Q ratios (less ventilation, more perfusion), and they contain CO2-rich gas. During expiration, the CO2 from all alveoli moves through the respiratory tract to exit the trachea, or the endotracheal tube, to the measuring sensor (Figure 8-5).1,2,6
A time-based capnogram is a graphic depiction of the partial pressure of end-tidal CO2 (PetCO2) over time during a ventilatory cycle. It includes both inspiratory and expiratory segments, which allows for monitoring of the dynamics of inspiration and expiration.
The inspiratory segment consists of phase 0, where a sharp decline in CO2 occurs, compared with the end of expiration (see Fig 8-4, A). The expiratory segment is divided into three segments. It begins with phase I, which represents CO2-free gas being expelled from the conducting airways and breathing apparatus. Since this anatomic dead space does not participate in gas exchange, the CO2 concentration is initially zero at the beginning of expiration. Phase II consists of a rapid upstroke in CO2 concentration. In this segment, mixing of expired air from anatomic dead space and alveoli occurs to produce a positive deflection in the graph. Phase III is a plateau with a slightly positive slope that represents CO2-rich gas from alveoli. As stated above, inspiration yields no CO2 as long as no rebreathing occurs, and this accounts for the rapid drop in CO2 concentration from phase III to zero. A normal tracing always returns to baseline prior to the next expiratory cycle.
The alpha-angle is the angle between phase II and phase III, and it is affected by changes in the slope of phase III. The clinical implication of this angle is that it is an indirect indication of V/Q mismatch in the lungs. The beta-angle is the angle between phase III and the descending segment of the capnogram, or the beginning of phase 0. The beta-angle is usually 90 degrees.1 The maximum concentration of CO2 at the end of the breath is designated as ETCO2. If measured in millimeters of mercury, it is designated as PetCO2. It is usually about 35 to 36 mm Hg and lower than PaCO2 by about 4 to 5 mm Hg. The difference between PetCO2 and PaCO2 represents alveolar dead space (PaCO2 − PetCO2).
Capnograms in Nonintubated Patients
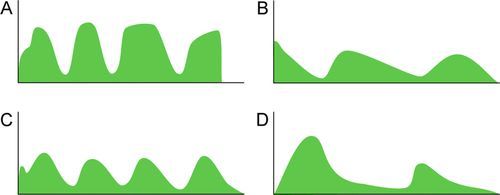
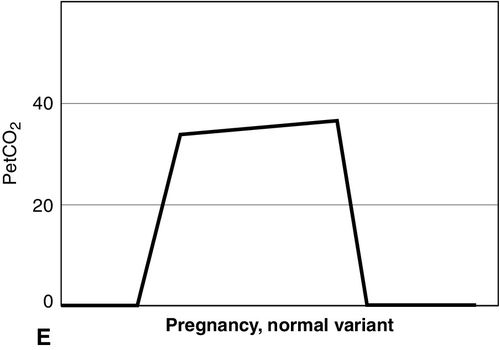
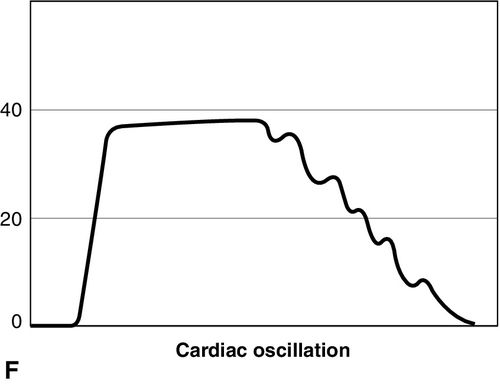
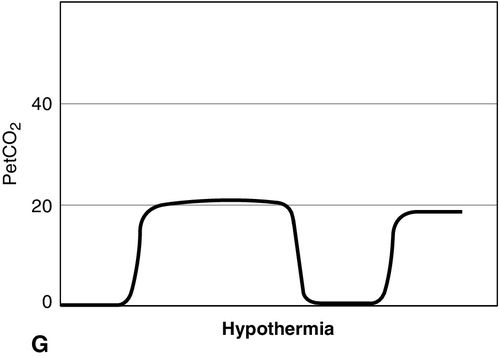
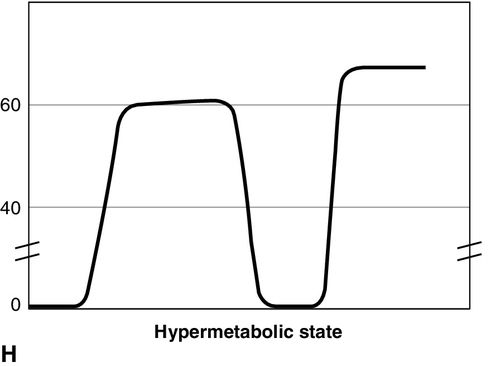
Distinct capnograms as described above may not be present in patients breathing spontaneously without an endotracheal tube. In the spontaneously breathing patient without an endotracheal tube, nasal sampling or sampling via a facemask may result in capnograms shown in Figure 8-6. These variations in shapes of capnograms are caused by the dilution of expiratory gases with atmospheric air or by supplemental oxygen administered via the mask. These capnograms can be considered normal variants in spontaneously breathing patients. Changes from baseline capnograms may reflect the effect of sedation on breathing.
Related posts:
 Hemodynamics of Sepsis
 Hemodynamic Management of Heart Failure and Cardiogenic Shock
 Hemodynamics of Mechanical Ventilation and Acute Respiratory Distress Syndrome
 Ultrasonography-Based Hemodynamic Monitoring
 Hemodynamic and Intracranial Dynamic Monitoring in Neurocritical Care
 Oxygenation and Acid–Base Balance Monitoring
Stay updated, free articles. Join our Telegram channel

Full access? Get Clinical Tree


