FIGURE 13.1 Possible causes of acute heart failure, indicated by the anatomic region involved. RV = right ventricle, LV = left ventricle.
Progressive Heart Failure
The changes in cardiac performance that occur in progressive stages of heart failure are shown in Figure 13.2. Three distinct stages are identified, and each is summarized below (using the corresponding numbers in Figure 13.2).
1. The earliest sign of ventricular dysfunction is an increase in cardiac filling pressure (i.e., the pulmonary artery wedge pressure). The stroke volume is maintained, but at the expense of the elevated filling pressure, which produces venous congestion in the lungs and the resulting sensation of dyspnea.
2. The next stage is marked by a decrease in stroke volume and an increase in heart rate. The tachycardia offsets the reduction in stroke volume, so the minute output of the heart (the cardiac output) is preserved.
3. The final stage is characterized by a decrease in cardiac output. and a further increase in the filling pressure. The point at which the cardiac output begins to fall marks the transition from compensated to decompensated heart failure.
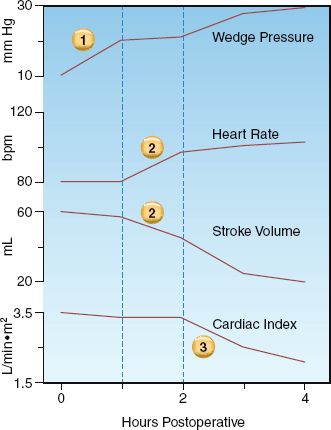
FIGURE 13.2 Changes in cardiac performance during progressive stages of left-sided heart failure in a postoperative patient. See text for further explanation.
Neurohumoral Responses
Heart failure triggers a multitude of endogenous responses, some beneficial and some counterproductive. The responses described here have the most clinical relevance (6).
Natriuretic Peptides
Increases in atrial and ventricular wall tension are accompanied by the release of four structurally similar natriuretic peptides from cardiac myocytes. These peptides “unload” the ventricles by promoting sodium excretion in the urine (which reduces ventricular preload) and dilating systemic blood vessels (which reduces ventricular preload and afterload). Natriuretic peptides also stimulate lipolysis in adipose tissue (7), but the relevance of this action is unclear. Natriuretic peptides play an important role in the evaluation of suspected heart failure, as described later in this section.
Sympathetic Nervous System
Decreases in stroke volume are sensed by baroreceptors in the carotid and pulmonary arteries, and activation of these receptors (through complex mechanisms) results in brainstem activation of the sympathetic nervous system. This occurs in the early stages of heart failure, and the principal results are positive inotropic and chronotropic effects in the heart, peripheral vasoconstriction, and activation of the renin-aldosterone-angiotensin system.
Renin-Angiotensin-Aldosterone System
Specialized cells in the renal arterioles release renin in response to renal hypoperfusion and adrenergic β-Receptor stimulation. Renin release has three consequences: the formation of angiotensin II, the production of aldosterone in the adrenal cortex, and the (angiotensin-triggered) release of arginine vasopressin from the posterior pituitary. Angiotensin produces systemic vasoconstriction, while aldosterone promotes renal sodium and water retention, and vasopressin promotes both vasoconstriction and renal water retention.
Activation of the renin-angiotensin-aldosterone (RAA) system is not fully developed until the advanced stages of heart failure (8), when the principal effects (i.e., vasoconstriction and renal retention of sodium and water) are counterproductive. One beneficial effect of RAA activation is the angiotensin-mediated constriction of arterioles on the efferent side of the glomerulus, which promotes glomerular filtration by increasing the filtration pressure across the glomerulus. The deleterious effects of the RAA system are confirmed by the beneficial effects of angiotensin converting enzyme (ACE) inhibitors in the treatment of heart failure (2).
B-Type Natriuretic Peptide
One of the natriuretic peptides described earlier, brain-type or B-type natriuretic peptide (BNP), is released as a precursor or prohormone (proBNP) from both ventricles in response to increased wall tension. The prohormone is cleaved to form BNP (the active hormone) and N-terminal (NT)-proBNP, which is metabolically inactive. The clearance of BNP and NT-proBNP is primarily via the kidneys. Peptide receptors in adipose tissue also contribute to BNP clearance (7), which might explain why plasma BNP levels are inversely related to body mass index (BMI) (8). NT-proBNP has a longer half-life than BNP, resulting in plasma levels that are 3–5 times higher than BNP levels.
Clinical Use
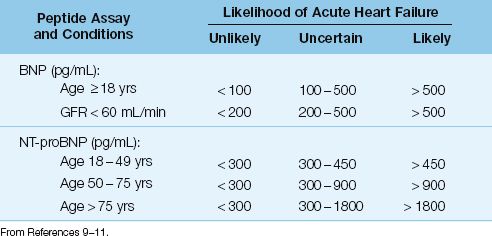
Plasma levels of both BNP and NT-proBNP are used as biomarkers for evaluating the presence and severity of heart failure (4). The predictive value of BNP and NT-proBNP levels for detecting heart failure is shown in Table 13.1 (9–11). As indicated, advancing age and renal insufficiency can also elevate natriuretic peptide levels. Severe sepsis also elevates natriuretic peptide levels, and the magnitude of the elevation can be as great as in heart failure (12). Because elevated peptide levels lack specificity, natriuretic peptide levels are better suited for excluding the presence of heart failure (4).
Table 13.1 Predictive Value of Natriuretic Peptide in the Evaluation of Suspected Acute Heart Failure
Role in the ICU
Natriuretic peptide levels are most useful in the emergency department, for evaluating patients with suspected heart failure. For patients with heart failure that are admitted to the ICU, the use of serial measurements of natriuretic peptide levels to evaluate the response to therapy has not been studied. However, spurious elevations in natriuretic peptide levels from renal insufficiency and severe sepsis are likely to be commonplace in critically ill patients, and thus it seems unlikely that natriuretic peptide levels will have a clinical role in the ICU setting.
TYPES OF HEART FAILURE
As mentioned earlier, heart failure can be classified by the portion of the cardiac cycle that is affected (systolic and diastolic heart failure) and the side of the heart that is involved (left-sided and right-sided heart failure). These distinctions are the focus of this section of the chapter.
Systolic vs. Diastolic Heart Failure
Early descriptions of heart failure attributed most cases to contractile failure during systole (i.e., systolic heart failure). However, observations over the past 30 years indicate that diastolic dysfunction is responsible for up to 60% of cases of heart failure (2). The hallmark of diastolic heart failure is a decrease in ventricular distensibility with impaired ventricular filling during diastole (13). Common causes of diastolic heart failure include ventricular hypertrophy, myocardial ischemia (stunned myocardium), restrictive or fibrotic cardiomyopathy, and pericardial tamponade. Additional sources of impaired diastolic filling in ICU patients are positive-pressure ventilation and positive end-expiratory pressure (PEEP).
Cardiac Performance
The graphs in Figure 13.3 show the influence of systolic and diastolic dysfunction on measures of cardiac performance in decompensated heart failure. The upper graph shows the relationship between end-diastolic pressure and stroke volume (similar to the graph in Figure 9.2) The curve representing heart failure has a decreased slope, and the point on the curve indicates that heart failure is associated with an increase in end-diastolic pressure and a decrease in stroke volume (similar to stage 2 and stage 3 in Figure 13.2). The lower graph shows the relationship between end-diastolic pressure and end-diastolic volume. The curve representing diastolic dysfunction has a decreased slope, which reflects a decrease in ventricular compliance (distensibility) according to the following relationship:
 (13.1)
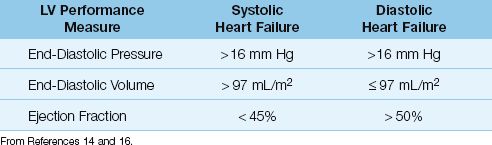
The points on the ventricular compliance curves indicate that the in-crease in end-diastolic pressure in heart failure is associated with different end-diastolic volumes with systolic and diastolic dysfunction; i.e., systolic dysfunction results in an increase in end-diastolic volume, and diastolic dysfunction results in a decrease in end-diastolic volume. Therefore, the end-diastolic volume (not the end-diastolic pressure) can distinguish between systolic and diastolic dysfunction in patients with heart failure. This is evident in the diagnostic criteria shown in Table 13.2, where a left ventricular end-diastolic volume of 97 mL/m2 (measured relative to body surface area in m2) is the threshold value for identifying systolic vs. diastolic dysfunction as the cause of heart failure (14).
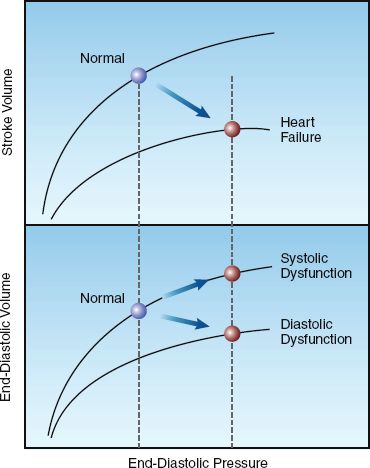
FIGURE 13.3 Graphs showing the influence of systolic and diastolic dysfunction on measures of cardiac performance in decompensated heart failure. Lower panel shows diastolic pressure-volume curves, and upper panel shows ventricular function curves. See text for further explanation
Table 13.2 Measures of Left Ventricular (LV) Performance in Systolic and Diastolic Heart Failure
Ejection Fraction
The fraction of the end-diastolic volume that is ejected during systole, known as the ejection fraction (EF), is equivalent to the ratio of stroke volume to end-diastolic volume (EDV):
 (13.2)
The EF is directly related to the strength of ventricular contraction, and is used a measure of systolic function. The normal EF of the left ventricle is ≥55% (15,16), but lower values of 45–50% are used as normal in the evaluation of heart failure because increases in afterload can reduce EF by 5 to 10% (16). As shown in Table 13.2, an EF>50% is used as evidence of normal systolic function, and an EF<45% is used as evidence of abnormal systolic function (14,16). Transthoracic ultrasound is an accepted method for measuring EF, and can be performed at the bedside in the ICU.
TERMINOLOGY: Because many cases of heart failure have some degree of systolic and diastolic dysfunction, the terms “diastolic heart failure” and “systolic heart failure” have been replaced by the following terminology:
1. Heart failure that is predominantly the result of systolic dysfunction is called heart failure with reduced ejection fraction.
2. Heart failure that is predominantly the result of diastolic dysfunction is called heart failure with normal ejection fraction.
Because this newer terminology is lengthy and probably not necessary, the terms “diastolic heart failure” and “systolic heart failure” are used in this chapter, and throughout the book.
Right Heart Failure
Right-sided heart failure is more prevalent than suspected in ICU pa-tients (17), and can be difficult to detect in the early stages. Most cases are the result of pulmonary hypertension (e.g., from pulmonary emboli or chronic lung disease) and inferior wall myocardial infarction.
Cardiac Filling Pressures
Acute right heart failure is a contractile (systolic) failure that results in an increase in right ventricular end-diastolic volume (RVEDV). However, the central venous pressure (CVP) does not rise until the increase in RVEDV is restricted by the pericardium (pericardial constraint) (17). The delayed rise in the CVP is one of the reasons that the early stages of right heart failure are often undetected. The following hemodynamic criteria have been proposed for the diagnosis of right heart failure (18): CVP >10 mm Hg and CVP = PAWP or CVP within 5 mm Hg of PAWP. (PAWP is the pulmonary artery wedge pressure.) Equalization of right and left ventricular filling pressures is also characteristic of cardiac tamponade, and this similarity shows the importance of pericardial constraint in right heart failure.
INTERVENTRICULAR INTERDEPENDENCE: Because of pericardial constraint, progressive distension of the right ventricle pushes the interventricular septum towards the left ventricle and reduces the size of the left ventricular chamber, as shown in Figure 13.4. This septal displacement impairs left ventricular filling and increases the left ventricular end-diastolic pressure. In this situation, the filling pressures of both ventricles “equilibrate” to produce equalization of pressures, as indicated by the diastolic pressures in the right and left ventricle in Figure 13.4. This mechanism whereby right-sided heart failure can produce diastolic dysfunction in the left ventricle is known as interventricular interdependence.
Echocardiography
Cardiac ultrasound is an invaluable tool for detecting right heart failure in the ICU. The variety of measurements used to evaluate the right heart is beyond the scope of this chapter, and the most recent guidelines on this subject are included in the bibliography at the end of the chapter (Ref-erence 19). The diameter of the right ventricular chamber is a popular measurement to identify right heart dilatation. Measurements of right ventricular end-diastolic volume and ejection fraction require 3-dimensional echocardiography, and validation studies are currently ongoing to determine reliable reference ranges (19). The lower limit of normal for right ventricular ejection fraction is currently set at 44% (19).
MANAGEMENT STRATEGIES
The management of acute heart failure described here is limited to the advanced stages of heart failure, where cardiac output is impaired and the perfusion of vital organs is threatened. The management is described using measures of cardiac performance rather than symptomatology, and most of the drugs are administered by continuous intravenous infusion.
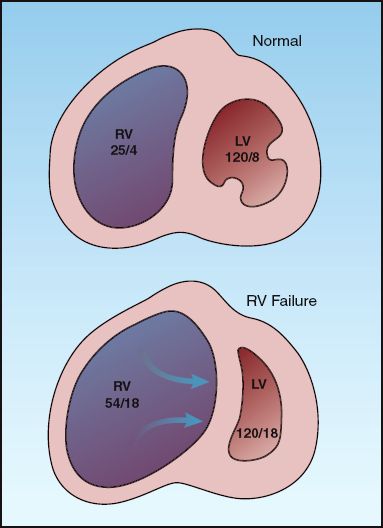
FIGURE 13.4 Interventricular interdependence: i.e., the mechanism whereby right heart failure can impair left ventricular filling and produce diastolic left-heart failure. The numbers in each chamber represent the peak systolic and end-diastolic pressures. RV = right ventricle; LV = left ventricle.
Left Heart Failure
The following management pertains to non-valvular heart failure resulting from systolic or diastolic dysfunction, where the hemodynamic changes are characterized by an increased pulmonary artery wedge pressure (PAWP), a decreased cardiac output (CO), and an increased systemic vascular resistance (SVR). Three approaches are described, based on the blood pressure ( i.e., high, normal, and low).
Profile: High PAWP /Low CO /High SVR /High BP.
Management: Vasodilator therapy with nitroglycerin, nitroprusside, or nesiritide, followed by diuretic therapy with furosemide if there is evidence of volume overload, or if the PAWP remains above 20 mm Hg despite vasodilator therapy.
The dosing regimens for continuous-infusion vasodilator therapy are shown in Table 13.3 (21). The vasodilators in this table are capable of dilating both arteries and veins, and will decrease both ventricular preload and afterload. The decrease in preload reduces venous congestion in the lungs, and the decrease in afterload promotes cardiac output. The overall effect is a decrease in arterial blood pressure, an increase in cardiac output, and a decrease in hydrostatic pressure in the pulmonary capillaries.
Table 13.3 Dosing Regimens for Continuous-Infusion Vasodilator Therapy
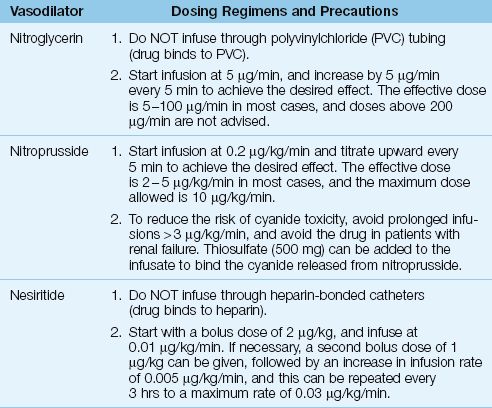
NITROPRUSSIDE: The vasodilating effects of nitroprusside are the result of nitric oxide release from the nitroprusside molecule. Unfortunately, cyanide ions are also released (5 atoms per molecule) and accumulation of these ions can produce life-threatening cyanide intoxication (22,23). Both the liver and kidneys participate in cyanide clearance, and thus nitroprusside is not recommended in patients with renal or hepatic insufficiency. Thiosulfate binds cyanide and reduces the risk of cyanide toxicity (23), and sodium thiosulfate can be added to nitroprusside infusions as a preventive measure (see Table 13.3). A detailed description of nitroprusside-induced cyanide intoxication is included in Chapter 53.
Nitroprusside has an additional risk in patients with ischemic heart disease because it can produce a coronary steal syndrome by diverting blood flow away from non-dilating blood vessels in ischemic regions of the myocardium (24). Because of this risk, nitroprusside is not recommended in patients with ischemic heart disease.
NITROGLYCERIN: Nitroglycerin is a “nitric oxide” vasodilator like nitroprusside, but is a much safer drug to use. Nitrate ions released during nitroglycerin metabolism can oxidize hemoglobin to form methemoglobin, but clinically significant methemoglobinemia is rare during therapeutic nitroglycerin infusions (25). The major drawback with nitroglycerin infusions is tachyphylaxis, which can appear after 16 to 24 hours of continuous drug administration (24). (See Chapter 53 for more information on nitroglycerin.)
NESIRITIDE: Nesiritide (Natrecor) is a recombinant human B-type natriuretic peptide with the same natriuretic and vasodilator effects as the endogenous BNP described earlier in the chapter. Although nesiritide has a potential advantage over other vasodilators by promoting diuresis as well as vasodilation, clinical studies have shown no benefit associated with nesiritide treatment of acute, decompensated heart failure (26). Early concerns about worsening renal function with nesiritide have not been confirmed in more recent studies (26).
WHICH AGENT IS PREFERRED?: Nitroglycerin should be the preferred vasodilator, particularly in patients with coronary artery disease. Nitroprusside is contraindicated in the presence of myocardial ischemia, and is not advised in patients with hepatic or renal insufficiency. Nitro-prusside is most suited for the short-term management of hypertensive crisis, but infusion rates should not exceed 3∝g/kg/min to limit the risk of cyanide toxicity. Nesiritide is not currently recommended for the routine management of acute heart failure.
DIURETICS: Diuretic therapy with intravenous furosemide is indicated only if vasodilator therapy does not reduce the wedge pressure to the desired level, or there is evidence of volume overload (e.g., recent weight gain). Intravenous furosemide produces an acute vasoconstrictor response (27) by stimulating renin release and promoting the formation of angiotensin II, a potent vasoconstrictor. Because this response is counterproductive in the setting of hypertension, furosemide administration should be delayed until the blood pressure is controlled with vasodilator therapy.
The desired wedge pressure in left heart failure is the highest pressure that will augment cardiac output without producing pulmonary edema. This pressure usually corresponds to a wedge pressure of 18 to 20 mm Hg (28). Therefore, diuretic therapy can be added if the wedge pressure remains above 20 mm Hg during vasodilator therapy. The features of diuretic therapy for decompensated heart failure are described later.
Normal Blood Pressure
Decompensated heart failure with a normal blood pressure is a common presentation of acute exacerbation of chronic heart failure, and can involve diastolic and/or systolic dysfunction.
Profile: High PAWP /Low CO /High SVR /Normal BP.
Treatment: Vasodilator therapy, if tolerated, or inodilator therapy with dobutamine, milrinone, or levosimendan. Add diuretic therapy with furosemide for volume overload, or for a persistent PAWP above 20 mm Hg.
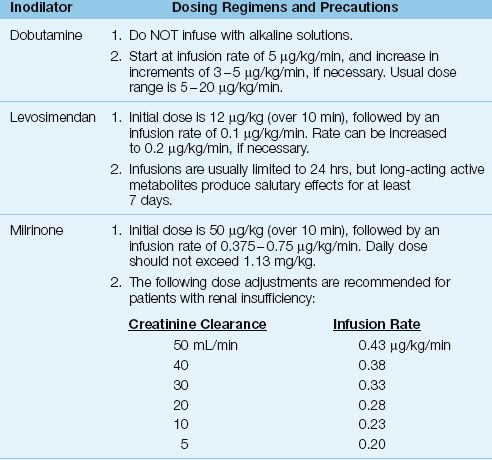
Vasodilator therapy (usually with nitroglycerin) is preferred for treating normotensive heart failure because it avoids unwanted cardiac stimulation, but vasodilator use is limited by the risk of hypotension. When vasodilator therapy is not feasible, the next choice is the use of inodilators; i.e., drugs with positive inotropic and vasodilator actions. These drugs also have positive lusitropic actions; i.e., they promote myocardial relaxation and improve diastolic filling. The inodilators given by continuous infusion are shown in Table 13.4, along with the dosing recommendations for each drug.
DOBUTAMINE: Dobutamine is a potent β1-receptor agonist and a weak β2-receptor agonist: the β1 stimulation produces positive inotropic, lusitropic and chronotropic effects, and the β2 stimulation produces peripheral vasodilatation. The effect of dobutamine on cardiac performance is described in Chapter 53 (see Figure 53.1). Adverse effects of dobutamine include tachycardia and an increase in myocardial O2 consumption (29); this latter effect is deleterious in the ischemic myocardium (where oxygen supply is impaired) and in the failing myocardium (where O2 consumption is already increased).
MILRINONE: Milrinone is a phosphodiesterase inhibitor that enhances myocardial contractility and relaxation via the same mechanism as dobutamine (i.e., cyclic AMP-mediated calcium influx into cardiac myocytes). Milrinone has similar effects on cardiac performance as dobutamine, but is more likely to produce hypotension (29). The dosage of milrinone requires adjustment in renal insufficiency, as indicated in Table 13.4 (30).
LEVOSIMENDAN: Levosimendan (Simdax, Abbot Pharmaceuticals) increases cardiac contractility by sensitizing cardiac myofilaments to calcium (31), and promotes vasodilation by facilitating potassium influx into vascular smooth muscle (32). This drug is particularly appealing in patients with coronary artery disease because it dilates coronary arteries and does not stimulate myocardial O2 consumption; animal studies have confirmed the drug’s ability to protect the myocardium from ischemic injury (32). Infusions of levosimendan are usually limited to 24 hours, but long-acting active metabolites (which peak at 72 hours after the onset of therapy) produce salutary effects that last for at least 7 days (see Figure 13.5) (33).
Table 13.4 Dosing Regimens for Continuous-Infusion Inodilator Therapy
WHICH INODILATOR IS PREFERRED?: Levosimendan is emerging as the preferred inodilator, particularly in the setting of myocardial ischemia or infarction, and is the only inodilator that is associated with improved survival (34). The benefit of levosimendan over dobutamine in reducing plasma BNP levels is demonstrated in Figure 13.5 (36). Dobutamine is the least favored inodilator because of the deleterious effects of adrenergic stimulation in the failing heart.
DIURETICS: The indications for diuretic therapy with furosemide are the same as those described for heart failure with high blood pressure.
Low Blood Pressure
Acute heart failure accompanied by hypotension is a life-threatening condition that often represents cardiogenic shock (when accompanied by an elevated serum lactate level). This condition is most often the result of acute myocardial infarction.
Profile: High PAWP /Low CO/High SVR /Low BP.
Treatment: Dobutamine or vasoconstrictor therapy with dopamine, combined with mechanical cardiac support.
Dobutamine can sometimes increase blood pressure (when the increase in stroke volume is greater than the decrease in systemic vascular resistance); otherwise a vasoconstrictor drug is required to raise the blood pressure. Since systemic vasoconstriction is a prominent feature of cardiogenic shock, drug-induced vasoconstriction can further aggravate tissue hypoperfusion. To limit this risk, a vasoconstrictor drug that also promotes cardiac output is the favored choice in cardiogenic shock. Dopamine is such a drug, when given in the appropriate dose range.
DOPAMINE: Dopamine stimulates both cardiac β-receptors (which promotes cardiac output) and peripheral β-receptors (which promotes systemic vasoconstriction). In moderate doses (3–10 ∝g/kg/min), the β-receptor effect predominates, while in higher doses (>10 ∝g/kg/min), α-receptor stimulation predominates. At dose rates of 5–15 ∝g/kg/min, dopamine can promote cardiac output and produce systemic vasoconstriction (29). Therefore dopamine infusion at a rate of 5–15 ∝g/kg/min is a reasonable choice in the management of cardiogenic shock. (See Chapter 53 for a more detailed description of dopamine.)
The mortality rate in cardiogenic shock remains high (about 80%) with the use of hemodynamic drugs alone, and other measures, such as mechanical cardiac support and coronary revascularization, are required to improve outcomes. Mechanical cardiac support using intra-aortic balloon counterpulsation is described later in the chapter.
Diuretic Therapy
Diuretic therapy is a cornerstone of management for chronic heart failure. However, the following observations indicate that diuretic therapy with intravenous furosemide should be used cautiously in patients with acute, decompensated heart failure.
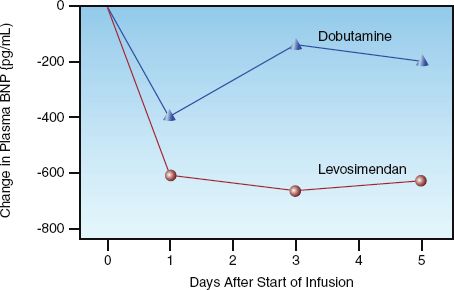
FIGURE 13.5 Changes in plasma BNP levels associated with short-term (24 hr) infusions of dobutamine and levosimendan in patients with acute decompensated heart failure. Graph redrawn from Reference 35.
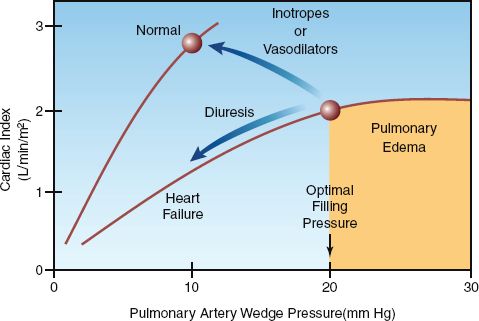
FIGURE 13.6 Ventricular function curves for the normal and failing left ventricle with arrows indicating the expected changes associated with each type of drug therapy. The shaded area indicates the high-risk region for pulmonary edema.
1. Intravenous furosemide causes a decrease in cardiac output in acute heart failure (36–38), as indicated in Figure 13.6. This effect is the result of a decrease in venous return and an increase in left ventricular afterload; the latter effect is due to the acute vasoconstrictor response to furosemide mentioned earlier (31).
2. The presence of pulmonary edema in acute heart failure is NOT evidence of excess extracellular volume, and could be the result of an acute increase in PAWP from diastolic dysfunction (as seen in the “flash pulmonary edema” produced by ischemic myocardial “stunning”).
In light of these observations, diuretic therapy with intravenous furosemide should only be used when there is evidence of hypervolemia (such as recent weight gain or peripheral edema), or when the PAWP remains elevated (>20 mm Hg) despite vasodilator or inodilator therapy. Furthermore, intravenous furosemide should never be used alone in the treatment of heart failure associated with a low cardiac output, and should always be combined with vasodilator or inodilator therapy.
Furosemide Dosing
The salient features of conventional furosemide dosing are summarized below.
1. Furosemide is a sulfonamide, but can be used safely in patients with an allergy to sulfonamide antibiotics (39).
2. Following an intravenous bolus dose of furosemide, diuresis begins within 15 minutes, peaks at one hour, and lasts 2 hours (when renal function is normal) (40).
3. For patients with normal renal function, the initial furosemide dose is 40 mg IV. If the diuresis is not adequate (at least 1 liter) after 2 hours, the dose is increased to 80 mg IV. The dose that produces a satisfactory response is then given twice daily. Failure to respond to an IV dose of 80 mg is evidence of diuretic resistance, and is managed as described in the next section.
4. For patients with renal insufficiency, the initial furosemide dose should be 100 mg IV, which can be increased to 200 mg IV if necessary. The dose that produces a satisfactory response is then given twice daily. Failure to respond to an IV dose of 200 mg is evidence of diuretic resistance.
5. The goal of diuresis is a minimum weight loss of 5–10% of body weight (41).
Diuretic Resistance
Critically ill patients can have an attenuated response to loop diuretics like furosemide, particularly with continued use. Several factors may be involved, including rebound sodium retention, reduced renal blood flow, and “diuretic braking” (i.e., decreased responsiveness as hypervolemia resolves) (42). When the diuretic response to furosemide is inadequate, responsiveness can be enhanced as follows.
ADD A THIAZIDE: Thiazide diuretics block sodium reabsorption in the distal renal tubules, and can enhance the diuretic response to furosemide (which blocks sodium reabsorption in the loop of Henle). The thiazide most favored in furosemide resistance is metolazone because it retains its efficacy in renal insufficiency (42). The dose of metolazone is 2.5–10 mg daily in a single oral dose (the drug is only available as an oral preparation). The response to metolazone begins at one hour and peaks at 9 hours, so a single dose of metolazone should be given hours before furosemide, to allow time for effective blockade of sodium reabsorption in the distal tubules.
CONTINUOUS INFUSION FUROSEMIDE: Because the diuretic effect of furosemide is a function of the urinary excretion rate and not the plasma concentration (43), continuous infusions of the drug often (but not always) produce a more vigorous diuresis than bolus injection. The dosing regimen for continuous-infusion furosemide is influenced by renal function, as shown below (41,42):
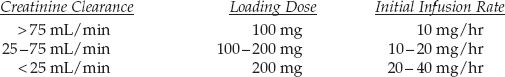
The infusion rate can be increased as needed to achieve the desired urine output (e.g., ≥100 mL/hr). The maximum recommended infusion rate is 240–360 mg/hr (42), or 170 mg/hr in elderly patients (44).
Right Heart Failure
The following recommendations pertain to the management of infarction-related right heart failure associated with hemodynamic instability. These recommendations are based on measurements of the pulmonary artery wedge pressure (PAWP) or the right ventricular end-diastolic volume (RVEDV).
1. If the PAWP is below 15 mm Hg, infuse volume until the PAWP or CVP increases by 5 mm Hg or either one reaches 20 mm Hg (45).
2. If the PAWP or CVP is above 15 mm Hg, start inodilator therapy with dobutamine (47) or levosimendan (48).
4. For AV dissociation or complete heart block, use sequential A-V pacing and avoid ventricular pacing (45).
Volume infusion is the mainstay of therapy for right-sided heart failure with hemodynamic instability, but it must be carefully monitored to avoid septal displacement and compromised left ventricular filling, as described earlier (see Fig. 13.4). An increase in either the PAWP (indicating septal displacement) or the CVP (indicating pericardial constraint) can therefore be used as end-points of volume infusion in right heart failure. If volume infusion is not feasible or does not correct the hemodynamic instability, inodilator therapy (with dobutamine or levosimendan) is preferred to vasodilator infusions(47).
MECHANICAL CARDIAC SUPPORT
Intra-Aortic Balloon Counterpulsation
Intra-aortic balloon counterpulsation is used for temporary cardiac support in cases of unstable angina or cardiogenic shock where cardiac pump function is expected to improve as a result of some intervention; i.e., coronary angioplasty or coronary artery bypass surgery (49). This technique is contraindicated in patients with aortic valve insufficiency and aortic dissection.
Methodology
The intra-aortic balloon is an elongated polyurethane balloon that is inserted percutaneously into the femoral artery and advanced up the aorta until the tip lies just below the origin of the left subclavian artery (see Figure 13.7). A pump attached to the balloon uses helium, a low density gas, to rapidly inflate and deflate the balloon (inflation volume is generally 35 to 40 mL). Inflation begins at the onset of diastole, just after the aortic valve closes (the R wave on the ECG is a common trigger). The balloon is then deflated at the onset of ventricular systole, just before the aortic valve opens (during isovolumic contraction). This pattern of balloon inflation and deflation produces two changes in the aortic pressure waveform, which are illustrated in Figure 13.7.
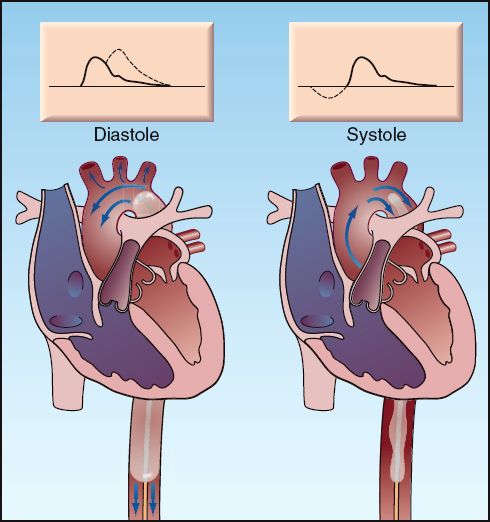
FIGURE 13.7 Intra-aortic balloon counterpulsation showing balloon inflation during diastole (left panel), and balloon deflation during systole (right panel). The arrows indicate the direction of blood flow. The effects on the aortic pressure waveform are indicated by the dotted lines on the waveforms at the top of each panel.
1. Inflation of the balloon during diastole increases the peak diastolic pressure and thereby increases the mean arterial pressure (which is equivalent to the integrated pressure under the aortic pressure curve). The increase in mean arterial pressure increases systemic blood flow, while the increase in diastolic pressure augments coronary blood flow (which occurs predominantly during diastole).
2. Deflation of the balloon creates a suction effect that reduces pressure in the aorta when the aortic valve opens, and this reduces the impedance to flow and augments ventricular stroke output.
The intra-aortic balloon pump (IABP) therefore promotes systemic blood flow by increasing mean arterial pressure and reducing ventricular afterload, while also increasing coronary blood flow. This latter effect, combined with the reduced ventricular afterload, improves the balance between O2 delivery and O2 consumption in the myocardium (50).
Complications
The principal concern with IABP support is vascular injury. Limb ischemia is reported in 3% to 20% of patients (49,51), and can appear while the balloon is in place or shortly after balloon removal. Most cases are the result of in-situ thrombosis at the catheter insertion site, but aortic dissection and aortoiliac injury may also be responsible.
The risk of limb ischemia mandates close monitoring of distal pulses and sensorimotor function in the legs. Loss of distal pulses alone does not warrant removal of the balloon as long as sensorimotor function in the legs is intact (52). Loss of sensorimotor function in the legs should always prompt immediate removal of the device. Surgical intervention is required in 30 to 50% of cases of limb ischemia (52).
Other complications of IABP support include catheter-related infection, balloon rupture, peripheral neuropathy, and pseudoaneurysm. Fever is reported in 50% of patients during IABP support, but bacteremia is reported in only 15% of patients (53).
Positive Pressure Breathing
As described in Chapter 9, positive intrathoracic pressure reduces left ventricular afterload by decreasing the transmural wall pressure developed by the ventricle during systole. This promotes ventricular emptying by facilitating the inward movement of the ventricular wall during systole. As a result, positive pressure breathing can augment the stroke output of the left ventricle (see Figure 9.8).
Clinical studies have demonstrated that breathing with continuous positive airway pressure (CPAP) reduces left ventricular transmural pressure (54) and, increases cardiac output (55) in patients with left-sided heart failure. Furthermore, in patients with cardiogenic pulmonary edema, CPAP hastens clinical improvement when added to conventional therapy for acute heart failure (56,57). As a result of these observations, CPAP (along with non-invasive pressure support ventilation) has emerged as a treatment modality for acute heart failure associated with pulmonary edema.
A FINAL WORD
The management of acute heart failure suffers from the following shortcomings:
1. Despite the increasing prevalence and poor prognosis associated with acute, decompensated heart failure, the management of this condition has changed very little in the last 10 to 15 years.
2. The treatment of heart failure is actually treating the consequences of heart failure (e.g., pulmonary venous congestion) and has little impact on the functional derangements in the myocytes. (Coronary revascularization is an exception to this rule.)
3. Many of the drug therapies for acute heart failure produce effects that are counterproductive (e.g., diuretics reduce cardiac output, which promotes sodium retention, vasodilators stimulate renin release, which results in vasoconstriction).
While these shortcomings are not unique to heart failure, they are more evident because of the prominence of cardiovascular disease as the leading cause of death in this country.
References
Guidelines and Reviews
1. Roger V, Go AS, Lloyd-Jones D, et al. Heart disease and stroke statistics – 2012 update: a report from the American Heart Association. Circulation 2012; 125:e2–e220.
2. Hunt SA, Abraham WT, Chin MH, Feldman AM, et al. 2009 focused update incorporated into the ACC/AHA 2005 guidelines for the diagnosis and management of heart failure in adults: a report of the American College of Cardiology Foundation/ American Heart Association Task Force on Practice Guidelines. Circulation 2009; 119:e391–e479.
3. Gheorghiade M, Pang PS. Acute heart failure syndromes. J Am Coll Cardiol 2009; 53:557–573.
4. Weintraub NL, Collins SP, Pang PS, et al. Acute heart failure syndromes: emergency department presentation, treatment, and disposition: current approaches and future aims: a scientific statement from the American Heart Association. Circulation 2010; 122:1975–1996.
5. Task Force for the Diagnosis and Treatment of Acute and Chronic Heart Failure 2012 of the European Society of Cardiology. ESC guidelines for the diagnosis and treatment of acute and chronic heart failure 2012. Eur Heart J 2012; 33:1787–1847.
Pathophysiology
6. Mann DL. Pathophysiology of heart failure. In: Libby P, Bonow RO, Mann DL, Zipes DP, eds. Braunwald’s Heart Disease. 8th ed. Philadelphia: Saunders Elsevier, 2008:541–560.
7. Wang TJ. The natriuretic peptides and fat metabolism. N Engl J Med 2012; 367:377–378.
8. McCord J, Mundy BJ, Hudson MP, et al. Relationship between obesity and B-type natriuretic peptide levels. Arch Intern Med 2004; 164:2247–2252.
9. Maisel AS, Krishnaswamy P, Nomak RM, et al. Rapid measurement of B-type natriuretic peptide in the emergency diagnosis of heart failure. New Engl J Med 2002; 347:161–167.
10. Maisel AS, McCord J, Nowak J, et al. Bedside B-type natriuretic peptide in the emergency diagnosis of heart failure with reduced or preserved ejection fraction. Results from the Breathing Not Properly Multinational Study. J Am Coll Cardiol 2003; 41:2010–2017.
11. Januzzi JL, van Kimmenade R, Lainchbury J, et al. NT-proBNP testing for diagnosis and short-term prognosis in acute destabilized heart failure: an international pooled analysis of 1256 patients. Europ Heart J 2006; 27:330–337.
12. Rudiger A, Gasser S, Fischler M, et al. Comparable increase of B-type natriuretic peptide and amino-terminal pro-B-type natriuretic peptide levels in patients with severe sepsis, septic shock, and acute heart failure. Crit Care Med 2006; 34:2140–2144.
Types of Heart Failure
13. Zile MR, Baicu CF, Gaasch WH. Diastolic heart failure – Abnormalities in active relaxation and passive stiffness of the left ventricle. New Engl J Med 2004; 350:1953–1959.
14. Paulus WJ, Tschope C, Sanderson JE, et al. How to diagnose diastolic heart failure: a consensus statement on the diagnosis of heart failure with normal left ventricular ejection fraction by the Heart Failure and Echocardiography Associations of the European Society of Cardiology. Europ Heart J 2007; 28:2539–2550.
15. Lang RM, Bierig M, Devereux RB, et al. Recommendations for chamber quantification: a report from the American Society of Echocardiography and the European Association of Echocardiography. J Am Soc Echocardiogr 2005; 18:1440–1463.
16. Hess OM, Carroll JD. Clinical assessment of heart failure. In: Libby P, Bonow RO, Mann DL, Zipes DP, eds. Braunwald’s Heart Disease. 8th ed. Philadelphia: Saunders Elsevier, 2008:561–581.
17. Hurford WE, Zapol WM. The right ventricle and critical illness: a review of anatomy, physiology, and clinical evaluation of its function. Intensive Care Med 1988; 14:448–457.
18. Lopez-Sendon J, Coma-Canella I, Gamello C. Sensitivity and specificity of hemodynamic criteria in the diagnosis of right ventricular infarction. Circulation 1981; 64:515–525.
19. Rudski LG, Lai WW, Afilalo J, et al. Guidelines for the echocardiographic assessment of the right heart in adults: A report from the American Society of Echocardiography. J Am Soc Echocardiogr 2010; 23:685–713.
Management Strategies
20. Flaherty JT, Magee PA, Gardner TL, et al. Comparison of intravenous nitroglycerin and sodium nitroprusside for treatment of acute hypertension developing after coronary artery bypass surgery. Circulation 1982; 65:1072–1077
21. Rhoney D, Peacock WF. Intravenous therapy for hypertensive emergencies, part 1. Am J Health Syst Pharm 2009; 66:1343–1352.
22. Sodium Nitroprusside. In: McEvoy GK, ed. AHFS Drug Information, 2012. Bethesda, MD: American Society of Health System Pharmacists, 2012:1811–1814.
23. Hall VA, Guest JM. Sodium nitroprusside-induced cyanide intoxication and prevention with sodium thiosulfate prophylaxis. Am J Crit Care 1992; 2:19–27.
24. Mann T, Cohn PF, Holman LB, et al. Effect of nitroprusside on regional myocardial blood flow in coronary artery disease. Results in 25 patients and comparison with nitroglycerin. Circulation 1978; 57:732–738.
25. Curry SC, Arnold-Cappell P. Nitroprusside, nitroglycerin, and angiotensin- converting enzyme inhibitors. Crit Care Clin 1991; 7:555–582.
26. O’Connor CM, Starling RC, Hernanadez PW, et al. Effect of nesiritide in pa-tients with acute decompensated heart failure. N Engl J Med 2011; 365:32–43.
27. Francis GS, Siegel RM, Goldsmith SR, et al. Acute vasoconstrictor response to intravenous furosemide in patients with chronic congestive heart failure. Ann Intern Med 1986; 103:1–6.
28. Franciosa JA. Optimal left heart filling pressure during nitroprusside infusion for congestive heart failure. Am J Med 1983; 74:457–464.
29. Bayram M, De Luca L, Massie B, Gheorghiade M. Reassessment of dobutamine, dopamine, and milrinone in the management of acute heart failure syndromes. Am J Cardiol 2005; 96(Suppl): 47G–58G.
30. Milrinone Lactate. In: McEvoy GK, ed. AHFS Drug Information, 2012. Bethesda, MD: American Society of Health System Pharmacists, 2012:1724–1726.
31. Gheorghiade M, Teerlionk JR, Mebazaa A. Pharmacology of new agents for acute heart failure syndromes. Am J Cardiol 2005; 96(Suppl):68G–73G.
32. Kersten JR, Montgomery MW, Pagel PL, Waltier DC. Levosimendan, a new positive inotropic drug, decreases myocardial infarct size via activation of K(ATP) channels. Anesth Analg 2000; 90:5–11.
33. Antila S, Sundberg S, Lehtonen LA. Clinical pharmacology of levosimendan. Clin Pharmacokinet 2007; 46:535–552.
34. Landoni G, Biondi-Zoccai G, Greco M, et al. Effects of levosimendan on mortality and hospitalization: a meta-analysis of randomized, controlled studies. Crit Care Med 2012; 40:634–636.
35. Mebazza A, Niemenen MS, Packer M, et al. Levosimendan vs dobutamine for patients with acute decompensated heart failure: the SURVIVE randomized trial. JAMA 2007; 297:1883–1891.
Diuretic Therapy
36. Kiely J, Kelly DT, Taylor DR, Pitt B. The role of furosemide in the treatment of left ventricular dysfunction associated with acute myocardial infarction. Circulation 1973; 58:581–587.
37. Mond H, Hunt D, Sloman G. Haemodynamic effects of frusemide in patients suspected of having acute myocardial infarction. Br Heart J 1974; 36:44–53.
38. Nelson GIC, Ahuja RC, Silke B, et al. Haemodynamic advantages of isosorbide dinitrate over frusemide in acute heart failure following myocardial infarction. Lancet 1983a; i:730–733.
39. Strom BL, Schinnar R, Apter AJ, et al. Absence of cross-reactivity between sulfonamide antibiotics and sulfonamide nonantibiotics. N Engl J Med 2003; 349:1628–1635.
40. Furosemide. In: McEvoy GK, ed. AHFS Drug Information, 2012. Bethesda, MD: American Society of Health System Pharmacists, 2012:2792–2796.
41. Jenkins PG. Diuretic strategies in acute heart failure. N Engl J Med 2011; 364:21.
42. Asare K, Lindsey K. Management of loop diuretic resistance in the intensive care unit. Am J Health Syst Pharm 2009; 66:1635–1640.
43. van Meyel JJM, Smits P, Russell FGM, et al. Diuretic efficiency of furosemide during continuous administration versus bolus injection in healthy volunteers. Clin Pharmacol Ther 1992; 51:440–444.
44. Howard PA, Dunn MI. Aggressive diuresis for severe heart failure in the elderly. Chest 2001; 119:807–810.
Right Heart Failure
45. Isner JM. Right ventricular myocardial infarction. JAMA 1988; 259:712–718.
46. Reuse C, Vincent JL, Pinsky MR. Measurement of right ventricular volumes during fluid challenge. Chest 1990; 98:1450–1454.
47. Dell’Italia LJ, Starling MR, Blumhardt R, et al. Comparative effects of volume loading, dobutamine and nitroprusside in patients with predominant right ventricular infarction. Circulation 1986; 72:1327–1335.
48. Russ MA, Prondzinsky R, Carter JM, et al. Right ventricular function in myocardial infarction complicated by cardiogenic shock: improvement with levosimendan. Crit Care Med 2009; 37:3017–3023.
Mechanical Cardiac Support
49. Boehner JP, Popjes E. Cardiac failure: mechanical support strategies. Crit Care Med 2006; 34(Suppl):S268–S277.
50. Williams DO, Korr KS, Gewirtz H, Most AS. The effect of intra-aortic balloon counterpulsation on regional myocardial blood flow and oxygen consumption in the presence of coronary artery stenosis with unstable angina. Circulation 1982; 66:593–597.
51. Arafa OE, Pedersen TH, Svennevig JL, et al. Vascular complications of the intra-aortic balloon pump in patients undergoing open heart operations: 15-year experience. Ann Thorac Surg 1999; 67:645–651.
52. Baldyga AP. Complications of intra-aortic balloon pump therapy. In Maccioli GA, ed. Intra-aortic balloon pump therapy. Philadelphia: Williams & Wilkins, 1997, 127–162.
53. Crystal E, Borer A, Gilad J, et al. Incidence and clinical significance of bacteremia and sepsis among cardiac patients treated with intra-aortic balloon counterpulsation pump. Am J Cardiol 2000; 86:1281–1284.
54. Naughton MT, Raman MK, Hara K, et al. Effect of continuous positive airway pressure on intrathoracic and left ventricular transmural pressures in patients with congestive heart failure. Circulation 1995; 91:1725–1731.
55. Bradley TD, Holloway BM, McLaughlin PR, et al. Cardiac output response to continuous positive airway pressure in congestive heart failure. Am Rev Respir Crit Care Med 1992; 145:377–382.
56. Nouira S, Boukef R, Bouida W, et al. Non-invasive pressure support ventilation and CPAP in cardiogenic pulmonary edema: a multicenter randomized study in the emrgency department. Intensive Care Med 2011; 37:249–256.
57. Ducros L, Logeart D, Vicaut E, et al. CPAP for acute cardiogenic pulmonary edema from out-of-hospital to cardiac intensive care unit: a randomized multicenter study. Intensive Care Med 2011; 37:150.


Stay updated, free articles. Join our Telegram channel

Full access? Get Clinical Tree


