FIGURE 32.1 The energy yield from the oxidative metabolism of glucose and lactate, and the actions of selected factors that promote lactic acidosis. PDH = pyruvate dehydrogenase; LDH = lactate dehydrogenase.
Lactate Shuttle: Lactate is used as a fuel source during exercise (the lactate shuttle (6), and it is possible that lactate serves a similar function in critically ill patients (7). This is consistent with the observation that lactate uptake by the myocardium is increased in patients with septic shock (8). The possibility of a lactate shuttle in critically ill patients suggests that the enhanced production of lactate in these patients could be an adaptive response that helps to maintain energy metabolism in vital organs like the heart. This differs radically from the traditional perception of lactate as a source of fatal outcomes in critically ill patients.
Lactate as a Biomarker
The role of lactate as a biomarker is described in Chapter 10 (see pages 184–187), and is summarized in the following statements:
1. In clinical shock syndromes, the magnitude of elevation in blood lactate has a direct relationship with mortality rate, and an initial lactate level ≥4 mmol/L is associated with an increased mortality rate in the ensuing 72 hours (see Figure 10.6 on page 186).
2. The time required for lactate levels to return to normal (lactate clearance) has a greater prognostic value than the initial lactate level. Normalization of lactate levels within 24 hours is associated with the lowest mortality rates (see Figure 10.6 on page 186).
3. The source of elevated lactate levels in severe sepsis and septic shock is a combination of increased production of pyruvate (9) and a defect in O2 utilization in mitochondria, called cytopathic hypoxia (10). The latter phenomenon may be the result of cytokine or bacterial toxin-induced inhibition of pyruvate dehydrogenase (11,12), the enzyme responsible for pyruvate entry into mitochondria (see Figure 32.1). Thus, tissue oxygenation is not impaired in severe sepsis and septic shock (see Figure 14.3 on page 269).
Lactate and Acidosis
The end-product of glycolysis is lactic acid, which acts like a strong acid (i.e., loses its H+) in the physiological pH range, and exists as the negatively-charged lactate ion (1). The lactate moiety released by cells is the lactate ion, not lactic acid. So how does hyperlactatemia produce an acidosis? This cannot be explained by the traditional Brønsted-Lowry concept of acid base balance (i.e., an acid donates H+), but can be explained using Peter Stewart’s concept of the strong ion difference and its role in acid-base balance (13–15).
Strong Ion Difference
The strong ion difference (SID) is the difference in the summed concentrations of strong (readily dissociated) cations and anions in extracellular fluid (13,14). The strong ions in extracellular fluid are sodium (Na), chloride (CL), potassium (K), magnesium (Mg), calcium (Ca), and lactate, so the SID is determined as follows (15):
 (32.1)
The principle of electrical neutrality requires the following relationship between the SID and the ions that dissociate from water (H+ + OH–):
 (32.2)
Since OH– has a negligible influence on [H+] in the physiological pH range, the above equation can be simplified to:
 (32.3)
According to this relationship, a change in SID will be accompanied by an opposite change in [H+] and, if pH is used instead of [H+], the SID and pH will change in the same direction (see Figure 12.4 on page 222).
Therefore, to summarize equations 32.2–32.4, an increase in the plasma lactate concentration will decrease the SID, and this will decrease the plasma pH. The SID of plasma is normally about 40 mEq/L (14).
Causes of Hyperlactatemia
Clinical Shock Syndromes
The most notable, and most feared, sources of hyperlactatemia are the clinical shock syndromes; i.e., hypovolemic, cardiogenic, and septic shock. Although the mechanisms for the hyperlactatemia may be different, the plasma lactate level has prognostic value in these syndromes, as mentioned previously.
Systemic Inflammatory Response Syndrome
Systemic inflammation (fever, leukocytosis, etc.) can be accompanied by mild elevations of blood lactate (2 to 5 mEq/L) with a normal lactate:pyruvate ratio and a normal plasma pH. This condition is called stress hyperlactatemia, and is the result of an increase in the production of pyruvate without a defect in tissue oxygenation or oxygen utilization (10). The lactate elevation in severe sepsis and septic shock is usually associated with increased lactate:pyruvate ratios and a decrease in plasma pH.
Thiamine Deficiency
The manifestations of thiamine deficiency include high-output heart failure (wet beriberi), Wernicke’s encephalopathy, peripheral neuropathy (dry beriberi), and lactic acidosis. The lactic acidosis can be severe (17), and is caused by a deficiency in thiamine pyrophosphate, which serves as a co-factor for pyruvate dehydrogenase (see Figure 32.1). Thiamine deficiency may be more common than suspected in critically ill patients, and should be considered in all cases of unexplained lactic acidosis. (See Chapter 47 for a more detailed description of thiamine deficiency.)
Pharmaceutical Agents
A variety of drugs can produce hyperlactatemia, including metformin, antiretroviral agents, epinephrine, nitroprusside, and linezolid. Most cases (except epinephrine) are due to an impairment of oxidative metabolism, and can be lethal if left undetected. The hyperlactatemia produced by epinephrine is due to an increase in pyruvate production, and is not associated with a derangement in oxidative metabolism.
METFORMIN: Metformin is an oral hypoglycemic agent that can produce lactic acidosis during therapeutic dosing. The mechanism for the lactic acidosis is unclear, but it occurs primarily in patients with renal insufficiency, and has a mortality rate in excess of 45% (18,19). Plasma metformin levels are not routinely available, and the diagnosis is based on excluding other causes of lactic acidosis. The preferred treatment is hemodialysis (18,19), which removes both metformin and lactate.
ANTIRETROVIRAL AGENTS: Hyperlactatemia is reported in 8–18% of pa-tients receiving antiretroviral therapy for HIV infection (20). The responsible drugs are the nucleoside analogues (e.g., didanosine, stavudine), and the presumed mechanism is inhibition of mitochondrial DNA polymerase (21). In most cases, the hyperlactatemia is mild and not associated with acidemia, but lactate levels above 10 mmol/L have a reported mortality rate of 33–57% (21).
LINEZOLID: Lactic acidosis has been reported during therapy with linezolid (22,23). Most cases are mild and without adverse consequences, but lactate levels as high as 10 mmol/L have been reported (23). The mechanism is unknown, and lactate levels normalize after discontinuing the drug.
Non-Pharmaceutical Toxidromes
Lactic acidosis can be the result of intoxications with cyanide, carbon monoxide, and propylene glycol. The latter agent is used as a solvent for intravenous drugs, and can be overlooked as a cause of lactic acidosis.
PROPYLENE GLYCOL: The intravenous drugs that use propylene glycol as a solvent include lorazepam, diazepam, esmolol, nitroglycerin, and phenytoin. About 55–75% of propylene glycol is metabolized by the liver and the primary metabolites are lactate and pyruvate (24). Propylene glycol toxicity (i.e., agitation, coma, seizures, hypotension, and lactic acidosis) has been reported in 19% to 66% of patients receiving high-dose intravenous lorazepam for more than 2 days (24,25). If suspected, the drug infusion should be stopped and another sedative agent selected (midazolam and propofol do not use propylene glycol as a solvent). An assay for propylene glycol in blood is available, but the acceptable range has not been determined.
Lactic Alkalosis
Severe alkalosis (respiratory or metabolic) can raise blood lactate levels as a result of increased activity of pH-dependent enzymes in the glycolytic pathway (26). When liver function is normal, the liver clears the extra lactate generated during alkalosis, and lactic alkalosis becomes evident only when the blood pH is 7.6 or higher. However, in patients with impaired liver function, hyperlactatemia can be seen with less severe degrees of alkalemia.
Other Causes
Other possible causes of hyperlactatemia in ICU patients include generalized seizures (from hypermetabolism) (27), hepatic insufficiency (from reduced lactate clearance) (28), acute asthma (from enhanced lactate production by the respiratory muscles) (29), and hematologic malignancies (rare) (30). Hyperlactatemia associated with hepatic insufficiency is often mild (28). Hyperlactatemia that accompanies generalized seizures can be severe (with lactate levels of 15 mmol/L) but is transient (27).
Diagnostic Considerations
The normal lactate concentration in blood is ″2 mmol/L, but increases in lactate concentration do not have prognostic value until they reach 4 mmol/L (1), so a higher threshold of 4 mmol/L is used to define“clinically significant” hyperlactatemia. Measurements can be obtained on arterial or venous blood samples. If immediate measurements are unavailable, the blood should be placed on ice to retard lactate production by red blood cells.
The anion gap (described on pages 594–596) should be elevated in lactic acidosis, but there are numerous reports of a normal anion gap in patients with lactic acidosis (31). As a result, the anion gap should not be used as a screening test for lactic acidosis.
D-Lactic Acidosis
The lactate produced by mammalian tissues is a levo-isomer (l-lactate), whereas a dextro-isomer of lactate (d-lactate) is produced by certain strains of bacteria that can populate the bowel (32). D-lactate generated by bacterial fermentation in the bowel can gain access to the systemic circulation and produce a metabolic acidosis, often combined with a metabolic encephalopathy (33). Most cases of d-lactic acidosis have been reported after extensive small bowel resection or after jejunoileal bypass for morbid obesity (32–34).
DIAGNOSIS: D-lactic acidosis can produce an elevated anion gap, but the standard laboratory assay for blood lactate measures only l-lactate. If d-lactic acidosis is suspected, you must request the laboratory to perform a d-lactate assay.
ALKALI THERAPY
The primary goal of therapy in lactic acidosis is to correct the underlying metabolic abnormality. Alkali therapy aimed at correcting the pH is of questionable value (35). The following is a brief summary of the pertinent issues regarding alkali therapy for lactic acidosis.
Acidosis Is Not Harmful
The principal fear from acidosis is the risk of impaired myocardial contractility (36). However, in the intact organism, acidemia is often accompanied by an increase in cardiac output (37). This is explained by the ability of acidosis to stimulate catecholamine release from the adrenals and to produce vasodilation. Therefore, impaired contractility from acidosis is less of a concern in the intact organism. In addition, acidosis may have a protective role in the setting of clinical shock. For example, extracellular acidosis has been shown to protect energy-depleted cells from cell death (38).
Bicarbonate Is Not an Effective Buffer
Sodium bicarbonate is the standard buffer used for lactic acidosis, but has limited success in raising the serum pH (39). This can be explained by the titration curve for the carbonic acid-bicarbonate buffer system, which is shown in Figure 32.2. The HCO3 buffer pool is generated by the dissociation of carbonic acid (H2CO3):
 (32.4)
The dissociation constant (pK) for carbonic acid (i.e., the pH at which the acid is 50% dissociated) is 6.1, as indicated on the titration curve. Buffers are most effective within 1 pH unit on either side of the pK (40), so the effective range of the bicarbonate buffer system should be an extracellular pH between 5.1 and 7.1 pH units (indicated by the shaded area on the titration curve). Therefore, bicarbonate is not expected to be an effective buffer in the usual pH range of extracellular fluid. Bicarbonate is not really a buffer; rather, it is a transport form of carbon dioxide in blood.
Bicarbonate Can be Harmful
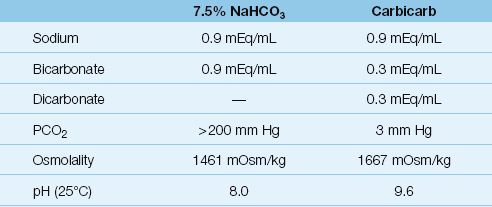
A number of undesirable effects are associated with sodium bicarbonate therapy. One of these is the abilityof bicarbonate to generate CO2, which can actually lower the intracellular pH and cerebrospinal fluid pH (41,42). In fact, considering that the PCO2 is 200 mm Hg in standard bicarbonate solutions (see Table 32.1), bicarbonate is really a CO2 burden (an acid load!) that must be removed by the lungs.
Finally, bicarbonate infusions can increase blood lactate levels (42). Although this effect is attributed to alkalosis-induced augmentation of lactate production, it is not a desirable effect for a therapy of lactic acidosis.
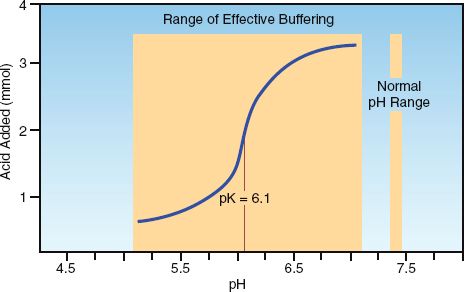
FIGURE 32.2 The titration curve for the carbonic acid-bicarbonate buffer system. The large, shaded area indicates the effective pH range for the bicarbonate buffer system, which does not coincide with the physiological pH range of extracellular fluid. Adapted from Reference 40.
Carbicarb
Carbicarb is a commercially available buffer solution that is a 1:1 mixture of sodium bicarbonate and disodium carbonate. As shown in Table 32.1, carbicarb has less bicarbonate and a much lower PCO2 than the standard 7.5% sodium bicarbonate solution. As a result, carbicarb does not produce the increase in PCO2 seen with sodium bicarbonate infusions (41).
Table 32.1 Bicarbonate-Containing Buffer Solutions
Recommendation
Alkali therapy has no role in the routine management of metabolic acidosis. However, when patients are deteriorating rapidly in the setting of a severe acidemia (pH <7.0), a trial infusion of bicarbonate can be attempted as a desperation measure by administering one-half of the estimated HCO3 deficit (42).
 (32.5)
(where 15 mEq/L is the desired plasma [HCO3]). If cardiovascular im-provement occurs, bicarbonate therapy can be continued to maintain the plasma HCO3 at 15 mEq/L. If no improvement or further deterioration occurs, further bicarbonate administration is not warranted.
KETOACIDS
Ketogenesis
When carbohydrates are not available for metabolic energy production, there is a breakdown of triglycerides in adipose tissue (lipolysis) to generate fatty acids, which are transported to the liver and metabolized to form 3 ketone bodies; i.e., acetoacetate, β-hydroxybutyrate, and acetone. This is illustrated in Figure 32.3. These ketones are released from the liver and can be used as oxidative fuels by vital organs such as the heart and central nervous system. The oxidative metabolism of ketones yields 4 kcal/g, which is slightly in excess of the energy yield from the oxidative metabolism of glucose (3.7 kcal/g).
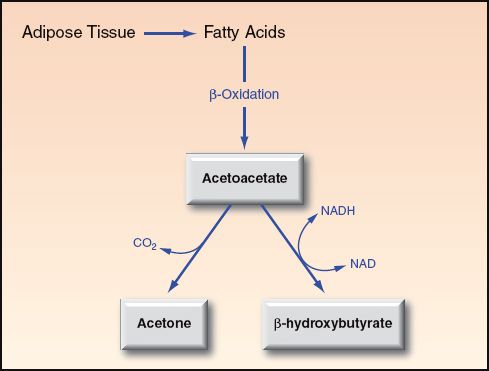
FIGURE 32.3 Ketogenesis in the liver, which occurs in response to diminished availability of glucose. Acetone is a ketone, but is not a ketoacid.
Ketoacids in Blood
The normal concentration of ketones in the blood is negligible (0.1 mmol/L), but blood ketone levels increase tenfold (to 1 mmol/L) after just 3 days of starvation. Acetone is not a ketoacid, but is responsible for the “fruity” odor of breath in patients with ketoacidosis. Acetoacetate (AcAc) and β-hydroxybutyrate (β-OHB) are strong acids (i.e., readily dissociate), and they promote a decrease in plasma pH when their plasma concentrations reach 3 mmol/L (43). The balance of AcAc and β-OHB in blood is determined by the following redox reaction (see Figure 32.3):
 (32.6)
The balance of this reaction favors the formation of β-OHB. In conditions of enhanced ketone production, the β-OHB:AcAc ratio ranges from 3:1 in diabetic ketoacidosis, to as high as 8:1 in alcoholic ketoacidosis. The concentration of ketoacids in the blood in diabetic and alcoholic ketoacidosis is shown in Figure 32.4. Note the preponderance of β-OHB in both conditions. Because of this preponderance, ketoacidosis is more accurately called β-hydroxybutyric acidosis.
The Nitroprusside Reaction
The nitroprusside reaction is a colorimetric method for detecting AcAc and acetone in blood and urine. The test can be performed with tablets (Acetest) or reagent strips (Ketostix, Labstix, Multistix). A detectable reaction requires a minimum AcAc concentration of 3 mmol/L. Because this reaction does not detect the predominant ketoacid, β-hydroxybutyrate (43), it is an insensitive method for monitoring the severity of ketoacidosis. This is illustrated in Figure 32.4. In alcoholic ketoacidosis, the total concentration of ketoacids in blood is 13 mmol/L, which represents more than a hundredfold increase over the normal concentration of blood ketones, yet the nitroprusside reaction will be negative because the AcAc concentration is below 3 mmol/L.
ß-hydroxybutyrate Testing
There are portable “ketone meters” that can provide reliable measurements of β-OHB concentrations in fingerstick (capillary) blood, and results are available in about 10 seconds (44). (Available devices include Precision Xtra meter from Abbot Laboratories and Nova Max PLUS from Nova Biomedical.) The American Diabetes Association considers measurements of plasma β-OHB with these meters as the preferred method for monitoring patients with diabetic ketoacidosis (45).
DIABETIC KETOACIDOSIS
Diabetic ketoacidosis (DKA) is usually seen in insulin-dependent diabetic patients, but there is no previous history of diabetes mellitus in 27–37% of cases (46). The most common precipitating factors in DKA are inappropriate insulin dosing and concurrent illness (e.g., infection). The mortality rate of DKA is 1–5% (46).
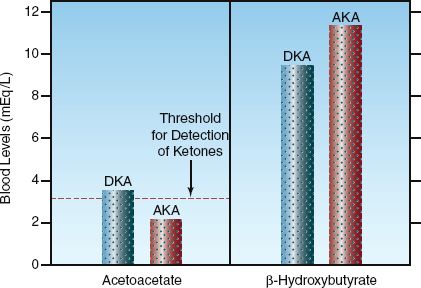
FIGURE 32.4 The concentrations of acetoacetate and ß-hydroxybutyrate in the blood in diabetic ketoacidosis (DKA) and alcoholic ketoacidosis (AKA). The horizontal hatched line represents the minimum concentration of acetoacetate required to produce a positive nitroprusside reaction.
Clinical Features
The definition of DKA proposed by the American Diabetes Association includes a blood glucose >250 mg/dL, plasma [HCO3] <18 mEq/L, plasma pH ″7.30, an elevated anion gap, and evidence of ketones in blood or urine (45). However, there are exceptions:
1. The blood glucose is only mildly elevated (<250 mg/dL) in about 20% of cases of DKA(47).
2. The anion gap can be normal in DKA (48). The renal excretion of ketones is accompanied by an increase in chloride reabsorption in the renal tubules, and the resulting hyperchloremia limits the increase in the anion gap.
Additional clinical features of interest in DKA are summarized below.
1. Leukocytosis is not a reliable marker of infection in DKA because ketonemia produces a leukocytosis, which is proportional to the concentration of ketones in plasma (45). However, an increase in immature neutrophils (band forms) can be a reliable marker of infection in patients with DKA (49).
2. Elevated troponin I levels without evidence of an acute coronary event has been reported in 27% of patients with DKA (50).
3. Dehydration is almost universal in DKA, but this may not be reflected in the plasma sodium concentration because hyperglycemia has a dilutional effect on plasma sodium; i.e., the plasma sodium concentration decreases by 1.6–2 mEq/L for every 100 mg/dL increase in the plasma glucose concentration (51,52).
Management
The management of DKA is summarized in Table 32.2. The following are some of the details.
Intravenous Fluids
Volume deficits in DKA average 50–100 mL/kg (4–8 L for an 80 kg adult) (45). Volume resuscitation begins with isotonic (0.9%) saline infused at a rate of 1 liter per hour (or 15–20 mL/kg/hr) (45). When the patient stabilizes (e.g., blood pressure returns to normal), the infusion rate can be decreased to 250–500 mL/hr (4–14 mL/kg/hr). When the blood glucose falls to 250 mg/dL, change the intravenous fluid to 5% dextrose in 0.45% saline and decrease the infusion rate to 150–250 mL/hr.
Insulin
Insulin therapy is started with regular insulin given intravenously, starting with a bolus dose of 0.15 units per kilogram body weight and followed with a continuous infusion at 0.1 units/kg/hr. Because insulin adsorbs to intravenous tubing, the initial 50 mL of infusate should be run through the IV setup before the insulin drip is started. The blood glucose levels should decrease by 50 to 75 mg/dL per hour (46), and the insulin infusion should be adjusted to achieve this goal. When the blood glucose level falls to 200 mg/dL, the insulin infusion should be decreased to 0.05 to 0.1 units/kg/hr, and dextrose should be added to the intravenous fluids. Thereafter, the blood glucose levels should be maintained between 150–200 mg/dL (45,46). Achieving euglycemia is not recommended because of the risk of hypoglycemia.
Table 32.2 Management of Diabetic Ketoacidosis
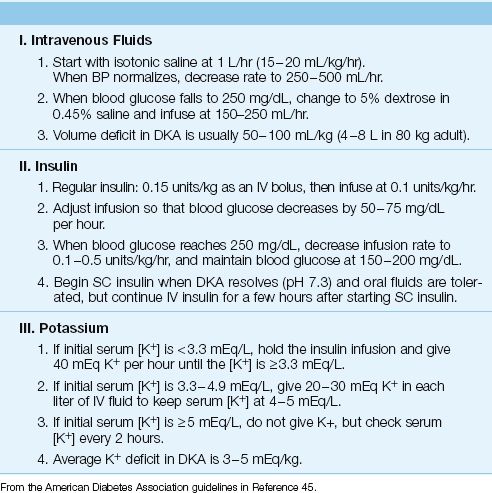
AFTER DKA RESOLVES: When DKA has resolved (i.e., glucose <200 mg/dL, plasma [HCO3] >18 mEq/L, plasma pH >7.3) and the patient can tolerate oral fluids, subcutaneous insulin can be started. Patients who were insulin-dependent prior to admission can be placed on their usual outpatient regimen. Patients who are new to insulin should receive 0.5–0.8 Units/kg per day in divided doses (46).
Potassium
Potassium depletion is universal in DKA, and the average deficit is 3 to 5 mEq/kg (47). However, the initial serum K+ is often normal (74% of patients) or even elevated (22% of patients) (47). The serum K+ can fall dramatically during insulin therapy (transcellular shift), so if the initial serum K+ is low (<3.3 mEq/L), the insulin should be withheld until the serum K+ can be normalized (by giving 40 mEq KCL hourly). If the serum K+ is high (≥5 mEq/L), no potassium is given initially, and when the serum K+ is normal, 20–30 mEq of KCL should be added to each liter of IV fluid (45). Regardless of the initial potassium regimen, the serum K+ should be checked every 1–2 hours for the first 4–6 hours.
Phosphate
Phosphate depletion is also common in DKA, and serum phosphate levels are typically 1–1.5 mmol/kg (47). However, phosphate replacement has no documented benefit in DKA, and is not recommended unless the hypophosphatemia is severe (45–47). If the serum PO4 is <1 mg/dL, give 20–30 mEq potassium phosphate with each liter of IV fluid (45).
Bicarbonate
Bicarbonate therapy does not improve the outcome in DKA, and is not recommended as a routine measure (45–47). However, in patients who are in extremis with a pH <7.0, the bicarbonate regimen presented earlier can be used as a desperation measure.
Monitoring Acid-Base Status
The serum [HCO3] is not a reliable measurement for following the acid-base status during the management of DKA because the isotonic saline produces a hyperchloremic acidosis that prevents the bicarbonate from rising despite a resolving ketoacidosis. In this situation, monitoring the gap-gap ratio is more informative. The gap-gap ratio is the ratio of the anion gap excess to the bicarbonate deficit, and is described at the end of the last chapter (see pages 596–597). This ratio is unity (1.0) in pure ketoacidosis, and it decreases as the ketoacidosis resolves and is replaced by the hyperchloremic acidosis. When the ketones have been cleared from the bloodstream, the ratio approaches zero.
ALCOHOLIC KETOACIDOSIS
Alcoholic ketoacidosis (AKA) is a complex acid-base disorder that occurs in chronic alcoholics and usually appears 1 to 3 days after a period of heavy binge drinking (53,54). Several mechanisms are involved, including reduced nutrient intake (which initiates enhanced ketone production), hepatic oxidation of ethanol (which generates NADH and enhances β-hydroxybutyrate formation), and dehydration (which impairs ketone excretion in the urine).
Clinical Features
Patients with AKA tend to be chronically ill and have several comorbid conditions. The presentation usually includes nausea, vomiting, and abdominal pain (53). Electrolyte abnormalities are common, particularly the hypos (e.g., hyponatremia, hypokalemia, hypophosphatemia, hypomagnesemia, hypoglycemia). Mixed acid-base disorders are also common in AKA. More than half the patients can have lactic acidosis (caused by other conditions), and metabolic alkalosis occurs in patients with protracted vomiting.
Diagnosis
The diagnosis of AKA is suggested by the clinical setting (i.e., after a period of binge drinking), an elevated anion gap, and the presence of ketones in the blood or urine. However, the nitroprusside reaction for detecting ketones can be negative in AKA. This is shown in Figure 32.4. The oxidation of ethanol in the liver generates NADH, and this favors the conversion of acetoacetate to β-hydroxybutyrate, and results in a low concentration of acetoacetate blood and urine. Even though most cases of AKA have a positive nitroprusside reaction for ketones (53), the severity of the ketoacidosis is significantly underestimated.
Management
The management of AKA is notable for its simplicity; i.e., infusion of dextrose-containing saline solutions is usually all that is required. The glucose infusion slows hepatic ketone production, while the infused volume promotes the renal clearance of ketones. The ketoacidosis usually re-solves within 24 hours. Other electrolyte deficiencies are corrected as needed, and thiamine supplementation is recommended because glucose infusions can deplete marginal thiamine reserves.
A FINAL WORD
It’s Not the Acidosis
One of the important messages in this chapter is the fact that the clinical problem created by lactic acidosis or diabetic ketoacidosis is not because of the acidosis, but because of the underlying metabolic derangement. The same degree of acidosis can be associated with diabetic ketoacidosis and lactic acidosis, but the survival is much better with ketoacidosis because the underlying problem is an exaggeration of an adaptive response to intracellular glucose deprivation, while the problem with lactic acidosis is a generalized derangement in cellular energy metabolism.
The other point that deserves emphasis is the fact that bicarbonate is not much of a buffer in the physiological pH range. In fact, bicarbonate can be viewed as a consequence of the accumulation of CO2, the principal volatile acid in the human body.
REFERENCES
Lactic Acidosis—Reviews
1. Okorie ON, Dellinger P. Lactate: biomarker and potential therapeutic target. Crit Care Clin 2011; 27:299–326.
2. Vernon C, LeTourneau JL. Lactic acidosis: Recognition, kinetics, and associated prognosis. Crit Care Clin 2010; 26:255–283.
Lactate Metabolism
3. Borregaard N, Herlin T. Energy metabolism of human neutrophils during phagocytosis. J Clin Invest 1982; 70:550–557.
4. De Backer D, Creteur J, Zhang H, et al. Lactate production by the lungs in acute lung injury. Am J Respir Crit Care Med 1997; 156:1099–1104.
5. Lehninger AL. Bioenergetics. New York: WA Benjamin, 1965; 16.
6. Brooks GA. Lactate production under fully aerobic conditions: the lactate shuttle during rest and exercise. Fed Proc 1986; 45:2924–2929.
7. Gladden LB. Lactate metabolism: a new paradigm for the third millennium. J Physiol 2004; 558.1:5–30.
8. Dhainaut J-F, Huyghebaert M-F, Monsallier JF, et al. Coronary hemodynamics and myocardial metabolism of lactate, free fatty acids, glucose, and ketones in patients with septic shock. Circulation 1987; 75:533–541.
Lactate as a Biomarker
9. Gore DC, Jahoor F, Hibbert JM, DeMaria EJ. Lactic acidosis during sepsis is related to increased pyruvate production, not deficits in tissue oxygen availability. Ann Surg 1996; 224:97–102.
10. Fink MP. Cytopathic hypoxia. Crit Care Clin 2001; 17:219–238.
11. Vary TC, O’Neill P, Cooney RN, et al. Chronic infusion of interleukin-1 induces hyperlactatemia and altered regulation of lactate metabolism in skeletal muscle. J Parenter Ent Nutr 1999; 23:213–217.
12. Thomas GW, Mains CW, Slone DS, et al. Potential dysregulation of the pyruvate dehydrogenase complex by bacterial toxins and insulin. J Trauma 2009; 67:628–633.
13. Stewart PA. Modern quantitative acid-base chemistry. Can J Physiol Pharmacol 1983; 61:1444–1461.
14. Stewart PA. Strong ions and the strong ion difference. In Kellum JA, Elbers PWG, eds. Stewart’s Textbook of Acid Base 2009: Amsterdam; Acidbase.org:55–70.
15. Adrogue HJ, Gennari J, Gala JH, Madias NE. Assessing acid-base disorders. Kidney Int 2009; 76:1239–1247.
Causes of Hyperlactatemia
16. Mizock BA. Metabolic derangements in sepsis and septic shock. Crit Care Clin 2000; 16:319–336.
17. Campbell CH. The severe lactic acidosis of thiamine deficiency: acute, pernicious or fulminating beriberi. Lancet 1984; 1:446–449.
18. Seidowsky A, Nseir S, Houdret N, Fourrier F. Metformin-associated lactic acidosis: a prognostic and therapeutic study. Crit Care Med 2009; 37:2191–2196.
19. Perrone J, Phillips C, Gaieski D. Occult metformin toxicity in three patients with profound lactic acidosis. J Emerg Med 2011; 40:271–275.
20. Ogedegbe AO, Thomas DL, Diehl AM. Hyperlactatemia syndromes associated with HIV therapy. Lancet Infect Dis 2003; 3:329–337.
21. Falco V, Rodriguez D, Ribera E, et al. Severe nucleoside-associated lactic acidosis in human immunodeficiency virus-infected patients: report of 12 cases and review of the literature. Clin Infect Dis 2002; 34:838–846.
22. Gould FK. Linezolid: safety and efficacy in special populations. J Antimicrob Chemoth 2011; 66(Suppl 4):iv3–iv6.
23. Apodaca AA, Rakita RM. Linezolid-induced lactic acidosis. New Engl J Med 2003; 348:86–87.
24. Wilson KC, Reardon C, Theodore AC, Farber HW. Propylene glycol toxicity: a severe iatrogenic illness in ICU patients receiving IV benzodiazepines. Chest 2005; 128:1674–1681.
25. Arroglia A, Shehab N, McCarthy K, Gonzales JP. Relationship of continuous infusion lorazepam to serum propylene glycol concentration in critically ill adults. Crit Care Med 2004; 32:1709–1714.
26. Bersin RM, Arieff AI. Primary lactic alkalosis. Am J Med 1988; 85:867–871.
27. Orringer CE, Eusace JC, Wunsch CD, Gardner LB. Natural history of lactic acidosis after grand-mal seizures. A model for the study of anion-gap acidoses not associated with hyperkalemia. N Engl J Med 1977; 297:796–781.
28. Kruse JA, Zaidi SAJ, Carlson RW. Significance of blood lactate levels in critically ill patients with liver disease. Am J Med 1987; 83:77–82.
29. Mountain RD, Heffner JE, Brackett NC, Sahn SA. Acid-base disturbances in acute asthma. Chest 1990; 98:651–655.
30. Friedenberg AS, Brnadoff DE, Schiffman FJ. Type B lactic acidosis as a severe metabolic complication of lymphoma and leukemia: a case series from a single institution and literature review. Medicine (Baltimore) 2007; 86:225–232.
Diagnostic Considerations
31. Iberti TS, Liebowitz AB, Papadakos PJ, et al. Low sensitivity of the anion gap as a screen to detect hyperlactatemia in critically ill patients. Crit Care Med 1990; 18:275–277.
32. Anonymous. The colon, the rumen, and d-lactic acidosis. Lancet 1990; 336:599–600 (editorial).
33. Thurn JR, Pierpoint GL, Ludvigsen CW, Eckfeldt JH. D-lactate encephalopathy. Am J Med 1985; 79:717–720.
34. Bustos D, Ponse S, Pernas JC et al. Fecal lactate and the short bowel syndrome. Dig Dis Sci 1994; 39:2315–2319.
Alkali Therapy
35. Forsythe SM, Schmidt GA. Sodium bicarbonate for the treatment of lactic acidosis. Chest 2000; 117:260–267.
36. Sonnett J, Pagani FD, Baker LS, et al. Correction of intramyocardial hypercarbic acidosis with sodium bicarbonate. Circ Shock 1994; 42:163–173.
37. Mehta PM, Kloner RA. Effects of acid-base disturbance, septic shock, and calcium and phosphorous abnormalities on cardiovascular function. Crit Care Clin 1987; 3:747–758.
38. Gores GJ, Nieminen AL, Fleischman KE, et al. Extracellular acidosis delays onset of cell death in ATP-depleted hepatocytes. Am J Physiol 1988; 255:C315–C322.
39. Graf H, Arieff AI. The use of sodium bicarbonate in the therapy of organic acidoses. Intensive Care Med 1986; 12:286–288.
40. Comroe JH. Physiology of respiration. Chicago: Yearbook Medical Publishers, 1974; 203.
41. Rhee KY, Toro LO, McDonald GG, et al. Carbicarb, sodium bicarbonate, and sodium chloride in hypoxic lactic acidosis. Chest 1993; 104:913–918.
42. Rose BD. Clinical physiology of acid-base and electrolyte disorders. 4th ed. New York: McGraw-Hill, 1994; 590.
Ketoacids
43. Cartwright MM, Hajja W, Al-Khatib S, et al. Toxigenic and metabolic causes of ketosis and ketoacidotic syndromes. Crit Care Clin 2012; 601–631.
44. Plüdderman A, Hemeghan C, Price C, et al. Point-of-care blood test for ketones in patients with diabetes: primary care diagnostic technology update. Br J Clin Pract 2011; 61:530–531.
45. American Diabetes Association. Hyperglycemic crisis in diabetes. Diabetes Care 2004; 27(Suppl):S94–S102.
Diabetic Ketoacidosis
46. Westerberg DP. Diabetic ketoacidosis: evaluation and treatment. Am Fam Physician 2013; 87:337–346.
47. Charfen MA, Fernandez-Frackelton M. Diabetic ketoacidosis. Emerg Med Clin N Am 2005; 23:609–628.
48. Gamblin GT, Ashburn RW, Kemp DG, Beuttel SC. Diabetic ketoacidosis presenting with a normal anion gap. Am J Med 1986; 80:758–760.
49. Slovis CM, Mork VG, Slovis RJ, Brain RP. Diabetic ketoacidosis and infection: leukocyte count and differential as early predictors of serious infection. Am J Emerg Med 1987; 5:1–5.
50. AlMallah M, Zuberi O, Arida M, Kim HE. Positive troponin in diabetic ketoacidosis without evident acute coronary syndrome predicts adverse cardiac events. Clin Cardiol 2008; 31:67–71.
51. Rose BD, Post TW. Hyperosmolal states: hyperglycemia. In: Clinical physiology of acid-base and electrolyte disorders. 5th ed. New York, NY: McGraw-Hill, 2001; 794–821.
52. Moran SM, Jamison RL. The variable hyponatremic response to hyperglycemia. West J Med 1985; 142:49–53.
Alcoholic Ketoacidosis
53. Wrenn KD, Slovis CM, Minion GE, Rutkowsli R. The syndrome of alcoholic ketoacidosis. Am J Med 1991; 91:119–128.
54. McGuire LC, Cruickshank AM, Munro PT. Alcoholic ketoacidosis. Emerg Med J 2006; 23:417–420.


Stay updated, free articles. Join our Telegram channel

Full access? Get Clinical Tree


