INTRODUCTION
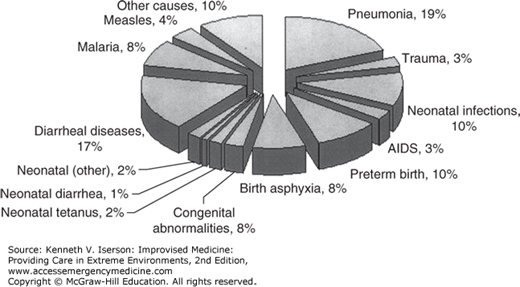
Malnutrition is a huge problem throughout the world, and it worsens in disaster situations. Estimates are that moderate-to-acute malnutrition affects around 10% of children <5 years old in low- and middle-income countries,1 and contributes to more than half (54%) of the deaths in this group (Fig. 36-1). Among elderly patients in the US general population, the prevalence of malnutrition ranges from 12% to as high as 85% among the institutionalized elderly.2 Malnutrition usually occurs in resource-poor situations. The keys are both to recognize it and to treat it effectively.
RECOGNIZING MALNUTRITION
Malnutrition can be identified using mid-arm circumference (MAC) or by comparing a child’s weight and height with standard charts.
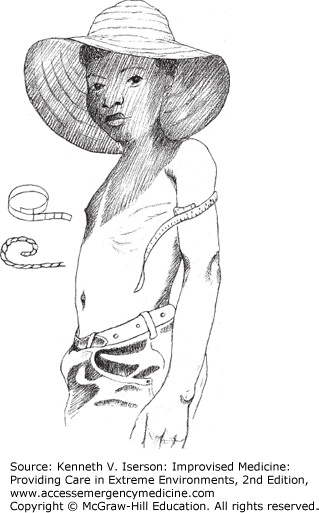
Measuring a child’s MAC helps to determine the degree of malnourishment. This technique is at least as good at predicting mortality from malnutrition as is a child’s position on a weight/height growth chart. Measure MAC, in centimeters, at the midpoint of the left upper arm, halfway between the point of the shoulder and the elbow. From 1 to 5 years of age, the mid-arm circumference remains fairly stable because the increasing growth in muscle mass is balanced by a decrease in arm fat. The median value for this age group is 16.5 cm. In the first 12 months of life, MAC changes so rapidly that it is not a reliable indicator of malnutrition. And, while skin thickness over the scapula or triceps can be measured, this requires the use of calipers and provides little additional information.3
To make the measurement, have the child keep the arm hanging straight down by his side (Fig. 36-2). If the MAC of a child between the ages of 1 and 5 years is <12.5 cm, he is severely malnourished. If it is between 12.5 and 14 cm, he is moderately malnourished. Above 14 cm is normal.4,5
If a measuring tape is not available, one of the easiest measuring tools is to see which finger touches your thumb when wrapped around the child’s mid-arm. Predetermine measurements for each of your finger-to-thumb distances. Then you will know which combination indicates severe malnutrition (<12.5 cm), moderate (12.5-14 cm) and normal (>14 cm). Practice and teach this to others, using a roll of gauze as a surrogate arm.6 A marked piece of non-stretchable cloth or a string with knots at the appropriate distances can be used, although it may stretch a little. Another method is to use a strip of x-ray film. Scratch or paint the film at the 0-cm mark, and again at the 12.5- and 14-cm marks. For clarity, the area between the 0- and 12.5-cm marks can be colored red; the area between 12.5 and 14 cm, yellow; and the area above 14 cm, green.
MALNUTRITION IN ELDERLY ADULTS
The best parameters to determine nutritional risk in adults ≥65 years old are MAC and calf circumference.
Measure MAC as in a child. The standards for people at the 5th and 50th percentile are listed in Table 36-1. Those below the 50th percentile are at risk for malnutrition; those at or below the 5th percentile are seriously malnourished. For calf circumference, both the knee and ankle should be at 90-degree angles. In a sitting person, pass the measuring tape around the calf and move it along the calf to locate the largest circumference. If the person is supine, bend the knee to a 90-degree angle and support the foot so that it is also at 90 degrees before measuring the calf.7 The calf circumference which indicates that this group is at malnutrition risk is ≤31 cm.8
CLASSIFICATION OF PEDIATRIC MALNUTRITION
A child’s classification as malnourished depends on his or her position on the standard weight-height-for-age charts, which can be accessed at the Centers for Disease Control and Prevention: Growth Charts (www.cdc.gov/growthcharts/). Height (length for a supine infant) and weight can be measured using standard means or by the improvised methods described in Chapter 7. Interpret the results using the Welcome Classification system:
MALNUTRITION MANAGEMENT IN CHILDREN
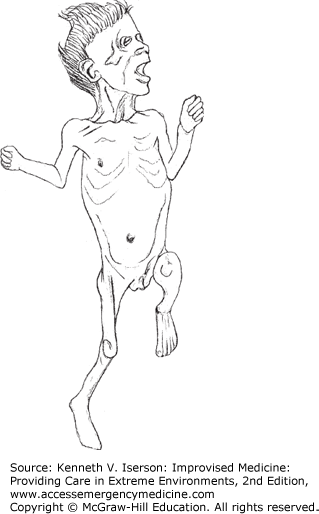
Severe malnutrition takes the form of either marasmus (wasting; Fig. 36-3) or kwashiorkor (edema; Fig. 36-4), or a combination of the two. The reasons for a progression of nutritional deficit into one form rather than the other are unclear and cannot be explained solely by the composition of the deficient diet.10
FIG. 36-4.
Kwashiorkor.
Stay updated, free articles. Join our Telegram channel

Full access? Get Clinical Tree


