Hypotension and Shock States
Christine A. Doyle
Myer H. Rosenthal
CASE SUMMARY
A 64-year-old man presented to the emergency room with fever of 39.44°C, vomiting, and abdominal pain. His medical history was significant for hypertension and congestive heart failure, with a left ventricular ejection fraction of 40%. His vital signs revealed a blood pressure of 120/90 mm Hg and a heart rate of 110 bpm. The serum hemoglobin was 14 g per dL and a white cell count of 20,000 per mm3. The intraoperative course was characterized by several episodes of hypotension, which responded to intravenous fluids and repeated doses of ephedrine. A sigmoid diverticular perforation was found and repaired. Anticipating prolonged mechanical ventilation, the patient was left intubated. In the intensive care unit (ICU), his blood pressure decreased to 70/50 mm Hg without adequate response to a 500 cc bolus of intravenous normal saline solution. A dopamine infusion produced a mild response. A transesophageal echocardiography (TEE) examination revealed significant hypokinesia of the lateral and inferior walls and an estimated ejection fraction of 25%. A pulmonary artery catheter (PAC) was then inserted. His pulmonary artery pressure was 50/28 mm Hg, wedge pressure of 24 mm Hg, and a cardiac output of 6.5 L. Norepinephrine was substituted for dopamine, which increased the blood pressure to 110/60 mm Hg. Subsequently, the addition of milrinone and nesiritide improved the ejection fraction and urinary output. Following triple antibiotic therapy, the patient’s temperature decreased and his leukocytosis improved. During the next several days, he was weaned from the ventilator and intravenous infusions. After a long and protracted hospitalization, he was eventually discharged home.
What Is the Basic Hemodynamic Physiology Relevant to Hypotension and Shock States?
The cardiovascular system is a circuit with two hydraulic pumps placed in series. The pumps (right and left heart) provide the energy for the blood to circulate through the system. This is a rather complex system with several properties:
It is elastic.
It has a mean pressure, which is determined by more than just the pumping action of the heart.
It fills via passive and active mechanisms.
Because of passive filling, mean cardiovascular pressure is dependent upon volume and compliance. In addition, the pumping action of the heart provides the blood with a significant amount of kinetic energy while consuming vastly different amounts of chemical energy.
The physics of the circulatory system in its most basic elements can be described by Ohm’s Law, which mathematically relates flow, resistance and pressure. As applied to the flow of electricity it is generally expressed as:
where V is the voltage, or electromotive force, I is the current, and R is the resistance. In physiologic terms, the voltage is equivalent to the mean intravascular hydrostatic pressure (P) and the current is the flow (Q), with R as the expression of vascular resistance.
Therefore, if there is no pressure differential along the circuit, there is no flow, and if there is a high resistance without increase in pressure, there is little flow. In practical terms, the pressure (P) is either the systemic mean arterial pressure (MAP) or mean pulmonary artery pressure (MPAP), with the flow (Q) as cardiac output and the resistance (R) as either systemic vascular resistance (SVR) or pulmonary vascular resistance (PVR).
Much of the basic research into the physiology of the heart was performed a century ago by German physiologist, Otto Frank, and English physiologist, Ernest Starling. More recently, extensive work has been done by Kiichi Sagawa et al. at Johns Hopkins.
Otto Frank appreciated the necessity of applying physics to the study of biology. He also recognized the need for measurement systems, which could respond with speed and precision. Frank’s work, Zur Dynamik des
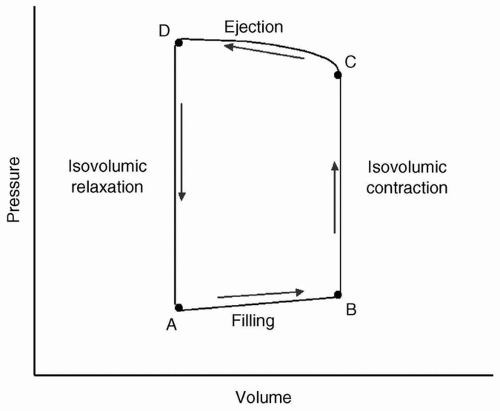
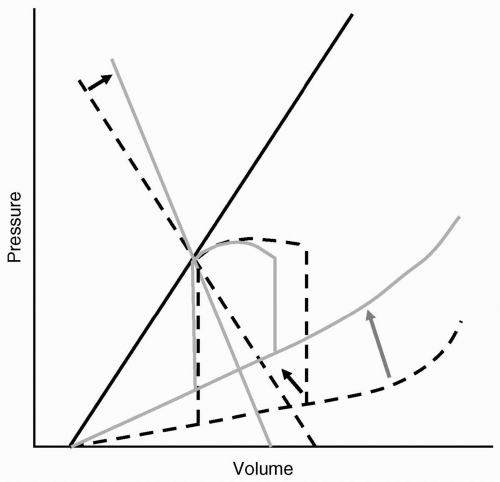
Herzmuskels, published in 1895,1 begins with observations of the heart under the “simplest mechanical conditions”: Isolated isometric contraction, isotonic contraction, then variables added singly. The pressure-volume loop is derived from his work and is redrawn in Figure 19.1.
Herzmuskels, published in 1895,1 begins with observations of the heart under the “simplest mechanical conditions”: Isolated isometric contraction, isotonic contraction, then variables added singly. The pressure-volume loop is derived from his work and is redrawn in Figure 19.1.
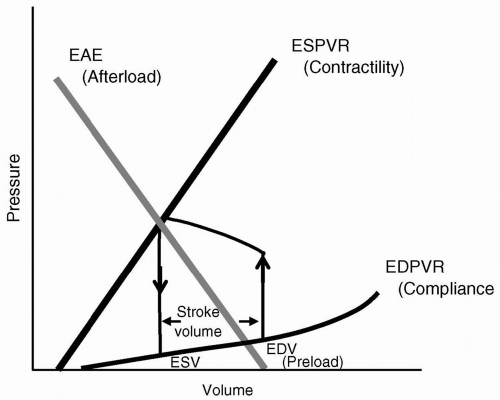
During each cardiac cycle, pressure is related to volume in a reproducible fashion. Frank’s1 and Sagawa’s2 work delineated the keys of the end-diastolic pressure-volume relation (EDPVR), end-systolic pressure-volume relation (ESPVR), and effective arterial elastance (EAE). The EDPVR is a measure of how easily the ventricular wall stretches with volume loading, and is frequently referred to as the compliance, characterizing the diastolic or lusitropic function of the heart. The ESPVR is a measure of how easily the ventricular wall contracts at a given volume, and is frequently referred to as the contractility, thereby depicting the systolic or inotropic function of the heart. The EAE is actually the arterial pressure-volume relation and is related to the arterial resistance or impedance to ventricular ejection, and therefore related to afterload, for example, the cardiac ventricular wall tension during ejection. The x-intercept of the EAE reflects preload or ventricular end-diastolic volume (VEDV). The intercept of the EAE and ESPVR is the pressure-volume at which the aortic valve closes, and is the volume at end-systole (ESV). The area within the loop is cardiac work, and the distance between the two limbs of the loop (upward = isovolumic contraction, downward = isovolumic relaxation) is the stroke volume (SV). Figure 19.2 demonstrates the pressure-volume loop with the inclusion of controlling parameters.
Ernest Henry Starling spent a great deal of his professional career defining the relation of the heart and its function.3 He examined methods to vary blood volume and measure ventricular filling pressure and cardiac output. He showed that initial muscle fiber length was the prime determinant of work done during the next contraction. Systemic resistance was not considered in Starling’s in vitro studies.4 A plot of preload or VEDV vs. ventricular output or SV at different levels of contractility are generally called Starling or ventricular function curves, as depicted in Figure 19.3. Starling, although recognizing that the ventricular volume at end-diastole was the critical factor influencing cardiac output, measured mean right atrial pressure as his index for preload. Clinicians also often rely on the pressure correlates of VEDV using surrogates for ventricular end-diastolic pressure (VEDP), such as central venous pressure (CVP) for the right ventricle and pulmonary artery wedge
(PAWP) or pulmonary artery occlusive pressure (PAOP) for the left ventricle. This, which will be further discussed in the subsequent text, creates difficulty when examining the role of ventricular compliance and diastolic function on cardiac performance using Starling curves.
(PAWP) or pulmonary artery occlusive pressure (PAOP) for the left ventricle. This, which will be further discussed in the subsequent text, creates difficulty when examining the role of ventricular compliance and diastolic function on cardiac performance using Starling curves.
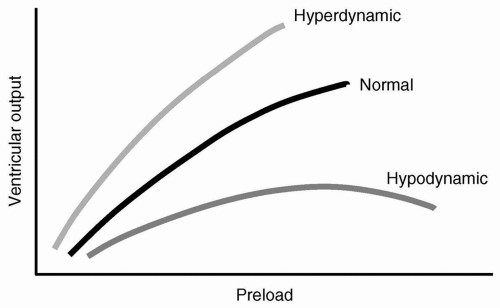 FIGURE 19.3 Starling ventricular function curves demonstrating relation of preload to ventricular output at different levels of contractility. |
For each heart, there is typically a “family” of curves, rather than a single curve. This family, then, allows for variations in contractility: “Higher” curves typically indicate higher contractility, with a higher SV for a given VEDV. Because Starling did not believe that vascular resistance had any negative impact on ventricular function, changes in resistance and afterload cannot be characterized by the Starling curves.
What Are the Diagnostic Categories and Pathophysiology of Shock States?
Shock, and its manifestations, can be defined as a syndrome of failure of the heart to pump volume in sufficient quantity and under sufficient pressure, to maintain the pressure-flow relation for adequate tissue perfusion and the maintenance of aerobic metabolism. Traditional teaching includes three primary categories of shock: (i) Hypovolemic, (ii) cardiogenic, and (iii) septic. This classification fails to recognize other etiologies, including anaphylactic, inflammatory, obstructive, and neurogenic. Whereas obstructive shock results in a decrease in preload leading to a low cardiac output and high resistance, the others mentioned exhibit a similar pathophysiology to septic shock; that is, a low resistance and elevated cardiac output. This has led to the use of the term, hyperdynamic, which is used to characterize any shock state manifested by vasodilation with a compensatory increase in cardiac output. A simplistic approach to any given clinical syndrome of hypoperfusion often leads to a single pathophysiologic diagnosis and treatment related to a single form of shock. However, a better understanding of the pathophysiology shows that frequently, there are mixed shock states, with coexisting components of hypovolemic, cardiogenic, and hyperdynamic shock. A prime example are patients suffering from the systemic inflammatory response syndrome (SIRS).5 These patients frequently exhibit manifestations of hypovolemia (increased capillary permeability and vasodilation). They are also in a hyperdynamic state (vasodilation from microbial toxins and circulating cytokines) and suffer cardiogenic depression (negative inotropic effects of cytokines, microbial toxins, and coronary hypoperfusion).
TABLE 19.1 The Three Common Shock States—Hypovolemic, Cardiogenic, and Hyperdynamic—with Etiologies of Each | ||||||||||||||||||||||||||
|---|---|---|---|---|---|---|---|---|---|---|---|---|---|---|---|---|---|---|---|---|---|---|---|---|---|---|
|
▪ HYPOVOLEMIC SHOCK
Hypovolemic shock encompasses a range of entities in which the effective circulating blood volume is inadequate. Although there are some rather obvious causes of hypovolemic shock, as shown in Table 19.1, including acute blood loss, there are also less obvious causes including acute vasodilation (e.g., loss of sympathetic tone), increased capillary permeability, third-space fluid shifts, and obstruction of venous return (tension pneumothorax and cardiac tamponade).
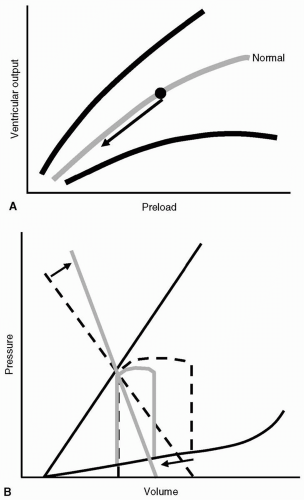
Because the underlying problem is essentially inadequate preload, supportive treatment usually consists of intravascular fluids: Crystalloids, colloids, blood products, and so on. The reduction in preload (VEDV) leads to a decrease in SV, triggering compensatory tachycardia and vasoconstriction. Figure 19.4 shows the graphic representation of hypovolemic shock as depicted by the Starling ventricular function curves (see Fig. 19.4A) and the pressure-volume loop (see Fig 19.4B). The benefit of visualizing the pathophysiology of this shock state using the pressure-volume loop is that not only can the reduction in preload and SV be depicted, but also the compensatory sympathetic and adrenergic-mediated vasoconstriction.
▪ CARDIOGENIC SHOCK
Cardiogenic shock is commonly due to acute cardiac ischemia, which can result from primary coronary hypoperfusion (hypotension, coronary obstruction) or an acute increase in oxygen demand (e.g., hypertensive crisis). Other causes, as shown in Table 19.1, include negative inotropic agents, cytokines, cardiomyopathies and myocarditis, structural cardiac defects, and dysrhythmias. Most of these etiologies are characterized by systolic
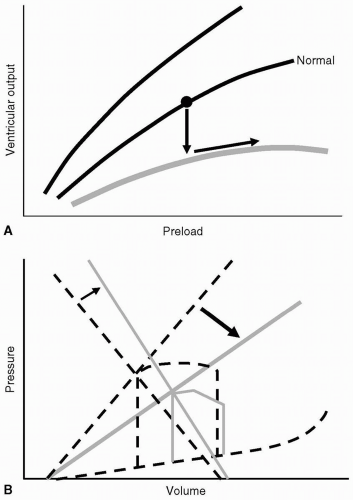
dysfunction with decreased cardiac contractility despite an adequate preload. Diastolic or lusitropic dysfunction results from changes in compliance and altered myocardial relaxation, as in patients with hypertensive cardiomyopathy, myocardial fibrosis, or pericardial disease. Figure 19.5 demonstrates the relation of cardiogenic shock to the ventricular function curves (see Fig. 19.5A) and pressure-volume loop (see Fig. 19.5B). These changes demonstrate the fall in SV (ventricular output) with a compensatory rise in vascular resistance.
dysfunction with decreased cardiac contractility despite an adequate preload. Diastolic or lusitropic dysfunction results from changes in compliance and altered myocardial relaxation, as in patients with hypertensive cardiomyopathy, myocardial fibrosis, or pericardial disease. Figure 19.5 demonstrates the relation of cardiogenic shock to the ventricular function curves (see Fig. 19.5A) and pressure-volume loop (see Fig. 19.5B). These changes demonstrate the fall in SV (ventricular output) with a compensatory rise in vascular resistance.
A limitation of the use of ventricular function curves is that they are unable to demonstrate the uncoupling of VEDP and VEDV in patients with diastolic dysfunction. The decrease in ventricular compliance (see Fig. 19.6) shifts the relation of VEDP and VEDV, in which a normal or even high VEDP may actually reflect a decreased preload (VEDV). In this circumstance, one may erroneously conclude that a patient presenting with pulmonary edema would be best served by vigorous diuresis. Such an approach would decrease lung water, but would also lead to a reduction in SV and systemic organ perfusion.
▪ HYPERDYNAMIC SHOCK
Although traditionally thought of as “septic shock,” this state comprises a variety of entities that do not include an infectious etiology. Table 19.1 shows the etiologies that share a similar hyperdynamic state. The pathophysiology involves a combination of decreased vascular resistance, decreased preload, and unpredictable effects on cardiac output. In states where the main factor is tissue inflammation (e.g., sepsis), cardiocirculatory abnormalities result from the production and liberation of toxic cytokines and, if present, microbial toxins. Increased capillary permeability and vasodilation lead to a profound
reduction in preload; moreover, there is a concomitant increase in heart rate and SV. A high SV is difficult to conceptualize using the ventricular function curves of Starling, because circulating cytokines and toxins depress contractility and systolic function. The evaluation of myocardial performance in most hyperdynamic shock states will demonstrate either no change in contractility or a negative inotropic effect. How then does one explain the apparent paradox of increased SV despite reduced preload? The answer lies in the analysis of the pressure-volume loop. Figure 19.7 demonstrates the changes observed with vasoconstriction and vasodilation while maintaining other hemodynamic parameters constant.
reduction in preload; moreover, there is a concomitant increase in heart rate and SV. A high SV is difficult to conceptualize using the ventricular function curves of Starling, because circulating cytokines and toxins depress contractility and systolic function. The evaluation of myocardial performance in most hyperdynamic shock states will demonstrate either no change in contractility or a negative inotropic effect. How then does one explain the apparent paradox of increased SV despite reduced preload? The answer lies in the analysis of the pressure-volume loop. Figure 19.7 demonstrates the changes observed with vasoconstriction and vasodilation while maintaining other hemodynamic parameters constant.
Figure 19.8 shows that, with decreased impedance to ejection, the heart is able to empty more efficiently and increase its ejection fraction. Therefore, SV and cardiac output are greater, despite a reduction in preload and depressed myocardial contractility.
How Are Heart Rate and Shock Related?
Tachycardia is the most common dysrhythmia in all forms of shock, with the obvious exception of bradydysrhythmias that can occur with cardiogenic shock (e.g., third degree A-V block). Compensatory tachycardia is associated with increased myocardial oxygen demand and decreased supply. The decrease in myocardial oxygen delivery to the myocardium is caused by a decrease in diastolic time. With 70% of coronary perfusion occurring during diastole (predominantly to the left ventricle), shortening of the diastolic time may prove critical and
result in mismatch of myocardial oxygen supply/demand, with resultant coronary ischemia and cardiac failure. However, treatment directed primarily towards reducing heart rate with negative chronotropic agents (β-blockers or Ca++ channel antagonists) will often not be tolerated due their coexisting negative inotropic effects. Instead, efforts should always be predominantly directed towards eradication of the underlying process and improvement of SV.
result in mismatch of myocardial oxygen supply/demand, with resultant coronary ischemia and cardiac failure. However, treatment directed primarily towards reducing heart rate with negative chronotropic agents (β-blockers or Ca++ channel antagonists) will often not be tolerated due their coexisting negative inotropic effects. Instead, efforts should always be predominantly directed towards eradication of the underlying process and improvement of SV.
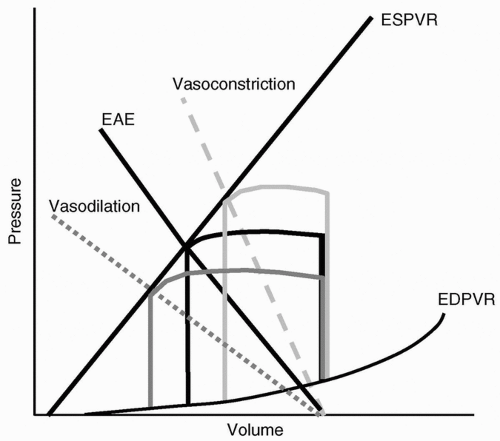 FIGURE 19.7 The effects of vasoconstriction (—) and vasodilation (……) on the effective arterial elastance (EAE,) and resultant effects on ventricular output at a constant preload and contractility, as represented by the pressure-volume loop. EDPVR, end-diastolic pressure-volume relation; ESPVR, end-systolic pressure-volume relation; EAE, effective arterial elastance.
Stay updated, free articles. Join our Telegram channel
Full access? Get Clinical Tree
 Get Clinical Tree app for offline access

|
