Electrocardiogram analysis
After obtaining an electrocardiogram (ECG), you’ll want to read and interpret the findings. Becoming comfortable with ECG analysis will allow you to detect subtle, and sometimes dangerous, changes in your patient’s condition.
Steps in interpretation
When interpreting a patient’s 12-lead ECG, first compare the patient’s previous ECG with the current one, if available. Doing so helps you identify changes. Then follow a systematic approach, first analyzing the recording for technical accuracy and then evaluating the specific components of the waveform.
Assess for technical accuracy
To ensure that the ECG has been recorded properly, follow these steps:
Make sure the baseline is free from electrical interference and drift.
Scan the limb leads I, II, and III. The R-wave voltage in lead II should equal the sum of the R-wave voltage in leads I and III. Lead aVR is typically negative. If these rules aren’t met, the tracing may be recorded incorrectly.
Locate the lead markers on the waveform. Lead markers are the points where one lead changes to another.
Check the standardization markings (1 millivolt or 10 mm) to make sure all leads were recorded with the ECG machine’s amplitude at the same setting. Standardization markings are usually located at the beginning of the strip.
Assess the ECG components
After you’ve ensured that the recording is accurate, focus your
analysis on the various components of the ECG.
analysis on the various components of the ECG.
Assess the heart’s rate and rhythm.
Determine the heart’s electrical axis. Use either the quadrant method or the degree method, which are described later in this chapter.
Examine limb leads I, II, and III. The R wave in lead II should be taller than in lead I. The R wave in lead III should be a smaller version of the R wave in lead I. The P wave or QRS complex may be inverted. Each lead should have flat ST segments and upright T waves. Pathologic Q waves should be absent.
Examine limb leads aVL, aVF, and aVR. The tracings from leads aVL and aVF should be similar, but lead aVF should have taller P and R waves. Lead aVR has little diagnostic value. Its P wave, QRS complex, and T wave should be deflected downward.
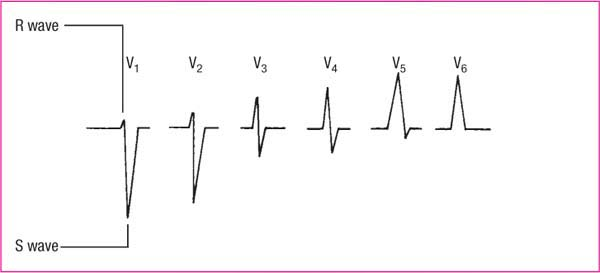
Examine the R wave in the precordial leads. Normally, the R wave—the first positive deflection of the QRS complex—gets progressively taller from lead V1 to V5. It gets slightly smaller in lead V6. (See R-wave progression.)
Examine the S wave (the negative deflection after an R wave) in the precordial leads. It should appear extremely deep in lead V1 and become progressively more shallow, usually disappearing by lead V5.
Analyzing the waveform
On the ECG tracing, each wave represents a component of the cardiac cycle. Therefore, as you examine each lead, note where changes occur so you can identify the area of the heart affected.
P waves
P waves should be upright; however, they may be inverted in lead aVR or biphasic or inverted in leads III, aVL, and V1. Peaked, notched, or enlarged P waves may signify atrial hypertrophy or enlargement. Inverted P waves may signify retrograde conduction. Absent P waves may signify conduction by a route other than the sinoatrial (SA) node.
PR intervals
PR intervals should always be constant, just like QRS-complex durations. Short PR intervals (less than 0.12 second) signify impulses originating somewhere other than the SA node, as in junctional arrhythmias or preexcitation syndromes. Prolonged PR intervals (greater than 0.20 second) signify a conduction delay, such as in heart block or digoxin toxicity.
QRS complex
QRS-complex deflections vary in different leads. A duration greater than 0.12 second may signify ventricular conduction. One or more missing QRS complexes may signify atrioventricular (AV) block or ventricular standstill. Observe for pathologic Q waves. A normal Q wave generally has a duration of under 0.04 second. An abnormal Q wave has either a duration of 0.04 second or more, a depth greater than 4 mm, or a height one-fourth of the R wave.
Related posts:


Stay updated, free articles. Join our Telegram channel

Full access? Get Clinical Tree


