Rhythm strip interpretation
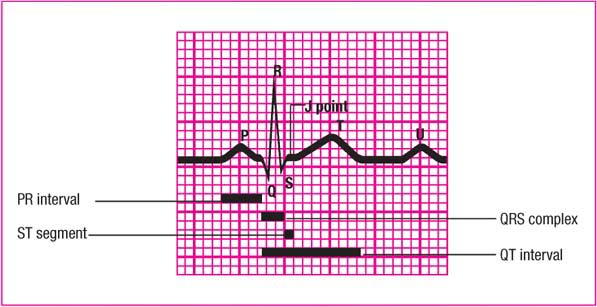
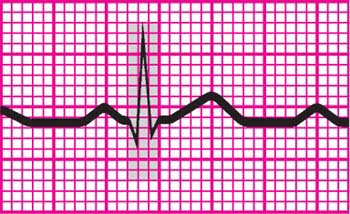
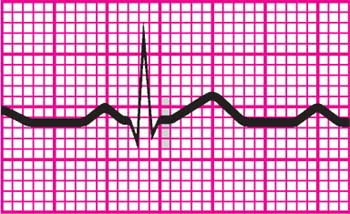
An electrocardiogram (ECG) complex represents the electrical events occurring in one cardiac cycle. A complex consists of five waveforms labeled with the letters P, Q, R, S, and T. The middle three letters—Q, R, and S—are referred to as a unit, the QRS complex. ECG tracings represent the conduction of electrical impulses from the atria to the ventricles. (See ECG waveform components.)
P wave
The P wave is the first component of a normal ECG waveform. It represents atrial depolarization
or conduction of an electrical impulse through the atria. When evaluating a P wave, look closely at its characteristics, especially its location, configuration, and deflection. A normal P wave has these characteristics:
or conduction of an electrical impulse through the atria. When evaluating a P wave, look closely at its characteristics, especially its location, configuration, and deflection. A normal P wave has these characteristics:
 |
Location: precedes the QRS complex
Amplitude: 2 to 3 mm high
Duration: 0.06 to 0.12 second
Configuration: usually rounded and upright
Deflection: positive or upright in leads I, II, aVF, and V2 to V6; usually positive but may vary in leads III and aVL; negative or inverted in lead aVR; biphasic or variable in lead V1.
If the deflection and configuration of a P wave are normal—for example, if the P wave is upright in lead II and is rounded and smooth—and if the P wave precedes each QRS complex, you can assume that this electrical impulse originated in the sinoatrial (SA) node. The atria start to contract partway through the P wave, but you won’t see this on the ECG. Remember that the ECG records electrical activity only, not mechanical activity or contraction.
Peaked, notched, or enlarged P waves may represent atrial hypertrophy or enlargement associated with chronic obstructive pulmonary disease, pulmonary emboli, valvular disease, or heart failure. Inverted P waves may signify retrograde or reverse conduction from the atrioventricular junction toward the atria. Whenever an upright sinus P wave becomes inverted, consider retrograde or reverse conduction as possible conditions.
Varying P waves indicate that the impulse may be coming from different sites, as with a wandering pacemaker rhythm, irritable atrial tissue, or damage near the SA node. Absent P waves may signify conduction by a route other than the SA node, as with a junctional or atrial fibrillation rhythm. When a P wave doesn’t precede the QRS complex, complete heart block may be present. Absence of a P wave doesn’t mean that there isn’t atrial depolarization. The P wave may be buried or hidden in the T wave or the QRS complex.
PR interval
The PR interval tracks the atrial impulse from the atria through the atrioventricular (AV) node, bundle of His, and right and left bundle branches. When evaluating a PR interval, look especially at its duration. Changes in the PR interval indicate an altered impulse formation or a conduction delay, as seen in AV block. A normal PR interval has these characteristics (amplitude, configuration, and deflection aren’t measured):
 |
Location: from the beginning of the P wave to the beginning of the QRS complex
Duration: 0.12 to 0.20 second.
Short PR intervals (less than 0.12 second) indicate that the impulse originated somewhere other than the SA node. This variation is associated with junctional arrhythmias and preexcitation syndromes. Prolonged PR intervals (greater than 0.20 second) may represent a conduction delay through the atria or AV junction due to digoxin toxicity, common cardiac medications (such as beta and calcium channel blockers), or heart block—slowing related to ischemia or conduction tissue disease.
QRS complex
The QRS complex follows the P wave and represents depolarization of the ventricles, or impulse conduction. Immediately after the ventricles depolarize, as represented by the QRS complex, they contract. That contraction ejects blood from the ventricles and pumps it through the arteries, creating a pulse.
Whenever you’re monitoring cardiac rhythm, remember that the waveform you see represents the heart’s electrical activity only. It doesn’t guarantee a mechanical contraction of the heart and a subsequent pulse. The contraction could be weak, as occurs with premature ventricular contractions, or absent, as occurs with pulseless electrical activity. So, before you treat the strip, check the patient.
Pay special attention to the duration and configuration when evaluating a QRS complex.
A normal complex has these characteristics:
A normal complex has these characteristics:
 |
Location: follows the PR interval
Amplitude: 5 to 30 mm high, but differs for each lead used
Duration: 0.06 to 0.10 second, or one-half of the PR interval. Duration is measured from the beginning of the Q wave to the end of the S wave or from the beginning of the R wave if the Q wave is absent.
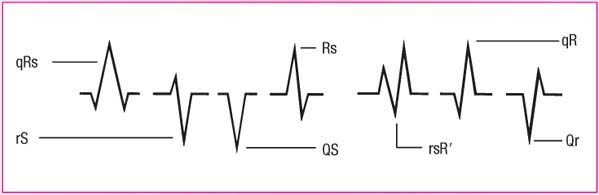
Configuration: consists of the Q wave (the first negative deflection, or deflection below the baseline, after the P wave), the R wave (the first positive deflection after the Q wave), and the S wave (the first negative deflection after the R wave). You may not always see all three waves. The ventricles depolarize quickly, minimizing contact time between the stylus and the ECG paper, so the QRS complex typically appears thinner than other ECG components. The QRS complex may also look different in each lead. (See QRS waveform variety.)
Remember that the QRS complex represents intraventricular conduction time. That’s why identifying and correctly interpreting this complex is so crucial. If no P wave appears with the QRS complex, then the impulse may have originated in the ventricles, indicating a ventricular arrhythmia.
Deep, wide Q waves may represent myocardial infarction. In this case, the Q wave amplitude (depth) is greater than or equal to 25% of the height of the succeeding R wave, or the duration of the Q wave is 0.04 second or more. A notched R wave may signify a bundle-branch block. A widened QRS complex (greater than 0.12 second) may signify a ventricular conduction delay. A missing QRS complex may indicate atrioventricular block or ventricular standstill.
ST segment
The ST segment represents the end of ventricular conduction or depolarization and the beginning of ventricular recovery or repolarization. The point that marks the end of the QRS complex and the beginning of the ST segment is known as the J point.
Pay special attention to the deflection of an ST segment. A normal ST segment has these characteristics (amplitude, duration, and configuration aren’t observed):
 |
Location: extends from the S wave to the beginning of the T wave
Deflection: usually isoelectric (neither positive nor negative); may vary from -0.5 to +1 mm in some precordial leads.
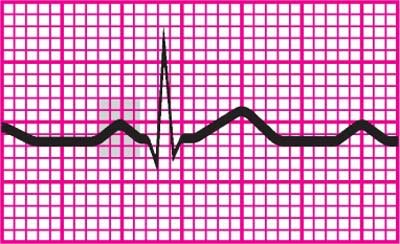
A change in the ST segment may indicate myocardial injury or ischemia. An ST segment may become either elevated or depressed. (See Changes in the ST segment, page 84.)
T wave
The peak of the T wave represents the relative refractory period of repolarization or ventricular recovery. When evaluating a T wave, look at the amplitude, configuration, and deflection.
Normal T waves have these characteristics (duration isn’t measured):
Changes in the ST segment
Related posts:


Stay updated, free articles. Join our Telegram channel

Full access? Get Clinical Tree


