CHAPTER 24 Acute Heart Failure and Pulmonary Edema
ACUTE HEART failure (AHF) is a clinical syndrome of new or worsening signs and symptoms of heart failure (decompensated), often leading to hospitalization or a visit to the emergency department. Patients with AHF represent a heterogeneous population with high postdischarge readmission rates.1–5 Most hospitalized patients have significant volume overload, and congestive symptoms predominate. Fewer patients present with hypotension and symptoms of reduced organ perfusion.1–5 A few patients who come to the emergency department with AHF have “flash pulmonary edema.”1 A few patients have onset of symptoms within 4 hours of arrival; most patients have a slow progression of disease, resulting from cardiac ischemia, medication noncompliance, dietary indiscretion, or exacerbation of hypertension. The average patient has had symptoms for almost 5 days before seeking medical attention.1–5
AHF is the most common cause of hospital admission in patients older than 65 years, accounting for 1 million admissions annually.6 AHF represents a period of high risk for patients, with a 20% to 30% mortality rate within 6 months after admission.7–9 Early care of AHF and time to treatment are linked to outcome. These patients are generally cared for in telemetry units in the United States. Only 10% to 20% of these patients are admitted to intensive care units (ICUs).2,3
Pathophysiologic Considerations
Chronic Progressive Fluid and Water Retention
Arterial underfilling is sensed by mechanoreceptors in the left ventricle, carotid sinus, aortic arch, and renal afferent arterioles.10 Decreased activation of these receptors because of a decrease in systemic arterial pressure, stroke volume, renal perfusion, or peripheral vascular resistance leads to an increase in sympathetic outflow from the central nervous system, activation of the renin-angiotensin-aldosterone system, and the nonosmotic release of arginine vasopressin, as well as the stimulation of thirst.10 These factors together with increased release of endothelin and vasopressin and resistance to natriuretic peptides contribute to sodium and water retention leading to decompensation of chronic heart failure.
Pulmonary Edema
The flux of fluid out of any vascular bed results from the sum of forces promoting extravasation of fluid from the capillary lumen versus forces acting to retain intravascular fluid. This concept of a dynamic equilibration between opposing forces in the lung is given mathematical expression in the Starling equation:11

Under normal conditions, the sum of the forces is slightly positive, producing a small vascular fluid flux into the precapillary interstitium of the lung that is drained as lymph into the systemic veins. The capillary coefficient (Kf) determines the effectiveness of the endothelial barrier to protein permeability, and so determines the effectiveness of the oncotic gradient. Because the intravascular pressure in the pulmonary capillaries is always higher than plasma osmotic pressure, transcapillary fluid flux out of the pulmonary capillary is continuous. When the interstitial fluid exceeds the interstitial space capacity, fluid floods into the alveoli.12 The interstitial space is drained by a rich bed of lymphatics. It is estimated that pulmonary lymph flow may increase threefold before fluid extravasates into the alveolar airspaces. In patients in the ICU, the two most common forms of pulmonary edema are pulmonary edema initiated by an imbalance of Starling forces and pulmonary edema initiated by disruption of one or more components of the alveolar-capillary membrane. Table 24-1 lists the causes of pulmonary edema based on the initiating mechanism.
Table 24–1 Classification of Acute Pulmonary Edema
| Cardiogenic Pulmonary Edema |
| A. Acute Increase in Pulmonary Capillary Pressure |
| 1. Increased LA pressure with normal LV diastolic pressure |
| a. Thrombosed prosthetic mitral valve |
| b. Obstructive left atrial myxoma |
| 2. Increased LA pressure owing to elevated LV diastolic pressure |
| a. Acute increases in myocardial stiffness or impaired relaxation |
| i. Myocardial ischemia |
| ii. Acute myocardial infarction |
| iii. Hypertrophic heart disease complicated by tachycardia or ischemia |
| b. Acute volume load |
| i. Acute mitral or aortic regurgitation |
| ii. Ischemic septal rupture |
| c. Acute pressure load |
| i. Hypertensive crisis |
| ii. Thrombosed prosthetic aortic valve |
| B. Exacerbation of Chronically Elevated Pulmonary Capillary Pressures |
| 1. Increase in elevated LA pressure with normal LV diastolic pressure |
| a. Mitral stenosis |
| b. Left atrial myxoma |
| 2. Increase in elevated LA pressure owing to a further increase in LV diastolic pressure |
| a. Further increases in myocardial stiffness or impaired relaxation |
| i. Cardiomyopathy complicated by myocardial ischemia or infarction |
| ii. Hypertrophic heart disease complicated by tachycardia or ischemia |
| b. Volume load imposed on preexisting LV diastolic dysfunction |
| i. Worsening mitral regurgitation |
| ii. Vigorous postoperative fluid administration |
| iii. Dietary indiscretion |
| c. Pressure load imposed on preexisting LV systolic dysfunction |
| i. Accelerated hypertension |
| Noncardiogenic Pulmonary Edema |
| A. Altered Alveolar Capillary Membrane Permeability (Adult Respiratory Distress Syndrome) |
| 1. Infectious or aspiration pneumonia |
| 2. Septicemia |
| 3. Acute radiation or hypersensitivity pneumonitis |
| 4. Disseminated intravascular coagulopathy |
| 5. Shock lung |
| 6. Hemorrhagic pancreatitis |
| 7. Inhaled and circulating toxins |
| 8. Massive trauma |
| B. Acute Decrease in Interstitial Pressure of the Lung |
| 1. Rapid removal of unilateral pleural effusion |
| C. Unknown Mechanisms |
| 1. High-altitude pulmonary edema |
| 2. Neurogenic pulmonary edema |
| 3. Narcotic overdose |
| 4. Pulmonary embolism |
| 5. After cardioversion |
| 6. After anesthesia or cardiopulmonary bypass |
LA, left atrial; LV, left ventricular.
It has been shown experimentally that pulmonary edema occurs if the pulmonary capillary pressure exceeds the plasma colloid osmotic pressure, which is approximately 28 mm Hg in humans. The normal pulmonary capillary wedge pressure is approximately 8 mm Hg, which allows a margin of safety of about 20 mm Hg in the development of pulmonary edema.13 Although pulmonary capillary pressure must be abnormally high to increase the flow of the interstitial fluid, these pressures may not correlate with the severity of pulmonary edema when edema is clearly present.14 These pressures may have returned to normal when there is still considerable pulmonary edema because time is required for removal of interstitial and pulmonary edema.
The rate of increase in lung fluid at any given elevation of pulmonary capillary pressure is related to the functional capacity of the lymphatics, which may vary from patient to patient, and to variations in osmotic and hydrostatic pressures. Chronic elevations in left atrial pressures are associated with hypertrophy in the lymphatics.15 These lymphatics clear greater quantities of capillary filtrate during acute increases in pulmonary capillary pressure. Clinical experience with patients who have chronically elevated atrial pressures suggests that these patients show minimal or no evidence of interstitial lung edema. The mechanisms by which pulmonary capillary pressure increases when the pumping ability of the ventricle is suddenly impaired are discussed later.
Determinants of Left Ventricular Pump Performance
Cardiac output equals the heart rate multiplied by the stroke volume. The stroke volume is the volume of blood ejected with each heartbeat; the magnitude of the stroke volume is governed by ventricular loading conditions and the contractile state of the myocardium. The factors involved in regulating cardiac output are discussed in Chapter 6. The following discussion briefly reviews the determinants of left ventricular (LV) pump performance as it pertains to a patient with AHF.
Preload
Preload is the force or load acting to stretch the LV fibers at the end of diastole, determining the resting length of the sarcomeres.16 Preload expressed in terms of LV end-diastolic pressure or volume (i.e., dimension) is common, but neglects the confounding influence of the complex geometry of the left ventricle.17 Preload is probably best measured as end-diastolic wall stress because this reflects the interactions between transmural diastolic pressures, ventricular dimensions, and wall thickness. The level of ventricular preload is influenced by multiple variables, including chamber compliance, overall LV performance, intravascular blood volume and venous return, atrial contribution to ventricular filling, intrapericardial and intrathoracic pressures, right ventricular-LV interaction, and pericardial restraint.18
Afterload
Afterload is the force opposing fiber shortening after the onset of ejection.16 This force or stress is not constant because arterial and ventricular pressure changes during ejection. Even if the pressure were constant, the systolic force that the ventricle develops would vary in accordance with a complex relationship between the wall force, ventricular pressure, and ventricular dimension.19 According to the Laplace equation, wall stress (s) is directly proportional to ventricular systolic pressure (P) and radius (R), and is inversely related to wall thickness (h):

Heart Rate
Heart rate affects cardiac output under resting conditions and during exercise. When the heart rate increases, the time available for filling during diastole is substantially abbreviated. When LV diastolic compliance is decreased, tachycardia can produce a decrease in ventricular preload that leads to reduced LV stroke volume despite normal systolic function. In hearts with impaired relaxation (i.e., hypertrophied hearts), a significant increase in heart rate would cause LV filling to occur at the time when the heart is not completely relaxed, which results in increased LV diastolic pressures. In patients with abnormal hearts, tachycardia may cause an exaggerated decrease in stroke volume and an increase in filling pressures.
The normal heart responds to an increase in heart rate by a positive inotropic effect, also known as the treppe or Bowditch phenomenon.20 In a failing or hypertrophied heart, an increase in heart rate may produce a reduction in, or even a reversal of, the normally positive force-frequency effect.21,22 Tachycardia is also likely to increase myocardial oxygen consumption, which may lead to subendocardial ischemia in a heart with a compromised coronary circulation.
Left Ventricular Pressure-Volume Relationships
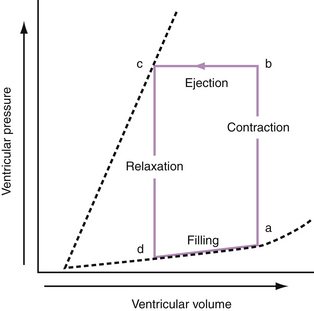
To appreciate fully the factors that contribute to AHF, it is appropriate to review briefly the pressure-volume relationships of normal and diseased hearts. The relationship between pressure and volume throughout the cardiac cycle can be presented as a pressure-volume loop (Fig. 24-1). The pressure-volume loop encapsulates the systolic and diastolic functions of the heart. Because these loops also circumscribe end-systolic and end-diastolic volumes, the stroke volume and ejection fraction can be derived. The bottom limb of the loop, called the diastolic pressure-volume curve, describes LV diastolic compliance. The pressure-volume loop can provide a simple but comprehensive description of LV pump function.
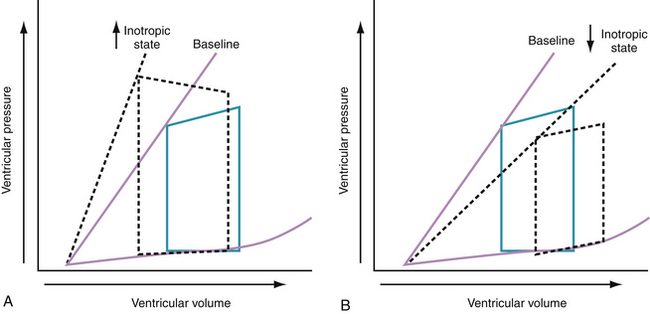
Progressive increases in systolic pressure produce a nearly linear increase in end-systolic volume. By matching the end-systolic pressure and volume coordinates from multiple, variably loaded beats, a near-linear relationship is established. The slope of this relationship (Emax), determined by altering load, reflects LV contractility (see Fig. 24-1).23 A positive inotropic intervention is associated with an increased end-systolic pressure and stroke volume and a decreased end-diastolic volume; this results in an increased Emax and a shift of the pressure-volume relationship to the left (Fig. 24-2A). Conversely, a negative inotropic intervention decreases end-systolic pressure and stroke volume and increases end-diastolic volume; this results in a decrease in Emax and a shift of the pressure-volume relationship to the right (Fig. 24-2B).
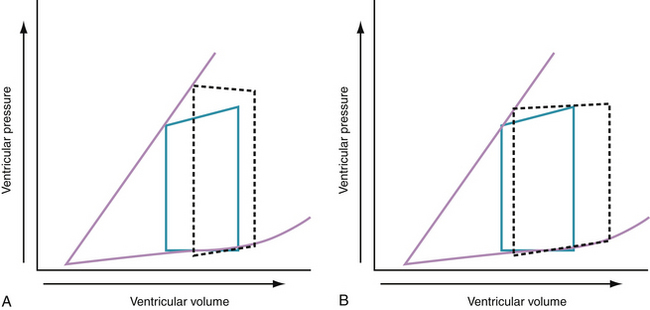
In the intact human heart, an increase in systolic pressure is associated with an increase in end-systolic volume, and if preload does not increase, stroke volume decreases (Fig. 24-3A). An increase in preload is accompanied by an increase in stroke volume and a modest increase in end-systolic pressure (Fig. 24-3B). Acute and chronic changes in the pressure-volume relationship in the failing heart depend on the underlying myocardial structure and function, the type and extent of injury (e.g., infarction or myocarditis, regional or global myocardial depression), and the severity and nature of the hemodynamic load (pressure versus volume).
Chamber Stiffness
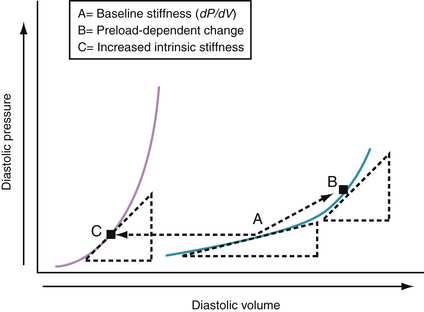
Chamber stiffness is determined by analyzing the curvilinear diastolic pressure-volume relationships (Fig. 24-4). The slope of the tangent (dP/dV) to this curvilinear relationship defines the chamber stiffness at a given filling pressure. An increase in dP/dV because of an increase in volume, shown in Figure 24-4 (A → B), has been called a preload-dependent change in stiffness. When the pressure-volume relationship shifts to the left (A → C), the tangent is steeper at the same diastolic pressure. The latter may be caused by an increase in myocardial mass or intrinsic myocardial stiffness or by changes in several extramyocardial factors. Chamber stiffness of the left ventricle is determined by static factors (e.g., chamber volume, wall mass, stiffness of the wall) and dynamic factors (e.g., pericardium, right ventricle, myocardial relaxation, erectile effects of the coronary vasculature).18,24 Most acute alterations in LV chamber stiffness result from a preload-dependent increase in chamber stiffness, a shift to a different pressure-volume curve, or a combination of the two. All can result in elevated left atrial pressures, pulmonary venous hypertension, and the signs and symptoms of acute heart failure.
Compensatory Mechanisms in Acute Heart Failure
Decreases in blood pressure and cardiac output after an acute depression of LV pump performance cause rapid activation of neurohormonal systems, which generate an acute increase in heart rate and arterial resistance and a decrease in capacity of the venous system.25,26 The decreased systemic vascular capacity after sympathetic activation is brought on predominantly by changes in the splanchnic vascular bed that result in a leftward shift of the venous pressure-volume relationship, causing a redistribution of blood from the unstressed to the stressed circulating pool (i.e., central blood pool).27
Hemodynamic Examples of Acute Heart Failure Syndromes
During the hyperacute phase of myocardial infarction (MI) or with acute ischemia, reduced ventricular ejection increases end-systolic volume (residual volume), and reduced LV compliance increases the filling pressures. It is thought that the lusitropic dysfunction results from an increase in stiffness in the ischemic myocardial segment (possibly caused by slowing and incompleteness of the relaxation process)28 and dilation of the nonischemic segment, causing a preload-dependent increase in chamber stiffness.29 The increase in LV filling pressure that occurs with acute infarction or ischemia is caused by the combination of a preload-dependent increase in chamber stiffness and a leftward shift of the diastolic pressure-volume curve. Increased diastolic pressures after an acute ischemic insult may also result from the redistribution of blood from the periphery to the central blood pool. The effects of these changes on the pressure-volume relationship are shown in Figure 24-5A.
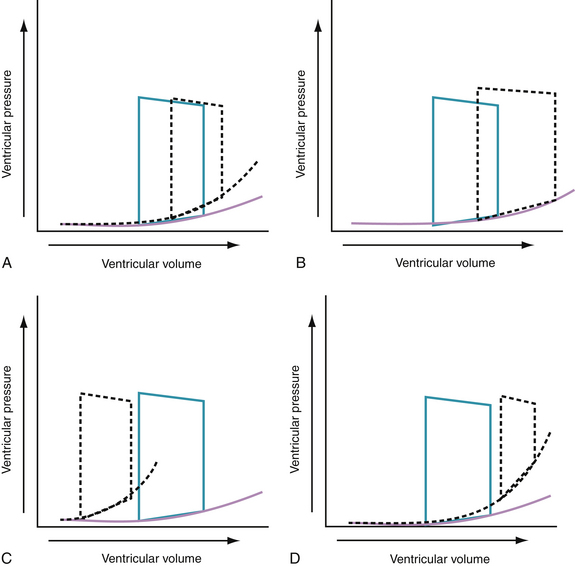
With acute volume overload, as seen in patients with acute mitral or aortic regurgitation or after ischemic septal rupture, the left ventricle dilates and operates on a steeper portion of its pressure-volume curve. Consequently, small increments in volume result in a marked increase in filling pressures. The effects of these changes on the pressure-volume relationship are shown in Figure 24-5B.
The lusitropic abnormalities of LV hypertrophy secondary to aortic stenosis, severe hypertension, or hypertrophic cardiomyopathy probably are caused by abnormalities of the static and dynamic determinants of chamber stiffness. Increased passive stiffness of the hypertrophied heart results in part from the increased myocardial mass and the low volume-to-mass ratio; abnormal intrinsic myocardial stiffness also may contribute to increased chamber stiffness. Abnormalities of myocardial relaxation further impair filling in the hypertrophied heart. The effects of these changes on the pressure-volume relationship are shown in Figure 24-5C.
Chronic heart failure is characterized by a compressed pressure-volume loop. This compressed loop, characterized by a decrease in end-systolic pressure and an increase in end-diastolic pressure, means that the work of the failing heart is reduced, while maintaining a near-normal stroke volume. Comparable to the changes with ischemia, the elevated filling pressures in chronic heart failure probably are caused by a combination of a preload-dependent increase in chamber stiffness (i.e., left ventricle operates at higher end-diastolic volumes to optimize the Starling relationship) and a preload-independent increase in chamber stiffness (Fig. 24-5D). It should also be evident from the pressure-volume curve that these hearts operate near the limit of their preload reserve; they are extremely vulnerable to any myocardial insult. Even a minor insult, such as an arrhythmia, infection, or a small area of infarction, is likely to precipitate acute decompensation in these patients.
Clinical Presentation of Acute Heart Failure
The clinical presentation of AHF is largely related to the degree of fluid overload. The onset and severity of symptoms of AHF vary, and depend importantly on the nature of the underlying cardiac disease and the rate at which the syndrome develops. Patients with AHF have worsening chronic heart failure (70% of all cases), present with heart failure for the first time (25%), or present with advanced or end-stage heart failure—patients who do not respond to treatment (5%). A few patients with AHF present with low blood pressure (<8%) or shock (<3%).30 Most patients are elderly, with an average age of approximately 75 years. The heterogeneity of this patient population is evident when one considers that almost all of these patients have preserved LV ejection fraction, 70% have a history of systemic hypertension, 60% have documented coronary artery disease, 45% have had a prior MI, 30% have a history of atrial fibrillation, 40% have diabetes mellitus, and 30% have underlying chronic obstructive pulmonary disease.30 Secondary mitral regurgitation is common. A patient with AHF may have one of several distinct clinical conditions, as described next.
Decompensation of Chronic Heart Failure
Normotensive Decompensation
Normotensive decompensation occurs in patients with an established diagnosis of heart failure who develop increasing signs or symptoms of decompensation after a period of relative stability. This scenario accounts for greater than 70% of all admissions with heart failure. These patients are usually normotensive. Progressive dyspnea is the most common complaint of patients presenting with decompensated chronic heart failure. The exaggerated uncomfortable awareness of breathing is usually manifest with mild exertion, or even at rest. These patients are often orthopneic. This orthopnea may become so severe that patients cannot lie down at all and must spend the entire night in a sitting position. In addition, some patients experience episodes of paroxysmal nocturnal dyspnea, which usually begins 2 to 4 hours after the onset of sleep and is associated with marked dyspnea followed by coughing, wheezing, and sweating. Family members occasionally report the presence of periodic respiration or cyclic respiration, characterized by periods of apnea followed by hyperventilation (Cheyne-Stokes respiration). This breathing pattern is often a sign of advanced heart failure.
Physical signs vary according to the severity of heart failure and the predominant hemodynamic abnormality. An elevated jugular venous pressure, a positive hepatojugular reflux test, and a tender enlarged liver are frequent findings in these patients. Important physical examination findings include inspiratory, crepitant rales over the lung bases. Rales and wheezing may be heard widely over both lung fields in patients with significant pulmonary congestion. The absence of rales does not imply that the pulmonary venous pressures are not elevated. Diminished air entry at the lung bases is usually caused by a pleural effusion, which is often more frequent in the right pleural cavity than in the left. Leg edema is frequently evident in both legs, particularly in the pretibial region and ankles in ambulatory patients. Sacral edema can be detected in patients who are bedridden.
Hypotensive Decompensation
Related posts:
 Evolution of the Coronary Care Unit: Past, Present, and Future
 Elevated Cardiac Troponin in the Absence of Acute Coronary Syndromes: Mechanism, Significance, and Prognosis
 Conduction Disturbances in Acute Myocardial Infarction
 Antiplatelet Therapy
 Acute Aortic Syndromes: Diagnosis and Management
 Pacemaker and Implantable Cardioverter-Defibrillator Emergencies
Stay updated, free articles. Join our Telegram channel

Full access? Get Clinical Tree


