FIGURE 9.1 The influence of ventricular end-diastolic volume (preload) on end-diastolic pressure and peak systolic pressure. At any given end-diastolic volume, the increment from end-diastolic pressure to peak systolic pressure is a reflection of the strength of ventricular contraction during systole.
Clinical Measures
Ventricular end-diastolic volume is not easily measured at the bedside, and end-diastolic pressure is used as the clinical measure of ventricular preload. The end-diastolic pressure in the right and left ventricles is measured as follows:
1. The pressure in the superior vena cava, also called the central venous pressure (CVP), is equivalent to the right atrial pressure (RAP). In the absence of tricuspid valve dysfunction, the RAP is equivalent to the right ventricular end-diastolic pressure (RVEDP); i.e.,
CVP = RAP = RVEDP
Therefore, the CVP can be used as the filling pressure of the right ventricle when tricuspid valve function is normal.
2. The pulmonary artery wedge pressure (PAWP), which is described in the last chapter, is equivalent to the left atrial pressure (LAP). In the absence of mitral valve dysfunction, the LAP is equivalent to the left ventricular end-diastolic pressure (LVEDP); i.e.,
PAWP = LAP = LVEDP
Therefore, the wedge pressure can be used as the left ventricular filling pressure when mitral valve function is normal.
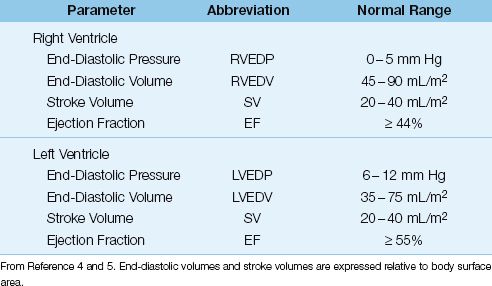
The reference ranges for the CVP and wedge pressures are shown in Table 9.1 (4,5). Note the very low pressure range for the CVP, which helps to promote venous return to the heart. Note also that the wedge pressure is slightly higher than the CVP; the higher pressure in the left atrium closes the flap over the foramen ovale and prevents right-to-left shunting in patients with a patent foramen ovale (about 30% of adults).
Table 9.1 Measures of Right and Left Ventricular Performance
Ventricular Function Curves
The relationship between ventricular end-diastolic pressure and cardiac stroke output is described with ventricular function curves like the ones in Figure 9.2 (6). The principal feature of the normal curve is the steep slope, which results in a 2.5-fold increase in cardiac output over the normal range of right atrial pressure (0–5 mm Hg). This demonstrates the profound effect of ventricular filling on the strength of ventricular contraction, as predicted by the Frank-Starling relationship of the heart. The ventricular function curve is displaced downward in patients with heart failure, indicating that the strength of ventricular contraction is reduced at any given ventricular filling pressure in patients with heart failure.
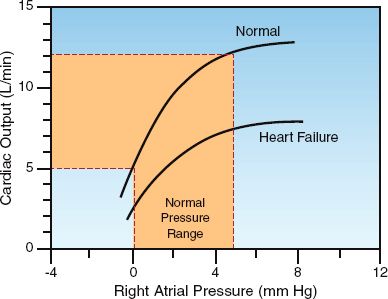
FIGURE 9.2 Ventricular function curves describing the relationship between right atrial pressure and cardiac output. Normal curve is redrawn from Reference 6.
End-Diastolic Pressure vs. Volume
Although the end-diastolic pressure is the clinical measure of preload, clinical studies have shown a poor correlation between end-diastolic pressure and end-diastolic volume (preload) (7–9). This is demonstrated in Figure 9.3, which shows the results of a study that compared measurements of right ventricular end-diastolic pressure (i.e., CVP) and right ventricular end-diastolic volume (RVEDV) before and after a volume challenge with isotonic saline (9). The graph on the left shows the corresponding measures of CVP and RVEDV prior to volume infusion, and the graph on the right shows the corresponding changes in CVP and RVEDV in response to the volume infusion. The distribution of data points in both graphs shows no relationship between CVP and RVEDV, or between changes in CVP and RVEDV. This is confirmed by the correlation coefficients (r) in the upper left corner of each graph. Similar results have been reported for the left ventricle (8,9). These studies indicate that ventricular filling pressures (i.e., CVP and wedge pressures) are unreliable as surrogate measures of ventricular filling.
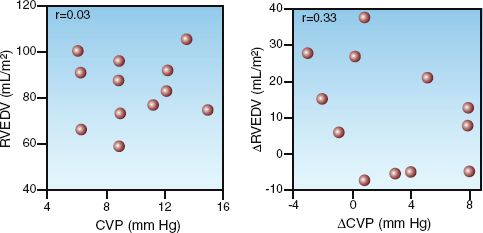
FIGURE 9.3 Graphs showing the relationships between right ventricular end-diastolic pressure (CVP) and right ventricular end-diastolic volume (RVEDV) in healthy adults who received a volume infusion with isotonic saline (3 liters over 3 hours). The graph on the left shows the baseline measurements of CVP and RVEDV, and the graph on the right shows the changes in CVP and RVEDV in response to the volume infusion. The correlation coefficients (r) are shown in the upper left corner of each graph. Graphs redrawn from Reference 9.
The poor correlation between end-diastolic pressures and volume in Figure 9.3 is particularly noteworthy because the subjects were healthy adults with normal cardiac function. When ventricular distensibility is impaired (i.e., diastolic dysfunction), which is common in critically ill patients (10), the discrepancy between end-diastolic pressures and volumes will be greater than usual. The influence of ventricular distensibility on diastolic pressure-volume relationships is described next.
Ventricular Compliance
Ventricular filling is influenced by the tendency of the ventricular walls to stretch during diastole (i.e., distensibility). The more popular term for distensibility is compliance. Ventricular compliance is derived as the ratio of associated changes in end-diastolic volume (∅EDV) and end-diastolic pressure (∅EDP):
 (9.1)
(9.1)
A decrease in ventricular compliance will result in a greater change in EDP for a given change in EDV, or a smaller change in EDV for a given change in EDP.
The influence of compliance on diastolic pressure-volume relationships is shown in Figure 9.4 (11). The lower curve in this figure is from a control subject with no cardiac disease, and the upper curve is from a patient with hypertrophic cardiomyopathy. Note the increased slope of the curve for the hypertrophic cardiomyopathy, indicating a decrease in ventricular compliance. Comparing the position of the two curves shows that, at any given end-diastolic volume, the end-diastolic pressure is higher in the noncompliant ventricle. Therefore, when ventricular compliance is reduced, the end-diastolic pressure will overestimate the end-diastolic volume.
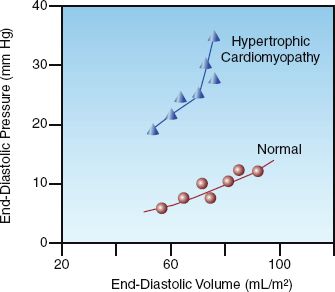
FIGURE 9.4 Diastolic pressure-volume curves for the left ventricle in a control subject and a patient with hypertrophic cardiomyopathy. Data from Reference 11.
Diastolic Heart Failure
In the early stages of cardiac disease where ventricular distensibility is impaired (i.e., diastolic dysfunction), ventricular end-diastolic volume is preserved but end-diastolic pressure rises. As the condition progresses, the progressive increase in end-diastolic pressure eventually results in a decrease in venous return, and this is accompanied by a decrease in ventricular filling and a subsequent decrease in cardiac output. When im-paired ventricular distensibility compromises ventricular filling, the condition is known as diastolic heart failure (11,12).
Diastolic heart failure can be difficult to distinguish from heart failure due to contractile dysfunction (systolic heart failure) because both conditions are associated with increased end-diastolic pressures and a downward shift in the ventricular function curve. (In Figure 9.2, the lower “heart failure” curve could represent diastolic or systolic heart failure.) The changes in end-diastolic pressure (EDP), end-diastolic volume (EDV), and ventricular ejection fraction (EF) in the two types of heart failure are shown below (12):
Systolic Failure: High EDP / High EDV / Low EF
Diastolic Failure: High EDP / Low EDV / Normal EF
The EDV and EF can distinguish diastolic from systolic heart failure. (The EF, which is the ratio of stroke volume to end-diastolic volume, is the standard distinguishing feature. Table 9.1 includes the normal EF for the right and left ventricles). The fact that the EDP and EDV change in opposite directions in diastolic heart failure highlights the discrepancy be-tween EDP and ventricular preload (EDV) when ventricular compliance is reduced.
(Note: The terms “diastolic heart failure” and “systolic heart failure” have recently been abandoned. Diastolic failure is now called “heart failure with normal ejection fraction,” and systolic failure is called “heart failure with a reduced ejection fraction.” These two conditions will be described in more detail in Chapter 13.)
CENTRAL VENOUS PRESSURE
Despite the shortcomings of EDP as a measure of ventricular filling, CVP monitoring continues to be a popular practice in ICUs. However, errors in the CVP measurement are common (13), and this section highlights the potential sources of error.
The Catheter-Transducer Circuit
The catheters used for CVP monitoring are multilumen central venous catheters (15 to 20 cm in length) that are inserted in the subclavian or internal jugular veins and advanced into the superior vena cava. Peri-pherally inserted central catheters (PICCs) are not used for CVP monitoring because of concerns that the length of the catheters (up to 70 cm) will attenuate the pressure signal. However, there is a study showing that PICCs can provide accurate CVP measurements when a continuous infusion of saline (at rates comparable to those used for arterial catheters) is used to maintain catheter patency (14). Monitoring through PICCs is appealing because it eliminates the risks (i.e., arterial puncture and pneumothorax) associated with cannulation of the subclavian and internal jugular veins.
The Reference Level
The CVP is a hydrostatic pressure, so it is important that the fluid-filled transducer is at the same level as the right atrium. The traditional reference point for the right atrium is the intersection of the mid-axillary line (midway between the anterior and posterior axillary folds) and the fourth intercostal space, with the patient in the supine position. An alternative reference point that can be used in the semirecumbent position (up to 60°) is located 5 cm directly below the sternal angle (the angle of Louis), where the sternum meets the second rib (15).
Venous Pressures in the Thorax
The CVP and wedge pressure measurements can be misleading because the recorded pressure differs from the physiologically relevant pressure. This is demonstrated in the illustration in Figure 9.5. The pressure in the superior vena cava (the CVP) is recorded as an intravascular pressure; i.e., the pressure in the blood vessel relative to atmospheric (zero) pressure. However, the pressure that distends the ventricles to allow ventricular filling is the transmural pressure, which is the difference between the intravascular pressure and the surrounding intrathoracic pressure. Therefore, the recorded (intravascular) pressure will reflect the relevant (transmural) pressure only when the intrathoracic pressure is equivalent to atmospheric pressure. This normally occurs at the end of expiration. Therefore, the CVP and wedge pressure should be measured at the end of expiration.
Influence of Intrathoracic Pressure
When intrathoracic pressure changes (i.e., during spontaneous breathing or positive pressure ventilation), the pressure change can be transmitted into the lumen of the veins within the thorax, resulting in a change in the measured (intravascular) pressure without a change in the relevant (transmural) pressure. An example of this phenomenon is shown in the CVP tracing in Figure 9.6. The undulations in this tracing are the result of respiratory changes in intrathoracic pressure that are transmitted into the superior vena cava. Although the recorded (intravascular) pressure is changing, the relevant (transmural) pressure is unchanged. Therefore, respiratory variations in the CVP (and wedge pressure) do not represent changes in ventricular filling pressure. When respiratory variations are evident, the cardiac filling pressure should be measured at the end of expiration, when intrathoracic pressure is normally at atmospheric (zero) level. For the CVP tracing in Figure 9.6, which was recorded during positive-pressure ventilation, the end-expiratory pressure is the lowest pressure on the tracing, so the CVP is 0–3 mm Hg. When respiratory variations occur during spontaneous (negative pressure) breathing, the end-expiratory pressure will be the highest pressure in the tracing.
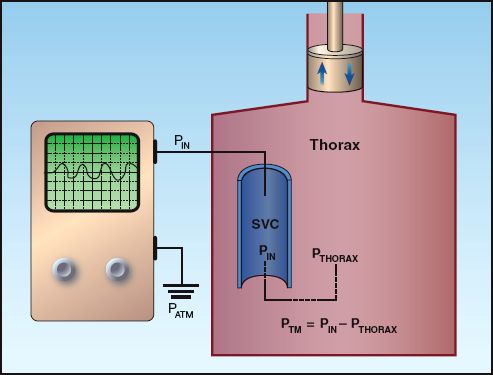
FIGURE 9.5 Illustration showing the difference between the intravascular pressure (PIN) recorded electronically and the transmural pressure (PTM) that is the responsible for distending the ventricles during diastole. PATM = atmospheric pressure; PTHORAX = intrathoracic pressure; SVC = superior vena cava.
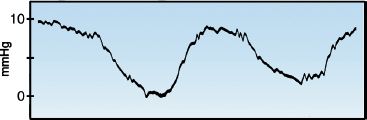
FIGURE 9.6 Respiratory variations in the central venous pressure (CVP).
Positive End-Expiratory Pressure (PEEP)
Positive end-expiratory pressure (PEEP) can falsely elevate the cardiac filling pressures at end-expiration because the intrathoracic pressure is higher than atmospheric pressure. When PEEP is applied during mech-anical ventilation (which is a routine practice), the patient can be briefly disconnected from the ventilator to measure the CVP (16). For patients with “intrinsic PEEP” (caused by incomplete emptying of the lungs), accurate measurement of the cardiac filling pressures can be difficult (17). Chapter 28 includes a description of intrinsic PEEP, and a method for correcting the effect of intrinsic PEEP on the recorded filling pressures.
Variability
The CVP and wedge pressure can vary spontaneously by as much as 4 mm Hg (18), so changes in these pressures must exceed 4 mm Hg to be considered clinically significant.
VENTRICULAR AFTERLOAD
Definition of Afterload
When a weight is attached to one end of a contracting muscle, the force of muscle contraction must be enough to lift the weight before the muscle begins to shorten. The weight in this situation represents a force called the afterload, which is the load imposed on a muscle after the onset of muscle contraction. Unlike the preload force, which facilitates muscle contraction, the afterload force opposes muscle contraction. In the intact heart, the afterload force is equivalent to the peak tension developed across the wall of the ventricles during systole (3). Afterload is thus the wall stress associated with ejection of the stroke volume.
Law of Laplace
The determinants of ventricular wall tension are derived from observations on soap bubbles made by the Marquis de Laplace in 1820. His observations are expressed in the Law of Laplace, which states that the wall tension in a thin-walled sphere is directly related to the chamber pressure and the radius of the sphere: A modified version of the Laplace Law is shown below.
 (9.2)
(9.2)
When the Laplace relationship is applied to the heart, the relevant pressure is the peak transmural pressure across the ventricle during systole, and the relevant radius is the end-diastolic radius of the ventricular chamber. The relationships in equation 9.2 allow the following statements:
1. The greater the peak transmural pressure during systole, the greater the wall stress.
2. The larger the ventricular chamber size, the greater the wall stress.
3. The greater the ventricular hypertrophy, the less the wall stress.
Components of Afterload
The forces that contribute to ventricular afterload can be identified by their relationship to the variables in the Laplace equation. This is demonstrated by the flow diagram in Figure 9.7. The component forces of ventricular afterload include end-diastolic volume (preload), pleural pressure, vascular impedance, and peripheral vascular resistance. Each of these forces is briefly described in this section.
Pleural Pressure
Since afterload is a transmural wall tension, it will be influenced by the pleural pressure surrounding the heart.
NEGATIVE PLEURAL PRESSURE: Negative pressure surrounding the heart will impede ventricular emptying by opposing the inward movement of the ventricular wall during systole (19,20). This effect is responsible for the transient decrease in systolic blood pressure that occurs during the inspiratory phase of spontaneous breathing. When the inspiratory drop in systolic pressure is greater than 15 mm Hg, the condition is called “pulsus paradoxus” (which is a misnomer, since the response is not paradoxical, but is an exaggeration of the normal response).
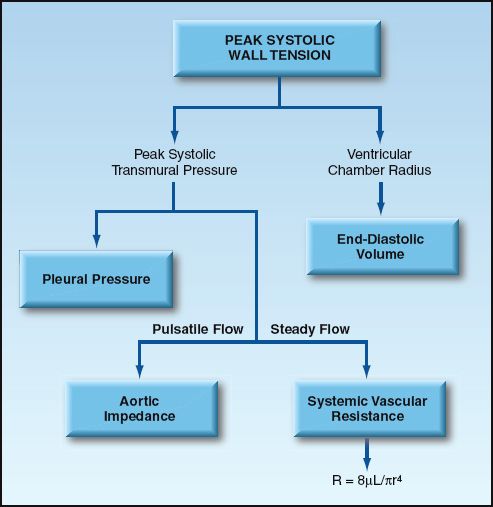
FIGURE 9.7 The forces that contribute to ventricular afterload. See text for explanation.
POSITIVE PLEURAL PRESSURE: Positive pressures surrounding the heart will promote ventricular emptying by facilitating the inward movement of the ventricular wall during systole (19,21). This effect is responsible for the phenomenon shown in Figure 9.8. The tracings in this figure show the effect of a positive-pressure lung inflation on the arterial blood pressure. Note that when intrathoracic pressure rises during a positive-pressure breath, there is a transient rise in systolic blood pressure (reflecting an increase in the stroke output of the heart). The inspiratory rise in blood pressure during mechanical ventilation is known as “reverse pulsus paradoxus.”
The “unloading” effect of positive intrathoracic pressure is the basis for the use of positive-pressure breathing as a “ventricular assist” maneuver for patients with advanced heart failure (21,22). The cardiovascular ef-fects of mechanical ventilation are described in more detail in Chapter 25.
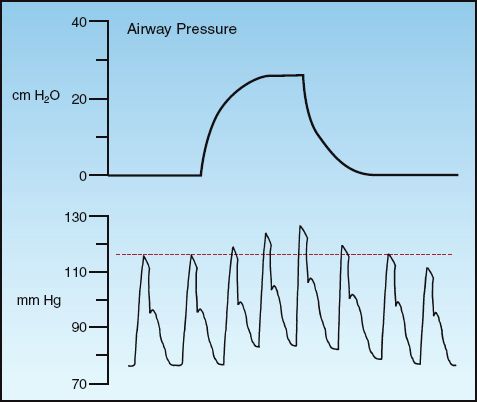
FIGURE 9.8 Changes in arterial blood pressure in response to a positive-pressure breath.
Vascular Components
The stroke output of the left ventricle produces pulsatile pressure and flow patterns in the aorta and major arteries, but the phasic changes in pressure and flow are progressively dampened as the blood moves peri-pherally, and by the time the blood reaches the small peripheral arterioles, pressure and flow are steady and non-pulsatile. The force that op-poses pulsatile flow is known as impedance, and the force that opposes steady flow is resistance.
IMPEDANCE: Vascular impedance is the force that opposes the rate of change in pressure and flow, and it is expressed primarily in the large, proximal arteries, where pulsatile flow is predominant. Impedance in the ascending aorta is considered the principal afterload force for the left ventricle, and impedance in the main pulmonary arteries is considered the principal afterload force for the right ventricle (23). Vascular impedance is a dynamic force that changes frequently during a single cardiac cycle, and it is not easily measured in the clinical setting.
RESISTANCE: Vascular resistance is the force that opposes non-pulsatile or steady flow, and is expressed primarily in small, terminal blood vessels, where non-pulsatile flow is predominant. About 75% of the vascular resistance is in arterioles and capillaries (24). Vascular resistance is calculated as described next, but the relevance of these calculations is questioned.
Vascular Resistance
The resistance (R) to steady flow in a hydraulic circuit is directly related to the driving pressure across the circuit (Pin – Pout), and inversely related to the rate of steady flow (Q) through the circuit:
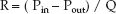 (9.3)
(9.3)
Applying these relationships to the systemic and pulmonary circulations yields the following equations for systemic vascular resistance (SVR) and pulmonary vascular resistance (PVR):
 (9.4)
(9.4)
 (9.5)
(9.5)
where MAP = mean arterial pressure, RAP = right atrial pressure, PAP = mean pulmonary artery pressure, LAP = left atrial pressure, and CO = cardiac output. The normal values for SVR and PVR are included in Table 8.1 in Chapter 8. As mentioned in that chapter, the PVR and SVR are not considered to be accurate representations of the resistance to flow in the pulmonary and systemic circulations (25). This is particularly the case in the systemic circulation, where the actual resistance to flow is an immeasurable mix of flow resistances in multiple vascular beds.
Vascular Resistance and Afterload
Because vascular impedance is not easily measured, vascular resistance is often used as a clinical measure of ventricular afterload. However, animal studies have shown a poor correlation between direct measures of ventricular wall tension (true afterload) and the calculated vascular resistance (26). This is consistent with the notion that vascular impedance (i.e., the force opposing pulsatile flow) is the principal afterload force for ventricular emptying (25). However, the contribution of vascular resistance to afterload cannot be determined with the SVR and PVR because these parameters do not represent the actual resistance to flow in the circulatory system. In the next section, the role of vascular resistance as a force that opposes cardiac output is described using the factors that determine vascular resistance.
PERIPHERAL BLOOD FLOW
As mentioned earlier, the design of the heart as an intermittent stroke pump results in a phasic or pulsatile pattern of pressure and flow in the large, proximal arteries. As the blood moves away from the heart, the arterial circuit acts to progressively dampen the pulsatile pattern of pressure and flow, culminating in a non-pulsatile or steady flow rate by the time the blood reaches the microcirculation. (Steady flow permits more efficient exchange in the microcirculation.) The pulsations in the proximal arteries represent wasted cardiac work (i.e., not involved in promoting capillary flow and exchange), whereas the maintenance of steady flow in peripheral blood vessels represents the energy-efficient portion of cardiac work.
Resistance to Steady Flow
Because flow in the peripheral circulation is predominantly non-pulsatile, it can be described with the Hagen-Poiseuille equation, which identifies the determinants of steady flow through small rigid tubes (27). This equation is shown below, and is also included in Chapter 1 to describe flow through vascular catheters.
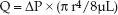 (9.6)
(9.6)
According to this equation, steady flow (Q) through a rigid tube is directly related to the pressure gradient along the tube (∅P) and the fourth power of the radius (r) of the tube, and is inversely related to the length (L) of the tube and the viscosity (µ) of the fluid. The final term in the equation is the reciprocal of resistance (1/R), so resistance to flow can be described as:
 (9.7)
(9.7)
This equation identifies the radius of blood vessels as the single most important factor in determining the resistance to steady flow in the peripheral circulation; i.e., a two fold increase in vessel radius will result in a 16-fold increase in flow rate (r4 × r4 = r16). This highlights the importance of vasodilator therapy for promoting cardiac output in patients with heart failure.
Blood Viscosity
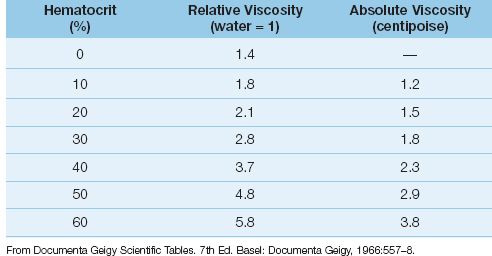
According to equations 9.6 and 9.7, steady flow will vary inversely with changes in the viscosity (µ) of blood. Viscosity is defined as the resistance of a fluid to changes in flow rate (28), and has also been called the “gooiness” of a fluid (29). The viscosity of whole blood is the result of cross-linking of erythrocytes by plasma fibrinogen, and the principal determinant of whole blood viscosity is the concentration of erythrocytes (the hematocrit). The influence of hematocrit on blood viscosity is shown in Table 9.2. Note that blood viscosity can be expressed in absolute or relative terms (relative to water). The viscosity of plasma (zero hematocrit) is only slightly higher than that of water, while the viscosity of whole blood at a normal hematocrit (45%) is about 3 times greater than plasma and about 4 times greater than water. The influence of hematocrit on blood viscosity is the single most important factor that determines the hemodynamic effects of anemia and blood transfusions (see later).
Table 9.2 Relationship Between Hematocrit and Blood Viscosity
Shear Thinning
The viscosity of some fluids varies inversely with changes in the velocity of flow (28). Blood is one of these fluids. (Another is ketchup, which is thick and difficult to get out of the bottle, but once it starts to flow, it thins out and flows more easily.) The velocity of blood flow increases as the blood vessels narrow (like the nozzle on a garden hose works), and the velocity of plasma increases more than the velocity of erythrocytes. This results in a relative increase in plasma volume (and a decrease in blood viscosity) in the small, peripheral blood vessels. This process is called shear thinning (shear is a tangential force that influences flow rate), and it facilitates flow through small vessels.
Influence on Cardiac Output
The influence of blood viscosity on cardiac output is shown in Figure 9.9. The data in this graph is from a patient with polycythemia who was treated with phlebotomy to achieve a therapeutic reduction in hematocrit and blood viscosity (30). The progressive decrease in hematocrit is associated with a steady rise in cardiac output, and the change in cardiac output is proportionally greater than the change in hematocrit. The disproportionate increase in cardiac output can be explained by the inverse relationship between blood viscosity and flow velocity; i.e., as cardiac output is increased in response to hemodilution, the increase in flow velocity will result in a further reduction in viscosity, which will then lead to a further increase in cardiac output, and so one. This process magnifies the influence of blood viscosity on cardiac output.
Clinical Relevance
Viscosity is rarely measured in the clinical setting because of the concern that in vitro measurements of viscosity do not take into account in vivo conditions like shear thinning that influence viscosity and blood flow. Despite the lack of meaningful measurements, viscosity is an important consideration for understanding the hemodynamic effects of conditions like anemia, blood transfusions, and dehydration.
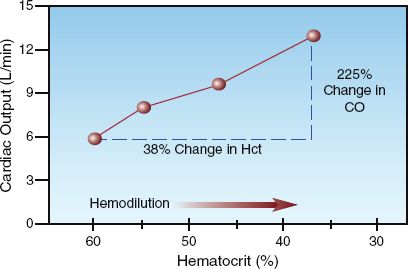
FIGURE 9.9 The influence of progressive hemodilution on cardiac output in a patient with polycythemia. CO = cardiac output. Data from Reference 30.
A FINAL WORD
One of the distinguishing features of critical care medicine is the opportunity to apply basic principles of cardiovascular and respiratory physiology to bedside patient care. This, of course, requires a working knowledge of the concepts in this chapter (and the ones in Chapters 10, 20, and 25). Some of the salient points in this chapter are summarized below.
1. The heart is a volume-regulated stroke pump, and the ventricular end-diastolic volume (preload) is the major determinant of the strength of ventricular contraction.
2. Ventricular filling pressures (i.e., the CVP and wedge pressure) are used as a surrogate measure of ventricular filling volumes, but are unreliable.
3. When ventricular compliance is reduced, which is common in critically ill patients, ventricular filling pressures will overestimate ventricular filling volumes.
4. Pleural pressure can have a significant effect on ventricular emptying. Negative pleural pressure impedes ventricular emptying, and positive pleural pressure promotes ventricular emptying.
5. Ventricular afterload has several component forces, and is not measurable.
REFERENCES
1. Vogel S. Vital circuits. New York: Oxford University Press, 1992:1–17.
2. Aristotle. De Partibus Animalum. circa 350 B.C.: p 645, first column, line 16.
Ventricular Preload
3. Opie LH. Mechanisms of cardiac contraction and relaxation. In Libby P, Bonow RO, Mann DL, Zipes DP (eds). Braunwald’s Heart Disease: A Text-book of Cardiovascular Medicine. 8th ed., Philadelphia: Saunders Elsevier, 2008:509–539.
4. Rudski LG, Lai WW, Afilalo J, et al. Guidelines for the echocardiographic assessment of the right heart in adults: A report from the American Society of Echocardiography. J Am Soc Echocardiogr 2010; 23:685–713.
5. Lang RM, Bierig M, Devereux RB, et al. Recommendations for chamber quantification: A report from the American Society of Echocardiography’s Guidelines and Standards Committee and the Chamber Quantification Working Group, in conjunction with the European Association of Echocar-diography. J Am Soc Echocardiogr 2005; 18:1440–1463.
6. Guyton AC, Jones CE, Coleman TH. Patterns of cardiac output curves. In Circulatory Physiology: Cardiac Output and its Regulation. 2nd ed., Philadelphia: W.B. Saunders, 1973:158–172.
7. Nahouraii RA, Rowell SE. Static measures of preload assessment. Crit Care Clin 2010; 26:295–305.
8. Hansen RM, Viquerat CE, Matthay MA, et al. Poor correlation between pulmonary arterial wedge pressure and left ventricular end-diastolic volume after coronary artery bypass graft surgery. Anesthesiology 1986; 64:764–770.
9. Kumar A, Anel R, Bunnell E, et al. Pulmonary artery occlusion pressure and central venous pressure fail to predict ventricular filling volume, cardiac performance, or the response to volume infusion in normal subjects. Crit Care Med 2004; 32:691–699.
10. Saleh M, Viellard-Baron A. On the role of left ventricular diastolic dysfunction in the critically ill patient. Intensive Care Med 2012; 38:189–191.
11. Mandinov L, Eberli FR, Seiler C, Hess OM. Diastolic heart failure. Cardiovasc Res 2000; 45:813–825.
12. Paulus WJ, Tschope C, Sanderson JE, et al. How to diagnose diastolic heart failure: a consensus statement on the diagnosis of heart failure with normal left ventricular ejection fraction by the Heart Failure and Echocardiography Association of the European Society of Cardiology. Europ Heart J 2007; 28:2539–2550.
Central Venous Pressure
13. Figg KK, Nemergut EC. Error in central venous pressure measurement. Anesth Analg 2009; 108:1209–1211.
14. Black IH, Blosser SA, Murray WB. Central venous pressure measurements: peripherally inserted catheters versus centrally inserted catheters. Crit Care Med 2000; 28:3833–3836.
15. Magder S. Central venous pressure: A useful but not so simple measurement. Crit Care Med 2006; 34:2224–2227.
16. Pinsky M, Vincent J-L, De Smet J-M. Estimating left ventricular filling pressure during positive end-expiratory pressure in humans. Am Rev Respir Dis 1991; 143:25–31.
17. Teboul J-L, Pinsky MR, Mercat A, et al. Estimating cardiac filling pressure in mechanically ventilated patients with hyperinflation. Crit Care Med 2000; 28:3631–3636.
18. Nemens EJ, Woods SL. Normal fluctuations in pulmonary artery and pulmonary capillary wedge pressures in acutely ill patients. Heart Lung 1982; 11:393–398.
Ventricular Afterload
19. Pinsky MR. Cardiopulmonary interactions: the effects of negative and positive changes in pleural pressures on cardiac output. In Dantzger DR (ed). Cardio-pulmonary critical care. 2nd ed. Philadelphia: WB Saunders, 1991:87–120.
20. Hausnecht N, Brin K, Weisfeldt M, Permutt s, Yin F. Effects of left ventricular loading by negative intrathoracic pressure in dogs. Circ Res 1988; 62:620–631.
21. Yan AT, Bradley TD, Liu PP. The role of continuous positive airway pressure in the treatment of congestive heart failure. Chest 2001; 120:1675–1685.
22. Boehmer JP, Popjes E. Cardiac failure: Mechanical support strategies. Crit Care Med 2006; 34(Suppl):S268–S277.
23. Nichols WW, O’Rourke MF. Input impedance as ventricular load. In: McDonald’s Blood Flow in Arteries, 3rd ed. Philadelphia: Lea & Febiger, 1990:330–342.
24. Nichols WW, O’Rourke MF. The nature of flow of a fluid. In: McDonald’s Blood Flow in Arteries, 3rd ed. Philadelphia: Lea & Febiger, 1990:27.
25. Pinsky MR. Hemodynamic monitoring in the intensive care unit. Clin Chest Med 2003; 24:549–560.
26. Lang RM, Borrow KM, Neumann A, et al. Systemic vascular resistance: an unreliable index of left ventricular afterload. Circulation 1986; 74:1114–1123.
Peripheral Blood Flow
27. Chien S, Usami S, Skalak R. Blood flow in small tubes. In Renkin EM, Michel CC (eds). Handbook of Physiology. Section 2: The cardiovascular system. Volume IV. The microcirculation. Bethesda: American Physiological Society, 1984:217–249.
28. Merrill EW. Rheology of blood. Physiol Rev 1969; 49:863–888.
29. Vogel S. Life in Moving Fluids. Princeton: Princeton University Press, 1981:11–24.
30. LeVeen HH, Ahmed N, Mascardo T, et al. Lowering blood viscosity to overcome vascular resistance. Surg Gynecol Obstet 1980; 150:139–149.
31. Lowe GOD. Blood rheology in vitro and in vivo. Bailleres Clin Hematol 1987; 1:597.
32. Reggiori G, Occhipinti G, de Gasperi A, et al. Early alterations of red blood cell rheology in critically ill patients. Crit Care Med 2009; 37:3041–3046.


Stay updated, free articles. Join our Telegram channel

Full access? Get Clinical Tree


