American Heart Association, 1951
About 60 years have elapsed since the warning in the introductory quote, yet the same imprecise method continues to be the accepted standard for the measurement of arterial blood pressure (1). (This is not good news for the 75 million people in the United States with hypertension, who have a diagnosis that is based on a flawed measurement.) The accuracy of the standard (noninvasive) blood pressure measurement is even more of a problem in patients who are hemodynamically unstable (for reasons described later), and blood pressure monitoring in these patients often requires direct intra-arterial pressure recordings. This chapter describes the indirect and direct methods of blood pressure monitoring, and the problems associated with each method.
INDIRECT METHODS
Although the blood pressure measurement is one of the most frequently performed measurements in clinical practice, observational studies have shown that almost no one measures the blood pressure properly (i.e., according to the guidelines of the American Heart Association). In surveys that included primary care physicians, nurses, medical specialists, and surgeons (3), none of the examinees measured the blood pressure correctly (2,3). In one of these studies (3), only 3% of the general practitioners and 2% of the nurses obtained blood pressure measurements that were reliable (3).
The American Heart Association publishes guidelines for the indirect blood pressure measurement, and these are included in the bibliography at the end of this chapter (1). The principal recommendations from these guidelines are included in this section.
Sphygmomanometry
The indirect blood pressure is measured with a device called a sphygmomanometer (sphygmos is the Greek term for pulse, and manometer is a pressure measuring device) which consists of an inflatable bladder covered by a cloth sleeve, and a gauge or column of mercury to measure pressure. The cloth sleeve is wrapped around the upper arm or thigh in an area that overlies a major artery (usually the brachial artery), and the bladder in the sleeve is inflated to compress the underlying artery.
The effects of arterial compression are illustrated in Figure 7.1. As the cuff pressure increases and the underlying artery is compressed, the pulsations in the artery gradually increase and then decrease until the artery is occluded. These “counterpulsations” produce oscillations in cuff pressure (as shown in the figure), and measuring these pressure oscillations is the basis for the oscillometric method of blood pressure recording. Counterpulsations can also be converted into sound waves, which is the basis for the auscultation method of measuring blood pressure.
Dimensions of the Bladder
Counterpulsations are more reproducible, and blood pressure measurements are more reliable, when an artery is compressed uniformly. The tendency for cuff inflation to produce uniform compression of an underlying artery is determined by the dimensions of the inflatable bladder in the cuff and the circumference of the upper arm or thigh. The optimal relationships between the dimensions of the cuff bladder and the circumference of the upper arm are shown in Figure 7.2. To produce uniform arterial occlusion, the length of the bladder should be at least 80% of the circumference of the upper arm (measured midway between the shoulder and elbow), and the width of the bladder should be at least 40% of the upper arm circumference (1). If the cuff bladder is too small for the size of the upper arm, the pressure measurements will be falsely elevated (1). Errors in measurement are much less pronounced when the cuff bladder is inappropriately large relative to arm circumference.

FIGURE 7.1 Comparison of the auscultation method and oscillometric method of blood pressure measurement. See text for explanation.
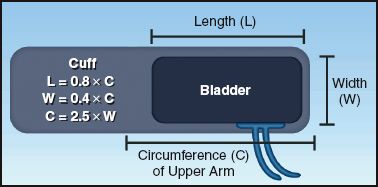
FIGURE 7.2 Optimal relationships between the width (W) and length (L) of the cuff bladder and the circumference (C) of the upper arm.
Miscuffing
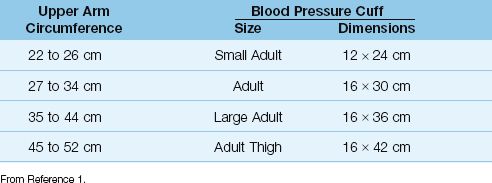
A mismatch between cuff size and limb size (called miscuffing) is the most common source of error in indirect blood pressure measurements (1–4). To indicate the magnitude of this problem, one study showed that 97% of primary care physicians routinely used blood pressure cuffs of inappropriate size (2). Most cases (80–90%) of miscuffing involve cuffs that are too small for the size of the upper arm (1,2). As an aid in selecting the appropriate cuff size, Table 7.1 shows the recommended cuff sizes for upper arm circumferences ranging from 22 cm (about 9 inches) to 52 cm (about 21 inches). An easier way to determine the appropriate cuff size is de-scribed next.
Simple Method to Assess Cuff Size
Align the cuff so that the long axis runs along the long axis of the arm. Then turn the cuff over so the bladder on the underside is facing you, and wrap the cuff around the upper arm. The bladder (width) should encircle close to half (40%) of the upper arm (circumference). If the bladder encircles less than half of the upper arm, the cuff is too small, and the blood pressure measurement will be spuriously elevated. No change in cuff size is needed if the cuff bladder is too big (i.e., if it encircles more than half of the upper arm) because the errors in measurement in this situation are small or nonexistent (1).
Table 7.1 Appropriate Size of Blood Pressure Cuff in Relation to Upper Arm Circumference
Auscultation Method
The auscultatory method used today is the same one introduced in 1904 by a Russian surgeon named Nicolai Korotkoff (5). This method is being replaced by the oscillometric method for noninvasive blood pressure measurements in the ICU, so it will not be described in detail here. The following are some salient points about the auscultatory method from the American Heart Association guidelines (1).
1. If the patient is in the sitting position, the arm and the back should be supported. Otherwise, the diastolic pressure reading can be falsely elevated.
2. Use the bell-shaped head of the stethoscope to listen for the sounds generated during cuff deflation (called Korotkoff sounds). These sounds have a very low frequency (25 to 50 Hz) (6), and the bell-shaped head of a stethoscope is a low-frequency transducer.
3. Don’t place the head of the stethoscope under the blood pressure cuff, as this creates sounds during cuff deflation that will interfere with detection of the Korotkoff sounds.
4. The rate of cuff deflation should not exceed 2 mm Hg/sec. More rapid deflation rates can lead to underestimation of the systolic pressure and overestimation of diastolic pressure.
5. The disappearance of the Korotkoff sounds (Phase V) is used as the diastolic pressure. However, in high-output conditions (e.g., anemia, pregnancy), the sounds can continue long after cuff deflation. When this occurs, the diastolic pressure is indeterminate. In pregnancy, some recommend that the point where the Korotkoff sounds become muffled (Phase IV) be used as the diastolic pressure.
Oscillometric Method
First introduced in the mid-1970s, automated oscillometric devices have become the standard method of blood pressure monitoring in all areas of the hospital (including ICUs). As mentioned earlier, the oscillometric method is designed to measure pulsatile pressure changes that appear during arterial compression and decompression. As in the auscultation method, a cuff is wrapped around the upper arm and inflated to occlude the underlying brachial artery. As the cuff deflates and the artery re-opens, the pulsatile pressure changes illustrated in Figure 7.1 are transmitted from the artery to the blood pressure cuff. The pulsatile cuff pressures are then processed electronically to determine the mean, systolic, and diastolic pressures (7). The conversion of pulsatile pressures into the standard measures of blood pressure (i.e., systolic, diastolic, and mean pressures) is accomplished by proprietary algorithms that are developed by the companies that manufacture oscillometric recording devices. These algorithms can vary with each manufacturer, and their proprietary nature makes them unavailable for critical evaluation. This lack of standardization is a major problem with the oscillometric technique (7,8).
The most accurate measurement provided by the oscillometric method is the mean arterial pressure, which corresponds to the point where the pulsatile pressures reach maximum amplitude (see Figure 7.1). Mean pressures determined with the maximum-amplitude algorithm are often within 5 mm Hg of the intraarterial pressures (7). However, in patients with noncompliant arteries (e.g., elderly patients and those with peripheral vascular disease), mean pressures measured by oscillometry can be 40% lower than intraarterial pressures (1,7).
There is less agreement about the relationship of the systolic and diastolic pressures to the oscillations in cuff pressure. As a result, the systolic and diastolic pressures are less reliable than the mean pressure. The diastolic pressure is the most problematic because the arterial pulsations do not disappear at the diastolic pressure (unlike the disappearance of the Korotkoff sounds at the diastolic pressure), so it is difficult to determine exactly when the diastolic pressure occurs in relation to the oscillating cuff pressures.
Accuracy
The limited accuracy of indirect blood pressure measurements is magnified in critically ill patients, and this is demonstrated in Figure 7.3. The data in this figure is from two studies comparing direct intraarterial pressures with pressures obtained with the auscultation method (in patients with circulatory shock) and with the oscillometric method (in unselected ICU patients) (4,9). All auscultatory pressures differed from the intraarterial pressures by more than 10 mm Hg (which is the threshold for an unacceptable difference), and the discrepancy was more than 20 mm Hg in almost three-quarters of the measurements (auscultatory pressures were always lower than intraarterial pressures). The discrepancy for oscillometric pressures was unacceptable in 61% of measurements.
The particularly poor performance of the auscultatory method in pa-tients with circulatory shock is the result of reduced systemic flow (from hypotension and vasopressors), which curtails the arterial counterpulsations and reduces the intensity of the Korotkoff sounds. Since reliable blood pressure measurements are essential in the management of circulatory shock (e.g., to guide fluid resuscitation), direct measurements of intraarterial pressure is the consensus recommendation.
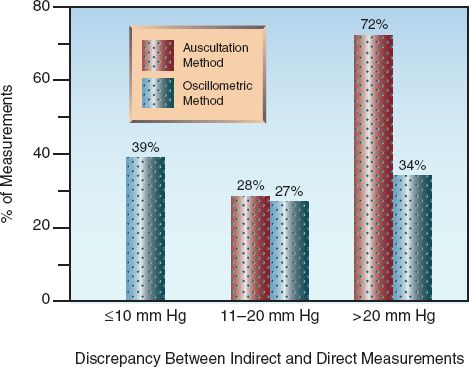
FIGURE 7.3 Discrepancy between indirect and direct blood pressure measurements in critically ill patients. From References 4 and 9.
DIRECT MEASUREMENTS
Intraarterial pressure is typically measured from the radial, brachial, axillary, or femoral arteries. The arterial cannulation technique is not de-scribed here, but many of the practices related to arterial cannulation are similar to those described in Chapter 2 for central venous cannulation.
Systolic Amplification
The contour of the arterial pressure waveform changes as it moves away from the proximal aorta. This is shown in Figure 7.4. Note that as the pressure wave moves toward the periphery, the systolic pressure gradually increases and the systolic portion of the waveform narrows. The systolic pressure can increase as much as 20 mm Hg from the proximal aorta to the radial or femoral arteries (10). This increase in peak systolic pressure is offset by the narrowing of the systolic pressure wave, so the mean arterial pressure (described later) remains unchanged.
Reflected Waves
The increase in systolic pressure in peripheral arteries is the result of pressure waves that are reflected back from vascular bifurcations and narrowed blood vessels (11). Reflected waves move faster when the arteries are stiff, and they reach the arterial pressure waveform before it has time to decrement; the convergence of antegrade and retrograde pressure waves serves to heighten the peak of the antegrade pressure waveform. (You can see this effect when ocean waves meet from opposing directions, and this effect has been implicated in the formation of “monster waves”.) Amplification of the systolic pressure by reflected waves is the mechanism for systolic hypertension in the elderly (11). Because systolic amplification is the result of retrograde pressure waves, it does not promote systemic blood flow.
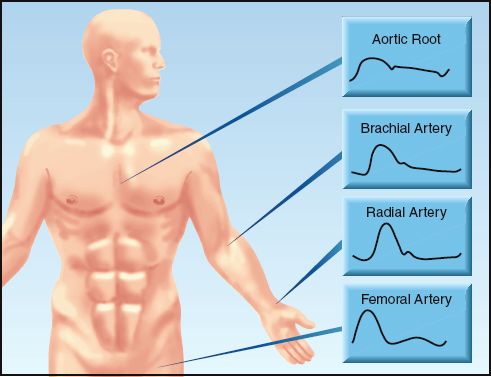
FIGURE 7.4 Arterial pressure waveforms at specific points along the arterial circulation.
Mean Arterial Pressure
The mean arterial pressure (MAP) is the time-averaged pressure in the major arteries, and is the principal driving force for systemic blood flow (10,12). The MAP is measured electronically as the area under the arterial pressure wave, divided by the duration of the cardiac cycle. When invasive monitoring is not available, MAP is often derived from the systolic and diastolic blood pressures (SBP and DBP) as follows (10): MAP = 1/3 SBP + 2/3 DBP. However, this relationship is based on the as-sumption that diastole accounts for two-thirds of the cardiac cycle, which occurs only when the heart rate is 60 beats/minute; a rarity in critically ill patients. Therefore, calculation of MAP is not advised in the ICU setting.
Determinants of Mean Pressure
Steady flow (Q) through a closed hydraulic circuit is directly related to the pressure gradient across the circuit (Pin – Pout), and inversely related to the resistance to flow (R) through the circuit. This relationship is de-scribed by the simplified equation shown below (which is the hydraulic equivalent of Ohm’s Law).
 (7.2)
(7.2)
If the hydraulic circuit is the circulatory system, volumetric flow becomes cardiac output (CO), the inflow pressure is the mean arterial pressure (MAP), the outflow pressure is the mean right atrial pressure (RAP), and the resistance to flow is the systemic vascular resistance (SVR). The equivalent relationships in the circulatory system are as follows:
 (7.3)
(7.3)
Rearranging the terms then identifies the determinants of mean arterial pressure
 (7.4)
(7.4)
Right atrial pressure is negligible in most patients, and thus the RAP is often eliminated from the equation (when there is no right heart failure).
Circulatory Shock
The determinants of MAP in equation 7.4 are the basis for the three general types of circulatory shock; i.e.,
a. Low RAP = hypovolemic shock.
b. Low CO = cardiogenic shock
c. Low SVR = vasogenic shock (e.g., septic shock)
As such, the determinants of MAP are the central focus of the diagnostic approach to hypotension and circulatory shock. The management of circulatory shock requires close monitoring of MAP, preferably with intraarterial pressure recordings. A MAP ≥ 65 mm Hg is one of the end-points of management (10,12).
Recording Artifacts
Fluid-filled recording systems can produce artifacts that further distort the arterial pressure waveform. Failure to recognize these artifacts can lead to errors in blood pressure management.
Resonant Systems
Vascular pressures are transmitted through fluid-filled plastic tubes that connect the arterial catheter to the pressure transducer. This fluid-filled system can oscillate spontaneously, and the oscillations can distort the arterial pressure waveform (13,14).
The performance of a resonant system is defined by two factors: the resonant frequency and the damping factor. The resonant frequency is the frequency of oscillations that occur when the system is disturbed. When the frequency of an incoming signal approaches the resonant frequency of the system, the resident oscillations add to the incoming signal and amplify it. This type of system is called an underdamped system. The damping factor is a measure of the tendency for the system to attenuate the incoming signal. A resonant system with a high damping factor is called an overdamped system.
Waveform Distortion
Three waveforms from different recording systems are shown in Figure 7.5. The waveform in panel A, with the rounded peak and the dicrotic notch, is the normal waveform expected from a recording system with no distortion. The waveform in panel B, with the sharp systolic peak, is from an underdamped recording system. Underdamped systems are popular for pressure recording because of their rapid response characteristics, but these systems can amplify the systolic pressure by as much as 25 mm Hg (15). The final waveform in panel C has an attenuated peak and a narrow pulse pressure. This waveform is from an overdamped system. Overdamping reduces the gain of the system and attenuates the pressure waveform. Overdamping can be the result of partial obstruction of the catheter with a thrombus, or air bubbles in the recording circuit.
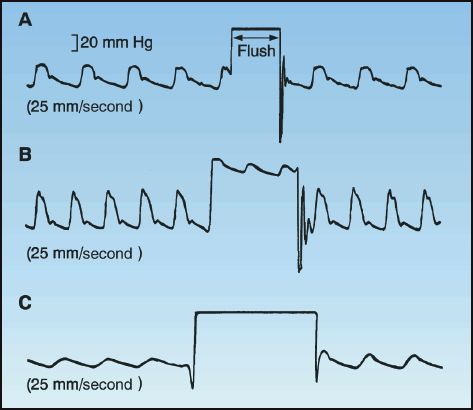
FIGURE 7.5 The rapid flush test. Panel A: Normal response; Panel B: Underdamped response; Panel C: Overdamped response. See text for explanation.
Fast Flush Test
A pressurized flush of the catheter-tubing system can also help to identify a recording circuit that is distorting the pressure waveform (14,15). Most commercially available transducer systems are equipped with a one-way valve that can be used to deliver a flush from a pressurized source. Figure 7.5 shows the results of a flush test in three different situations; the response when the flush is released will help characterize the system In panel A, the flush release is followed by a high-frequency burst. This is the normal behavior of a fluid-filled system. In panel B, the flush release produces a more sluggish frequency response. This is characteristic of an underdamped system, which will produce some degree of systolic amplification (as suggested by the narrowed peak on the pressure waveforms). The flush release in panel C does not produce oscillations. This is a sign of an overdamped system, which will attenuate the arterial pressure waveform and produce a spuriously low systolic pressure.
A FINAL WORD
Most ignorance is vincible ignorance; we don’t know because
we don’t want to know.
Aldous Huxley
The most disturbing feature of indirect blood pressure (BP) measurements is not their limited accuracy, but the universal lack of competence in the methodology. In two studies presented earlier in the chapter (2,3), no one measured the blood pressure correctly! This is perplexing, unacceptable, and dangerous.
Because BP measurements are performed so frequently, the impact of false readings can be enormous. For example, about 85% of adults in the United States (about 180 million) have a BP measurement at least once yearly—if 3% of the measurements are falsely elevated (a common error), then as many as 5.4 million new cases of hypertension will be created each year. This would explain why there are currently 74.6 million adults in the United States with hypertension (17) (more than the entire population of France!).
The American Heart Association publishes guidelines for indirect blood pressure measurements (1), and you are urged to read these guidelines. And then read them again.
REFERENCES
Clinical Practice Guidelines
1. Pickering TG, Hall JE, Appel LJ, et al. Recommendations for blood pressure measurement in humans and experimental animals: Part 1: Blood pressure measurement in humans: a statement for professionals from the Sub-committee of Professional and Public Education of the American Heart Assoc-iation Council on High Blood Pressure Research. Circulation 2005; 111:697–716.
Indirect Methods
2. McKay DW, Campbell NR, Parab LS, et al. Clinical assessment of blood pressure. J Hum Hypertens 1990; 4:639–645.
3. Villegas I, Arias IC, Bortero A, Escobar A. Evaluation of the technique used by health-care workers for taking blood pressure. Hypertension 1995; 26:1204–1206.
4. Bur A, Hirschl M, Herkner H, et al. Accuracy of oscillometric blood pressure measurement according to the relation between cuff size and upper-arm circumference in critically ill patients. Crit Care Med 2000; 28:371–376.
5. Shevchenko YL, Tsitlik JE. 90th anniversary of the development by Nicolai S. Korotkoff of the auscultatory method of measuring blood pressure. Circulation 1996; 94:116–118.
6. Ellestad MH. Reliability of blood pressure recordings. Am J Cardiol 1989; 63:983–985.
7. van Montfrans GA. Oscillometric blood pressure measurement: progress and problems. Blood Press Monit 2001; 6:287–290.
8. Smulyan S, Safar ME. Blood pressure measurement: retrospective and prospective views. Am J Hypertens 2011; 24:628–634.
9. Cohn JN. Blood pressure measurement in shock. JAMA 1967; 199:118–122.
Direct Measurements
10. Augusto J-L, Teboul J-L, Radermacher P, Asfar P. Interpretation of blood pressure signal: physiological bases, clinical relevance, and objectives during shock states. Intens Care Med 2011; 37:411–419.
11. Nichols WW, O’Rourke MF. McDonald’s blood flow in arteries. 3rd ed. Philadelphia: Lea & Febiger, 1990; 251–269.
12. Shapiro DS, Loiacono LA. Mean arterial pressure: therapeutic goals and pharmacologic support. Crit Care Clin 2010; 26:285–293.
13. Gardner RM. Direct blood pressure measurement dynamic response requirements. Anesthesiology 1981; 54:227–236.
14. Darovic GO, Vanriper S, Vanriper J. Fluid-filled monitoring systems. In Darovic GO, ed. Hemodynamic monitoring. 2nd ed. Philadelphia: WB Saunders, 1995; 149–175.
15. Kleinman B, Powell S, Kumar P, Gardner RM. The fast flush test measures the dynamic response of the entire blood pressure monitoring system. Anesthesiology 1992; 77:1215–1220.
16. Roger VL, Go AS, Lloyd-Jones DM, et al. Heart disease and stroke statistics — 2011 update. Circulation 2011; 123:e18–e209.
Stay updated, free articles. Join our Telegram channel

Full access? Get Clinical Tree


