FIGURE 35.1 Illustration of the relationship between osmotic activity and the movement of water between fluid compartments. See text for explanation.
Summary
The following statements summarize the relationship between osmotic activity and the transcellular shift of water.
1. A change in the relative osmotic activity of extracellular fluid produces a transcellular water shift.
2. When the extracellular fluid is hypertonic, water will move out of cells.
3. When the extracellular fluid is hypotonic, water will move into cells.
Units of Osmotic Activity
The unit of measurement for osmotic activity is the osmole (osm), which is defined as one gram molecular weight (one mole) of a nondissociable substance, and is equivalent to 6×10²³ particles (Avogadro’s Number). Osmotic activity can be expressed in relation to the volume of water in a solution, or the total volume of the solution (3,4).
1. Osmotic activity per volume of solution is called osmolarity, and is expressed as milliosmoles per liter (mosm/L).
2. Osmotic activity per volume of water is called osmolality, and is expressed as milliosmoles per kilogram of H2O (mosm/kg H2O, or mosm/kg).
Plasma is mostly (93%) water, so the osmotic activity of plasma solutes is typically expressed as osmolality (mosm/kg H2O). However, there is little difference between the osmolality and osmolarity of extracellular fluid, and the two terms are often used interchangeably (4).
Conversion Factors
The following formulas (where n is the number of nondissociable particles) can be used to convert plasma solute concentrations to units of osmolality:
1. For solute concentrations expressed in mEq/L:
 (35.1)
Thus, for univalent ions like Na+, the plasma concentration in mEq/L is equivalent to the osmotic activity in mosm/kg H2O.
2. For solute concentrations expressed in mg/dL:
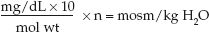 (35.2)
where mol wt is molecular weight, and the factor 10 is used to convert deciliters (dL) to liters. For example, glucose has a molecular weight of 180, so a plasma glucose concentration of 90 mg/dL is equivalent to (90×10/180)×1 = 5 mosm/kg H2O.
Plasma Osmolality
The osmotic activity of plasma can be measured or calculated.
Measured Plasma Osmolality
The standard method for measuring plasma osmolality is the freezing point depression method. Solute-free water freezes at 0ºC, and this freezing point decreases by 1.86°C for each osmole of solute that is added to one kilogram of water. Therefore, depression of the freezing point of plasma is proportional to the osmotic activity in plasma.
Calculated Plasma Osmolality
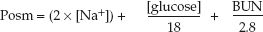
Plasma osmolality can also be calculated using the concentrations of the principal solutes in plasma (sodium, chloride, glucose, and urea) (3); i.e.,
 (35.3)
where Posm is the plasma osmolality in mosm/kg H2O, [Na] is the plasma sodium concentration in mEq/L, [glucose] and BUN are the glucose and urea concentrations in plasma in mg/dL, and the factors 18 and 2.8 are the molecular weights of glucose and urea divided by 10, respectively, to express their concentrations in mosm/kg H2O (analogous to Equation 35.2). The [Na+] is doubled to include the osmotic activity of chloride.
EXAMPLE: Using normal plasma concentrations of Na+ (140 mEq/L), glucose (90 mg/dL), and BUN (14 mg/dL), the plasma osmolality is: (2×140) + 90/18 + 14/2.8 = 290 mosm/kg H2O.
EFFECTIVE PLASMA OSMOLALITY: Urea readily crosses cell membranes, so an increase in blood urea nitrogen (BUN) will not increase the relative osmotic activity of plasma (i.e., azotemia is a hyperosmotic, but not a hypertonic, condition). Therefore, the calculation of effective plasma osmolality does not include the BUN; i.e.,
 (35.4)
Using normal plasma concentrations of Na+ (140 mEq/L) and glucose (90 mg/dL) yields an effective plasma osmolarity of (2×140) + 90/18 = 285 mosm/kg H2O. Note the following:
1. There is only a minor difference (5 mosm/kg H2O) between the total and effective plasma osmolarity.
2. Plasma sodium accounts for 98% (280 of 285 mosm/kg H2O) of the effective osmotic activity of the extracellular fluid. This highlights the fact that the sodium concentration in extracellular fluid is the principal determinant of the distribution of total body water in the intracellular and extracellular fluid compartments.
Osmolal Gap
Because solutes other than sodium, glucose, and urea are present in the extracellular fluid, the measured plasma osmolality will be greater than the calculated osmolality. This osmolal gap (i.e., the difference between measured and calculated plasma osmolality) is normally ″ 10 mosm/kg H2O (3,5). Accumulation of a nondiffusable solute (like an exogenous toxin) will increase the osmolal gap, and this has led to the use of the osmolal gap to detect the presence of ingested toxins that are not easily measured (6).
HYPERNATREMIA
The normal plasma [Na+] is 135–145 mEq/L, and thus hypernatremia is defined as a plasma [Na+] >145 mEq/L. This condition is reported in as many as 25% of ICU patients (1), and is acquired in the ICU in most cases (1,7).
Approach to Hypernatremia
Hypernatremia can be the result of 3 conditions: (a) Loss of sodium and water, with water loss >sodium loss (i.e., hypotonic fluid loss), (b) free water loss, and (c) gain of sodium and free water, with sodium gain >free water gain (i.e., gain of hypertonic fluid) (8).
Extracellular Volume
Each of the conditions responsible for hypernatremia is associated with a different extracellular volume (ECV); i.e., hypotonic fluid loss is associated with a low ECV, free water loss is associated with a normal ECV, and hypertonic fluid gain is associated with a high ECV. Therefore, assessment of the extracellular volume (ECV) can be used to identify the condition responsible for hypernatremia. The approach to hypernatremia based on the ECV is shown in Figure 35.2. (Assessment of the extracellular volume is not presented here. See Chapter 11 for the evaluation of hypovolemia.)
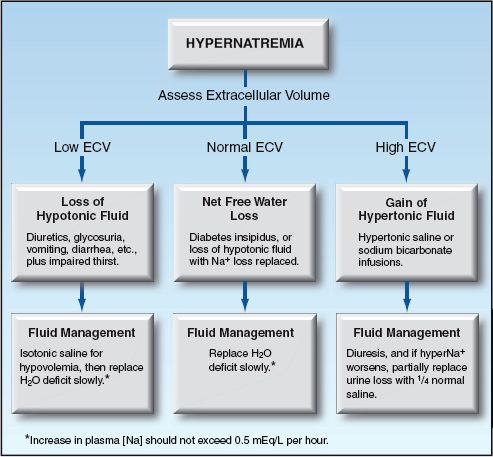
FIGURE 35.2 Flow diagram for the approach to hypernatremia based on the extracellular volume (ECV).
Hypertonicity
The principal consequence of hypernatremia is an increase in the effective osmolality (tonicity) of the extracellular fluid, which draws water out of cells. This is most evident in the central nervous system.
Hypernatremic Encephalopathy
The clinical manifestations of hypernatremic encephalopathy range from agitation and lethargy to coma and generalized or focal seizures (1). Encephalopathy is more likely to occur with a rapid rise in plasma Na+, and possible mechanisms include shrinkage of neuronal cell bodies (9) and osmotic demyelination (10). The presence of encephalopathy is a poor prognostic sign in hypernatremia, and carries a mortality rate as high as 50% (9).
HYPOVOLEMIC HYPERNATREMIA
Hypernatremia associated with a low extracellular volume (ECV) is the result of loss of hypotonic fluids (i.e., fluids with a [Na+] <135 mEq/L). This is the most common cause of community-acquired (but not ICU-acquired) hypernatremia (1).
Hypotonic Fluid Loss
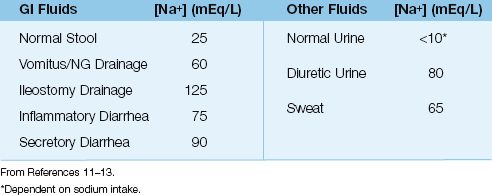
The average sodium concentration in fluids that can be lost is shown in Table 35.1 (11–13). Note the following:
1. All fluid losses involve the loss of sodium, which promotes a de-crease in ECV.
2. All lost fluids are hypotonic to plasma (i.e., have a sodium concentration <135 mEq/L), and will eventually result in hypernatremia if not replaced.
Common sources of hypotonic fluid loss include (a) excessive diuresis (osmotic or drug-induced), (b) excessive sweat loss in heat-related illnesses, and (c) normal or accentuated fluid losses in elderly, debilitated patients, particularly those with sepsis.
Impaired Thirst
The normal response to hypotonic fluid loss is an increase in the sensation of thirst, which promotes water ingestion to limit the rise in plasma osmolality. Patients who develop symptomatic hypernatremia often have an impaired sensation of thirst from a debilitating or chronic illness, or advanced age. For this reason, symptomatic hypernatremia from hypotonic fluid loss can be a sign of a more serious condition; i.e., “failure to thrive.”
Table 35.1 Average Sodium Concentration in Lost Fluids
Plasma Volume
Hypotonic fluid loss has less of an effect on plasma volume than ECV because the accentuated loss of free water increases the colloid osmotic pressure in plasma (i.e., the osmotic pressure generated by plasma proteins, principally albumin, that do not move readily into the interstitial fluid), and this draws fluid from the interstitial fluid and helps to maintain the plasma volume. The influence of hypotonic fluid loss on plasma volume is determined by the severity of sodium losses; i.e., the greater the sodium loss, the greater the likelihood of a significant decrease in plasma volume (and a subsequent decrease in cardiac output).
Management
Management is aimed at the two consequences of hypotonic fluid loss: (a) loss of sodium, which reduces the ECV and threatens the plasma volume (and cardiac output), and (b) loss of water in excess of sodium (the free water deficit), which increases the plasma osmolality.
Volume Resuscitation
The most immediate concern with sodium loss is a decrease in plasma volume, which can decrease cardiac output and impair tissue perfusion. Therefore, any signs of a low flow state (e.g., cold extremities, a decrease in blood pressure or urine output) should prompt immediate volume resuscitation with isotonic saline. Fortunately, loss of hypotonic fluids carries a low risk of hypovolemic shock.
Free Water Replacement
When hypovolemia has been corrected, the next step is to replace the free water deficit. The calculation of free water deficit is based on the as-sumption that the product of total body water (TBW) and plasma sodium concentration [PNa] is always constant (8).
 (35.5)
Substituting 140 mEq/L for a normal [PNa] and rearranging terms yields the following relationship:
 (35.6)
1. The normal TBW (in liters) is usually 60% of lean body weight (in kg) in men and 50% of lean body weight in women, but a 10% reduction in the normal TBW has been suggested for hypernatremic patients who are water depleted (14)
2. In patients who are hyperglycemic, the plasma sodium should be corrected for the dilutional effect of hyperglycemia. This effect averages 2 mEq/L for every 100 mg/dL increase in plasma glucose. (See the section on “Hypertonic Hyperglycemia” for more on this correction factor.)
3. Once the current TBW is calculated, the free water deficit is the difference between the normal and current TBW.
 (35.7)
EXAMPLE: For an adult male with a lean body weight of 70 kg and a plasma [Na] of 160 mEq/L, the normal TBW is 0.5×70 = 35 L, the current TBW is 35×(140/160) = 30.5 L, and the H2O deficit is 35 – 30.5 = 4.5 L.
REPLACEMENT VOLUME: Free water deficits are corrected with sodium-containing fluids such as 0.45% NaCL (to correct sodium deficits and ongoing sodium losses). The volume needed to correct the H2O deficit is a function of the [Na] in the replacement fluid and the desired plasma [Na] (15). The following equation uses 140 mEq/L as the desired plasma [Na]:
 (35.8)
EXAMPLE: Using the H2O deficit of 4.5 L from the prior example, if the replacement fluid is 0.45% NaCL ([Na+] = 77 mEq/L), the replacement volume is 4.5×(140/77) = 8.1 liters.
RATE OF REPLACEMENT: Neuronal cells initially shrink in response to hypertonic extracellular fluid, but cell volume is restored within hours; an effect attributed to the generation of osmotically active substances within brain cells, called idiogenic osmoles (8). Once the cell volume is restored to normal, aggressive replacement of free water deficits can produce cell swelling and cerebral edema. To limit the risk of cerebral edema, the decrease in plasma [Na+] should not exceed 0.5 mEq/L per hour during free water replacement (1,8,9).
EXAMPLE: Using the prior examples, where the plasma [Na+] is 160 mEq/L, the H2O deficit is 4.5 L, and the replacement volume is 8.1 L using 0.45% NaCL, the time needed to reduce the plasma [Na+] to 140 mEq/L at a rate of 0.5 mEq/L/hr is (160 – 140)/0.5 = 40 hours, and the infusion rate of the half-normal saline will be 8.1 L/40 hrs = 200 mL/hr.
VARIABILITY: The calculations for free water deficit and replacement are estimates, and do not account for ongoing sodium and free water losses, so fluid management based on these calculations can produce variable results (1). Therefore, it is important to monitor the plasma [Na+]frequently and make appropriate adjustments. About half of the free water deficit can be replaced in the first 12 to 24 hours of replacement (1).
HYPERNATREMIA WITHOUT HYPOVOLEMIA
Hypernatremia with a normal ECV is the result of free water loss with no net sodium loss. This condition is common in ICU patients with hypernatremia (1), and usually occurs when sodium losses are replaced, leaving a net free water deficit. The condition described next is the best example of a free water deficit.
Diabetes Insipidus
Diabetes insipidus (DI), is a disorder of renal water conservation, and is characterized by loss of urine that is largely devoid of solute (i.e., like pure water) (16,17). The underlying problem in DI is a defect related to antidiuretic hormone (ADH), a polypeptide released by the posterior pituitary gland that promotes water reabsorption in the distal renal tubules. DI can involve two distinct defects related to ADH:
1. Central DI is characterized by failure of ADH release from the posterior pituitary (18). Common causes include traumatic brain injury, anoxic encephalopathy, meningitis, and brain death. The onset is heralded by polyuria that usually is evident within 24 hours of the inciting event.
2. Nephrogenic DI is characterized by impaired end-organ responsiveness to ADH. Possible causes of nephrogenic DI include amphotericin, aminoglycosides, radiocontrast dyes, dopamine, lithium, hypokalemia, and the recovery (polyuric) phase of ATN (17,19). The defect in renal concentrating ability is less severe in nephrogenic DI than in central DI.
Diagnosis
The hallmark of DI is a dilute urine in the face of hypertonic plasma. In central DI, the urine osmolarity is often below 200 mosm/L, whereas in nephrogenic DI, the urine osmolarity is usually between 200 and 500 mosm/L (20). The diagnosis of DI is confirmed by noting the urinary response to fluid restriction. Failure of the urine osmolarity to increase more than 30 mosm/L in the first few hours of complete fluid restriction is diagnostic of DI. The fluid losses can be excessive during fluid restriction in DI (particularly central DI), and thus fluid restriction must be monitored carefully.
Once the diagnosis of DI is confirmed, the response to vasopressin (5 Units intravenously) will differentiate central from nephrogenic DI. In central DI, the urine osmolality increases by at least 50% almost immediately after vasopressin administration, whereas in nephrogenic DI, the urine osmolality is unchanged after vasopressin.
Management
The fluid loss in DI is almost pure water, so the replacement strategy is aimed at replacing free water deficits using Equations 35.6–35.9 and limiting the rate of sodium correction to ″ 0.5 mEq/L per hour (1,8,9).
VASOPRESSIN: In central DI, vasopressin administration is also required to prevent ongoing free water losses. The usual dose is 2 to 5 Units of aqueous vasopressin given subcutaneously every 4 to 6 hours (17). The serum sodium must be monitored carefully during vasopressin therapy because water intoxication and hyponatremia can occur if the central DI begins to resolve.
Hypervolemic Hypernatremia
Hypernatremia with a high ECV is uncommon, and is usually the result of sodium bicarbonate infusions for metabolic acidosis, or aggressive use of hypertonic saline to treat increased intracranial pressure. Excessive ingestion of table salt (often in females with a psychiatric disorder) should also be considered in patients admitted with hypervolemic hypernatremia (21).
Management
In patients with normal renal function, excess sodium and water are excreted rapidly. When renal sodium excretion is impaired, it might be necessary to increase renal sodium excretion with a diuretic (e.g., furo-semide). Because the urinary sodium concentration during furosemide diuresis (~80 mEq/L) is less than the plasma sodium concentration, diuresis can aggravate the hypernatremia. If this occurs, urine losses should be partially replaced with a fluid that is hypotonic to urine (e.g., quarter-normal saline).
HYPERTONIC HYPERGLYCEMIA
Although normoglycemia has little osmotic impact, severe hyperglycemia has a considerable influence on plasma osmolality (e.g., a plasma glucose level of 600 mg/dL is equivalent to 600/18 = 40 mosm/kg H2O).
Non-Ketotic Hyperglycemia
The syndrome of non-ketotic hyperglycemia (NKH) is characterized by severe hyperglycemia without ketoacidosis. This condition typically occurs in elderly patients with type 2 diabetes (who have enough endogenous insulin to prevent ketogenesis), and is precipitated by a physiological stress (e.g., infection, trauma). Blood glucose levels are typically >600 mg/dL, and can reach levels in excess of 1,000 mg/dL. Glycosuria is marked, and the resulting osmotic diuresis results in hypovolemia. The combination of hyperglycemia and hypotonic fluid loss produces a considerable increase in plasma osmolality. The mortality rate in NKH (5–20%) is higher than in diabetic ketoacidosis (1–5%) (22).
Clinical Manifestations
The manifestations of NKH include severe hyperglycemia (plasma glucose levels typically >600 mg/dL), absent (or mild) ketosis, signs of encephalopathy (e.g., depressed consciousness), and evidence of hypovolemia (22).
ENCEPHALOPATHY: Mental status changes begin when the plasma osmolality rises to 320 mosm/kg H2O, and coma can develop at a plasma osmolality of 340 mosm/kg H2O (22). Both generalized and focal seizures can appear, and there are several reports of involuntary movements (chorea and hemiballismus) associated with hyperglycemic encephalopathy (23).
Fluid Management
VOLUME INFUSION: Volume deficits can be profound in NKH, and aggressive volume infusion with isotonic fluids (1–2 liters in the first hour) is often necessary. Thereafter, volume infusion should be guided by signs of hypovolemia (e.g., decreased blood pressure). The initial volume infusion will also ameliorate the hyperosmolar condition, which will reduce insulin resistance. The plasma [Na] is an unreliable marker of extracellular volume in NKH because of the dilutional effect of hyperglycemia.
HYPERGLYCEMIA AND PLASMA [NA+]: Hyperglycemia draws water from the intracellular space and creates a dilutional effect on the plasma [Na]. There is some disagreement about the extent of the dilutional effect, which ranges from 1.6 to 2.4 mEq/L for each 100 mg/dL increment in plasma glucose above 100 mg/dL (24,25). In other words, for every 100 mg/dL increment in plasma glucose above 100 mg/dL, the plasma [Na] will decrease 1.6–2.4 mEq/L (or about 2 mEq/L).
EXAMPLE: Using a correction factor of 2 mEq/L per 100 mg/dL increase in plasma glucose above 100 mg/dL, then if the plasma [Na] is 125 mEq/L and the plasma glucose is 800 mg/dL, the corrected plasma [Na] is (7×2) + 125 = 139 mEq/L.
Insulin Therapy
Because insulin drives both glucose and water into cells, insulin therapy can aggravate hypovolemia. Therefore, in patients who are hypo-volemic, insulin should be withheld until the vascular volume is restored. Once this is accomplished, insulin is started using the same regimen recommended for diabetic ketoacidosis (see pages 610–613). However, the insulin requirement will diminish as the hypertonic condition is corrected (because hypertonicity promotes insulin resistance), so plasma glucose levels should be monitored frequently during insulin infusions to prevent hypoglycemia.
HYPONATREMIA
Hyponatremia (plasma [Na] <135 mEq/L) (26), is reported in 40–50% of ICU patients (26,27), and is particularly prevalent in neurosurgical patients (27). Although hyponatremia is typically a hypotonic condition, there are instances of isotonic hyponatremia (e.g., pseudohyponatremia) and hypertonic hyponatremia (i.e., non-ketotic hyperglycemia, de-scribed in the last section).
Pseudohyponatremia
The traditional method of measuring the plasma [Na] (flame photometry) includes both aqueous and nonaqueous phases of plasma, while sodium is restricted to the aqueous phase of plasma. Therefore, the measured plasma [Na]can be lower than the actual (aqueous phase) plasma [Na]. Plasma is about 93% water, so the difference between measured and actual plasma [Na] is small (about 7%).
Marked increases in lipid or protein levels in plasma will add to the nonaqueous phase of plasma, and this can significantly lower the measured plasma [Na] without affecting the actual (aqueous phase) plasma [Na]. This condition is called pseudohyponatremia (28). It usually does not occur until the plasma lipid levels rise above 1,500 mg/dL or the plasma protein levels rise above 12–15 g/dL (28). The influence of hypertriglyceridemia on the measured plasma [Na] is described by the following equation (28):
 (35.9)
Diagnosis
The diagnosis of pseudohyponatremia can be confirmed or eliminated by measuring the plasma osmolality, which will be normal in pseudohyponatremia, and reduced in “true” or hypotonic hyponatremia. An alternative method involves measuring the plasma [Na] with an ion-specific electrode. These electrodes measure the [Na] in the aqueous phase of plasma, and the plasma [Na] will be normal in cases of pseudohyponatremia.
Hypotonic Hyponatremia
Hypotonic hyponatremia is the result of excess free water relative to sodium in the extracellular fluid. Most cases involve loss of the normal control mechanisms for antidiuretic hormone (ADH) release.
Nonosmotic ADH Release
Antidiuretic hormone (ADH) is released by the posterior pituitary in response to an increase in the osmolality of extracellular fluid, and it helps to curb the hyperosmolar condition by promoting water reabsorption in the distal renal tubules. ADH release is normally suppressed at a plasma [Na] ″ 135 mEq/L (1). ADH is also released in response to nonosmotic factors like a decrease in blood pressure (via baroreceptors) or “physiological stress” (i.e., the same stimulus for ACTH release from the anterior pituitary).
When nonosmotic stimuli for ADH release are active, ADH release persists despite a plasma [Na] ″135 mEq/L, and the resulting water reabsorption in the kidneys aggravates the hyponatremia. Therefore, nonosmotic or “inappropriate” release of ADH is an important factor in the development of severe and sustained hyponatremia (29).
Clinical Features
ENCEPHALOPATHY: The principal consequence of hypotonic hyponatremia is a life-threatening encephalopathy characterized by cerebral edema, increased intracranial pressure, and the risk of brain herniation (29,30). Symptoms range from headache, nausea and vomiting to seizures, coma, and brain death. The risk and severity of encephalopathy are greater with acute (<48 hrs) hyponatremia (29,30).
EXTRACELLULAR VOLUME: Like hypernatremia, the extracellular volume can be low, normal, and high in hyponatremia, and the approach can be organized according to the extracellular volume (ECV). This is shown in Figure 35.3.
Hypovolemic Hyponatremia
Hyponatremia with a low ECV is the result of sodium loss with excess free water retention. The sodium loss decreases the ECV, and the excess free water retention decreases the extracellular [Na]. The excess free water retention is due to baroreceptor-mediated (nonosmotic) ADH release (29) combined with free water intake (oral intake or infusion of a fluid that is hypotonic to the fluid lost).
Etiologies
The principal conditions associated with hypovolemic hyponatremia are shown in Table 35.2. Thiazide diuretics are common offenders, probably because they impair renal diluting ability. Other conditions in critically ill patients are primary adrenal insufficiency and cerebral salt wasting.
PRIMARY ADRENAL INSUFFICIENCY: Primary adrenal insufficiency is accompanied by mineralocorticoid deficiency, which results in renal sodium wasting. In contrast, secondary (hypothalamic) adrenal insufficiency is primarily a glucocorticoid deficiency, and does not promote renal sodium loss.
CEREBRAL SALT WASTING: Cerebral salt wasting is a syndrome that occurs with traumatic brain injury, subarachnoid hemorrhage, and neurosurgery (27). The mechanism for the renal sodium loss is unclear (29).
Diagnostic Considerations
The source of Na+ loss is usually apparent. If this is unclear, the spot urine [Na] can help to distinguish renal from extrarenal losses; i.e., a high urine [Na] (>20 mEq/L) suggests a renal source of sodium loss, while a low urine [Na] (<20 mEq/L) suggests an extrarenal source (see Figure 35.3).
Table 35.2 Predisposing Conditions for Hyponatremia
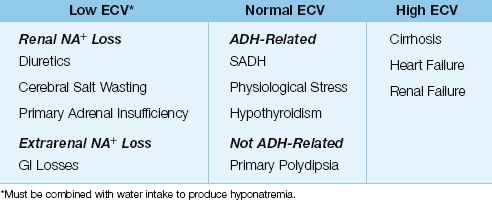
Euvolemic Hyponatremia
Euvolemic hyponatremia is the result of excess water intake or excess water retention from nonosmotic ADH release.
Etiologies
The leading cause of euvolemic hyponatremia is the syndrome of inappropriate ADH (SIADH) (29). Other notable conditions include nonosmotic ADH release during physiological stress (often in postoperative patients), hypothyroidism (usually severe), and excessive water intake in primary polydipsia (usually in schizophrenics).
SIADH: SIADH is a condition of nonosmotic ADH release associated with a variety of malignancies, infections, and drugs. The hallmark of SIADH is the combination of euvolemia, hypotonic plasma, inappropriately concentrated urine (urine osmolality >100 mosm/kg H2O) and a high urine sodium (>20 mEq/L) (29).
Diagnostic Considerations
Disorders of ADH release are associated with a urine osmolality >100 mosm/kg H2O, while excess water intake is associated with a urine osmolality <100 mosm/kg H2O (29).
Hypervolemic Hyponatremia
Hypervolemic hyponatremia is the result of Na+ and H2O retention, with H2O retention exceeding Na+ retention. This condition occurs in advanced heart failure, cirrhosis, and renal failure. Renal failure is associated with a high urine [Na+] (>20 mEq/L), while the urine [Na+] is low (<20 mEq/L) in heart failure and cirrhosis, except during diuretic therapy when the drug is active.
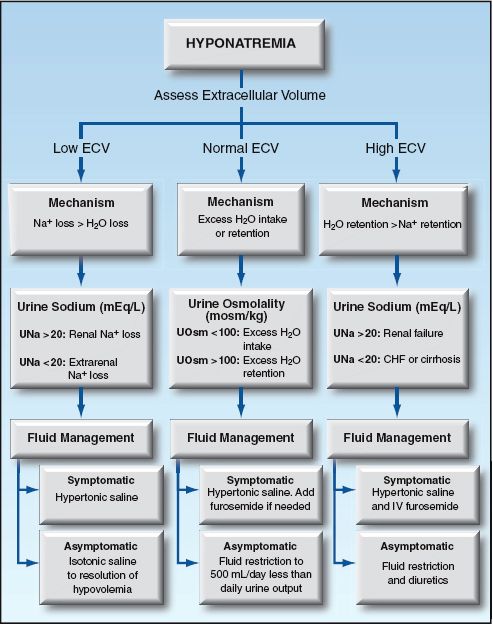
FIGURE 35.3 Flow diagram for the approach to hyponatremia based on the extracellular volume (ECV).
Fluid Management
The management of hyponatremia is determined by the ECV and the presence or absence of neurological symptoms. Symptomatic hyponatremia (which usually occurs when the plasma [Na] falls below 120 mEq/L) requires a more rapid increase in the plasma [Na] than asymptomatic cases, and this is accomplished with hypertonic saline (3% NaCL). However, correction that is too rapid can be deleterious, as described next.
Rate of Correction
Rapid correction of the plasma [Na] (i.e., >10–12 mEq/L in 24 hrs) can produce an osmotic demyelinating syndrome (sometimes called central pontine myelinolysis) characterized by dysarthria, quadriparesis, and loss of consciousness (27,29). Chronic hyponatremia poses a greater risk for this complication than acute (within 48 hrs) hyponatremia. The following measures are recommended for avoiding osmotic demyelination:
1. For chronic hyponatremia, the plasma [Na] should not rise faster than 0.5 mEq/L per hour (or 10–12 mEq/L in 24 hours), and the rapid correction phase should stop when the plasma [Na] reaches 120 mEq/L (29).
2. For acute hyponatremia, the plasma [Na] can be increased by 4–6 mEq/L in the first 1–2 hrs (27). However, the final plasma [Na] should not exceed 120 mEq/L.
INFUSION RATE FOR HYPERTONIC SALINE: The initial infusion rate of hypertonic saline (3% NaCL) can be estimated by multiplying the patients body weight (in kg) by the desired rate of increase in plasma [Na] (29). For example, if the patient weighs 70 kg and the desired rate of rise in plasma [Na] is 0.5 mEq/L per hour, the initial infusion rate of hypertonic saline is 70×0.5 = 35 mL/hr. The plasma [Na] is monitored periodically to determine when the target plasma [Na] (120 mEq/L) is achieved.
Strategies:
The following are some general strategies for fluid management based on the ECV. (These strategies are also summarized in Figure 35.3.)
LOW ECV: For symptomatic patients, infuse hypertonic saline (3% NaCL) using the rapid correction guidelines in the prior section. For asymptomatic patients, infuse isotonic saline until there are no signs of hypovolemia.
NORMAL ECV: For symptomatic patients, infuse hypertonic saline (3% NaCL) using the rapid correction guidelines in the prior section. Intravenous furosemide (20–40 mg) is advised if there is a concern for volume overload (i.e., in patients with heart failure) (29). For asymptomatic patients, fluid restrict to an intake that is 500 mL/ below the daily urine output (29). If fluid restriction is ineffective or intolerable, consider the drug therapies described later.
HIGH ECV: There are no guidelines for treating hypervolemic hyponatremia. Hypertonic saline could be used for severely symptomatic patients, but should be combined with furosemide diuresis (29). For asymptomatic patients, fluid restriction and furosemide diuresis are the standard measures.
Pharmacotherapy
Demeclocycline
Demeclocycline is a tetracycline derivative that blocks the effects of ADH in the renal tubules. It is used primarily in patients with SIADH and chronic hyponatremia who do not tolerate fluid restriction. The drug is given orally, and the dose is 600–1200 mg daily in divided doses (29). Maximum effect takes several days, and success is variable. Demeclo-cycline can be nephrotoxic, so monitoring renal function is advised while using the drug.
Vasopressin Antagonists
Since 2005, two drugs have been introduced that block receptors for arginine vasopressin (the other term for antidiuretic hormone). These drugs, conivaptan and tolvaptan (the “vaptans”) can be used as an alternative to fluid restriction in patients with euvolemic or hypervolemic hyponatremia (except renal failure). At the present time, their principal use is in patients with SIADH-related hyponatremia. These drugs are contraindicated in hypovolemic hyponatremia because of their aquaretic effects.
CONIVAPTAN: Conivaptan is the original vaptan, and blocks vasopressin effects in the kidneys and elsewhere. It is given intravenously with a loading dose of 20 mg, followed by a continuous infusion of 40 mg/day for 96 hours. The effect of this dosing regimen on the plasma [Na] is shown in Figure 35.4 (32). Note the 6–7 mEq/L increase in plasma [Na] in the first 24 hours of drug infusion, which is maintained for the 96-hour infusion period.
TOLVAPTAN: Tolvaptan is more selective than conivaptan, and blocks only vasopressin receptors in the kidneys. The drug is given orally, starting at a dose of 15 mg once daily, and increasing the dose, if necessary, to a maximum of 60 mg daily. Increases in plasma [Na] of 6–7 mEq/L have been observed in the first 4 days of tolvaptan therapy (31), which is the time to maximal drug effect.
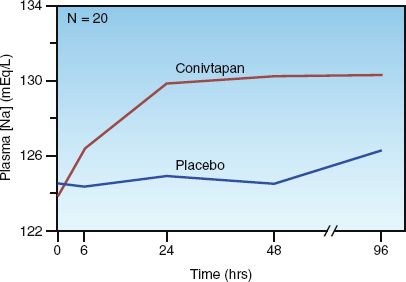
FIGURE 35.4 Effect of intravenous conivaptan (using the same dosing regimen described in the text) on the plasma sodium concentration in patients with euvolemic and hypervolemic hyponatremia. N is the number of study patients. Data from Reference 32.
COMMENT: The vaptans have not gained widespread acceptance, although they may have a role as an alternative to fluid restriction in SIADH-related hyponatremia. However, these agents offer no apparent advantages for the acute management of symptomatic hyponatremia in critically ill patients.
A FINAL WORD
The following points from this chapter deserve emphasis:
1. Sodium is the principal determinant of the distribution of total body water in the intracellular and extracellular fluids.
2. An abnormal plasma sodium concentration is not about sodium, it’s about cell volume.
3. A single variable (the extracellular volume), can be used to understand, identify, and correct the osmotic impact of hypernatremia and hyponatremia. (Bertrand Russell would be proud.)
REFERENCES
Introduction
1. Pokaharel M, Block CA. Dysnatremia in the ICU. Curr Opin Crit Care 2011; 17:581–593.
Osmotic Activity
2. Rose BD, Post TW. The total body water and the plasma sodium concentration. In: Clinical physiology of acid-base and electrolyte disorders. 5th ed. New York, NY: McGraw-Hill, 2001; 241–257.
3. Gennari FJ. Current concepts. Serum osmolality. Uses and limitations. N Engl J Med 1984; 310:102–105.
4. Erstad BL. Osmolality and osmolarity: narrowing the terminology gap. Pharmacother 2003; 23:1085–1086.
5. Turchin A, Seifter JL, Seely EW. Clinical problem-solving. Mind the gap. N Engl J Med 2003; 349:1465–1469.
6. Purssell RA, Lynd LD, Koga Y. The use of the osmole gap as a screening test for the presence of exogenous substances. Toxicol Rev 2004; 23:189–202.
Hypernatremia
7. Darmon N, Timsit JF, Fancais A, et al. Association between hypernatremia acquired in the ICU and mortality: a cohort study. Nephrol Dial Transplant 2010; 25:2510–2515.
8. Adrogue HJ, Madias NE. Hypernatremia. N Engl J Med 2000; 342:1493–1499.
9. Arieff AI, Ayus JC. Strategies for diagnosing and managing hypernatremic encephalopathy. J Crit Illness 1996; 11:720–727.
10. Naik KR, Saroja AO. Seasonal postpartum hypernatremic encephalopathy with osmotic extrapontine myelinolysis and rhabdomyolysis. J Neurol Sci 2010; 291:5–11.
11. Gennari FJ, Weise WJ. Acid-base disturbances in gastrointestinal disease. Clin J Am Soc Nephrol 2008; 3:1861–1868.
12. Bates GP,, Miller VS. Sweat rate and sodium loss during work in the heat. J Occup Med Toxicol 2008; 3:4 (open access article).
13. Stason WB, Cannon PJ, Heinemann HO, Laragh JH. Furosemide: A clinical evaluation of its diuretic action. Circulation 1966; 34:910–920.
14. Rose BD, Post TW. Hyperosmolal states: hypernatremia. In: Clinical physiology of acid-base and electrolyte disorders. 5th ed. New York, NY: McGraw-Hill, 2001; 746–792.
15. Marino PL, Krasner J, O’Moore P Fluid and electrolyte expert, Philadelphia, PA: WB Saunders, 1987.
16. Makaryus AN, McFarlane SI. Diabetes insipidus: diagnosis and treatment of a complex disease. Cleve Clin J Med 2006; 73:65–71.
17. Blevins LS, Jr., Wand GS. Diabetes insipidus. Crit Care Med 1992; 20:69–79.
18. Ghirardello S, Malattia C, Scagnelli P, et al. Current perspective on the pathogenesis of central diabetes insipidus. J Pediatr Endocrinol Metab 2005; 18:631–645.
19. Garofeanu CG, Weir M, Rosas-Arellano MP, et al. Causes of reversible nephrogenic diabetes insipidus: a systematic review. Am J Kidney Dis 2005; 45:626–637.
20. Geheb MA. Clinical approach to the hyperosmolar patient. Crit Care Clin 1987; 3:797–815.
21. Ofran Y, Lavi D, Opher D, et al. Fatal voluntary salt intake resulting in the highest ever documented sodium plasma level in adults (255 mmol/L): a disorder linked to female gender and psychiatric disorders. J Intern Med 2004; 256:525–528.
Hypertonic Hyperglycemia
22. Chaithongdi N, Subauste JS, Koch CA, Geraci SA. Diagnosis and management of hyperglycemic emergencies. Hormones 2011; 10:250–260.
23. Awasthi D, Tiwari AK, Upadhyaya A, et al. Ketotic hyperglycemia with movement disorder. J Emerg Trauma Shock 2012; 5:90–91.
24. Moran SM, Jamison RL. The variable hyponatremic response to hyperglycemia. West J Med 1985; 142:49–53.
25. Hiller TA, Abbott RD, Barrett EJ. Hyponatremia: evaluating the correction factor for hyperglycemia. Am J Med 1999; 106:399–403.
Hyponatremia
26. Hoorn EJ, Lindemans J, Zietse R. Development of severe hyponatremia in hospitalized patients: treatment-related risk factors and inadequate management. Nephrol Dial Transplant 2006; 21:70–76.
27. Upadhyay UM, Gormley WB. Etiology and management of hyponatremia in neurosurgical patients. J Intensive Care Med 2012; 27:139–144.
28. Aw TC, Kiechle FL. Am J Emerg Med 1985; 3:236–239.
29. Verbalis JG, Goldsmith SR, Greenberg A, et al. Hyponatremia treatment guidelines 2007: Expert panel recommendations. Am J Med 2007; 120(Suppl): S1–S21.
30. Arieff AI, Ayus JC. Pathogenesis of hyponatremic encephalopathy. Current concepts. Chest 1993; 103:607–610.
31. Lehrich RW, Greenberg A. Hyponatremia and the use of vasopressin receptor antagonists in critically ill patients. J Intensive Care Med 2012; 27:207-218.
32. Zeltser D, Rosansky S, van Rensburg H, et al. Assessment of efficacy and safety of intravenous conivaptan in euvolemic and hypervolemic hyponatremia. Am J Nephrol 2007; 27:447–457.


Stay updated, free articles. Join our Telegram channel

Full access? Get Clinical Tree


