1555
Vesalius is credited with the first description of positive pressure ventilation, but it took 400 years to apply his concept to patient care. The occasion was the polio epidemic of 1955, when the demand for assisted ventilation outgrew the supply of negative-pressure tank ventilators (known as iron lungs). In Denmark, all medical schools shut down and medical students worked in 8-hour shifts as human ventilators, manually inflating the lungs of afflicted patients. In Boston, the nearby Emerson Company made available a prototype positive-pressure lung inflation device, which was put to use at the Massachusetts General Hospital, and became an instant success. Thus began the era of positive pressure mechanical ventilation (and the era of intensive care medicine).
BASICS
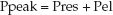
The fundamental operation of positive pressure ventilation is to create a pressure that moves a volume of gas into the lungs. There are two general methods of positive pressure ventilation, which are summarized below and illustrated in Figure 25.1.
1. Volume-controlled ventilation, where the inflation volume (tidal volume) is preselected, and the ventilator automatically adjusts the inflation pressure to deliver the desired volume. The rate of lung inflation can be constant (as in Figure 25.1) or decelerating.
2. Pressure-controlled ventilation, where the inflation pressure is preselected, and the duration of inflation is adjusted (by the operator) to deliver the desired tidal volume. The rate of lung inflation is high at the onset of lung inflation (to achieve the desired inflation pressure), then rapidly decelerates (to maintain a constant inflation pressure).
The uses, advantages, and disadvantages of these modes of ventilation are described in the next chapter. This section will describe the measurements that are used to evaluate the mechanical properties of the lungs and chest wall (i.e., airflow resistance and distensibility) with each method of ventilation.
During positive pressure ventilation, pressures in the thorax are monitored at the level of the endotracheal tube or ventilator. These proximal airway pressures can differ from pressures at the level of the alveoli (as described next).
End-Inspiratory Pressures
The proximal airway pressure at the end of a lung inflation has different interpretations for volume-cycled and pressure-cycled ventilation.
Volume-Controlled Ventilation
During volume-controlled ventilation, the pressure in the airways rises steadily until the preselected volume is delivered. The airway pressure (Paw) at the end of each lung inflation, the peak airway pressure (Ppeak), is the pressure needed to overcome both resistive and elastic forces in the lungs and chest wall (Pres and Pel, respectively).
 (25.1)
FIGURE 25.1 Waveforms for inflation (tidal) volume, airway pressure, and flow rate for volume-controlled and pressure-controlled ventilation. See text for explanation.
Pres is a function of the resistance to flow in the airways (R), and the inspiratory flow rate [Pres = R×V (insp)], while Pel is a function of the elastic recoil force of the lungs and chest wall, and the lung volume (Pel = elastance×V). The resistive component of the peak airway pressure can be eliminated by eliminating airflow. This is accomplished by occluding the expiratory circuit at the very end of lung inflation, to prevent the patient from exhaling. During this “inflation- hold” maneuver (which typically lasts for one second), the pressure in the airways decreases initially and then remains constant until the occlusion is released and the patient is allowed to exhale. This is illustrated in Figure 25.2. The steady occlusion pressure, which is called the plateau pressure, is the peak pressure in the alveoli (Palv) at the end of inspiration.
 (25.2)
The difference between the plateau pressure and the level of positive end-expiratory pressure (PEEP) is the pressure needed to overcome the elastic recoil forces of the lungs and chest wall (Pel).
 (25.3)
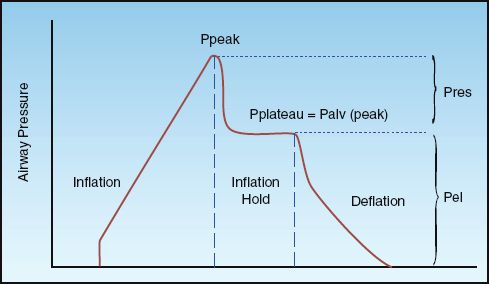
FIGURE 25.2 Airway pressure profile for a constant-flow, volume-controlled lung inflation with a brief end-inspiratory occlusion (inflation-hold). Ppeak is the peak airway pressure, Pplateau is the end-inspiratory occlusion pressure, Palv (peak) is the peak alveolar pressure at end-inspiration, Pres is the pressure attributed to airway resistance, and Pel is the pressure attributed to the elastic recoil force of the lungs and chest wall. See text for explanation.
The difference between the peak and plateau pressures represents the pressure needed to overcome the resistance to airflow at any given inspiratory flow rate.
 (25.4)
Pressure-Controlled Ventilation
During pressure-controlled ventilation, there should be no airflow at the end of inspiration, and the end-inspiratory airway pressure (Paw) will be equivalent to the peak alveolar pressure at the end of inspiration.
 (25.5)
The change in pressure attributed to the elastic forces of the lungs and chest wall is the pressure difference between the end-inspiratory Paw and PEEP:
 (25.6)
(Note: These relationships are valid only when there is no airflow at the end of inspiration. Inspiratory flow may not return to zero at end-inspiration in patients who are breathing rapidly; in this situation, the end-inspiratory airway pressure will be higher than alveolar pressure.)
Since inspiratory flow is not constant during pressure-controlled ventilation, it is not possible to evaluate airway resistance during lung inflation. Resistance to expiratory flow (described later) can be used to evaluate airways resistance during pressure-controlled ventilation.
End-Expiratory Pressure
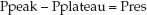
The end-expiratory pressure is the minimum pressure in the alveoli (not airways) during a ventilatory cycle. The different forms of end-expiratory pressure are illustrated in Figure 25.3.
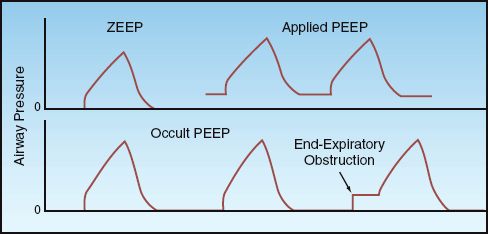
FIGURE 25.3 End-expiratory airway pressures. See text for explanation.
ZEEP
During appropriate ventilation in the normal lung, there is no airflow at the end of expiration, and the pressure in the alveoli is equivalent to atmospheric pressure. Since atmospheric pressure is a zero reference point for breathing, this condition is called zero end-expiratory pressure, or ZEEP.
Applied PEEP
Positive end-expiratory pressure (PEEP) can be added through the ventilatory circuit (via a pressure-sensitive valve in the expiratory limb of the circuit) so that exhalation will cease when the airway pressure falls to the preselected PEEP level. Applied PEEP is used routinely during mechanical ventilation to prevent the collapse of distal airspaces at the end of expiration, and to open collapsed alveoli (recruitment). This is described in the next chapter.
Occult PEEP
When there is continued airflow at the end of expiration, the lungs do not completely empty, and the alveolar pressure remains positive even though the proximal airway pressure falls to atmospheric (zero) pressure. This pressure is sometimes called intrinsic PEEP or auto-PEEP, but occult PEEP seems more appropriate because the PEEP is not apparent in proximal airway pressure recordings (2). Occult PEEP can be the result of dynamic hyperinflation in patients with asthma and COPD, as described in Chap-ter 24 (see pages 477–480), or it can be the result of ventilator settings that predispose to end-expiratory airflow (e.g., high inflation volumes, decreased time for exhalation).
Occult PEEP can be detected on the flow tracing by noting the presence of airflow at the end of expiration, as illustrated in Figure 24.5 (see page 479). If occult PEEP is present, it can be quantified by occluding the expiratory circuit at the end of expiration. During an end-expiratory occlusion, alveolar pressure will equilibrate with proximal airway pressure, and the occult PEEP becomes apparent as a abrupt increase in airway pressure, as shown in Figure 25.3. Occult PEEP is described in more detail in Chapter 28.
Mean Airway Pressure
The mean airway pressure is the average pressure in the airway during the ventilatory cycle, and is influenced by several variables, including the peak airway pressure, the contour of the pressure waveform, the PEEP level, the respiratory rate, and the inflation time relative to the total time of the ventilatory cycle (TI/Ttot). The mean airway pressure that is displayed by ventilators is obtained by integrating the area under the airway pressure waveform.
The mean airway pressure is linked to the hemodynamic effects of positive pressure ventilation. (The intrapleural pressure is the important influence on cardiac function, but this pressure is measured with an intraesophageal balloon, and is not monitored routinely.) Typical values for mean airway pressure during positive pressure ventilation are 5–10 cm H2O for normal lungs, 10–20 cm H2O for airflow obstruction, and 20–30 cm H2O for noncompliant (stiff) lungs (3).
Thoracic Compliance
Compliance (∆volume/∆pressure) is the reciprocal of elastance, and is the traditional term used to express the elastic properties of structures with chambers (like the heart and lungs). Compliance expresses distensibility, or the tendency of a chamber to increase in volume when exposed to a given distending pressure. The compliance that is measured during mechanical ventilation is the thoracic compliance, and includes both the lungs and the chest wall.
Volume-Controlled Ventilation
During volume-controlled ventilation, the static compliance of the thorax (Cstat) is expressed as the preselected tidal volume (VT) divided by the difference between the plateau pressure and the total PEEP level (applied plus occult PEEP):
 (25.7)
This is a “static” compliance because the pressures involved are measured in the absence of airflow. In patients with normal lungs, Cstat is 50–80 mL/cm H2O (4), and in patients with infiltrative lung diseases (e.g., pulmonary edema or acute respiratory distress syndrome), Cstat is typically <25 mL/cm H2O (1).
Pressure-Controlled Ventilation
Compliance measurements are difficult during pressure-controlled ventilation because: (a) there must be no inspiratory flow at the end of inspiration (which is not always the case), and (b) the tidal volume varies with changes in airway resistance and thoracic compliance during pressure-controlled ventilation. Under ideal conditions (i.e., no airflow at end-inspiration and stable lung mechanics) Cstat is equivalent to the exhaled tidal volume (exhaled VT) divided by the difference between the end-inspiratory airway pressure (Paw) and the total PEEP level:
 (25.8)
Sources of Error
1. During passive ventilation, the chest wall can account for 35% of the total thoracic compliance (5,6), and this contribution increases when the chest wall muscles contract. Therefore, to avoid interference from respiratory muscle contraction, static compliance measurements should be performed only in patients who are not actively breathing.
2. Thoracic compliance is volume-dependent; i.e., it decreases as lung volume increases. Absolute lung volumes cannot be measured during mechanical ventilation. However, serial measurements of Cstat should be performed at the same tidal volume(s).
3. The tidal volume used for the compliance measurement should be adjusted for the compliance of the ventilator tubing, which is typically
3 mL/cm H2O (1). For example, if the preselected tidal volume during volume-controlled ventilation is 500 mL and the peak airway pressure is 40 cm H2O, then 3×40 = 120 mL of the delivered volume will be lost to expansion of the ventilator tubing, and the actual tidal volume reaching the patient will be 500 – 120 = 380 mL. When using exhaled tidal volumes, the peak alveolar pressure at end-inspiration should be used for the volume adjustments.
Airway Resistance
Airway resistance can be measured during inspiration or expiration, although expiratory airway resistance provides more information about flow resistance in small airways.
Inspiratory Resistance
The resistance to airflow during inspiration can only be determined if the inspiratory flow rate is constant (e.g., during volume-controlled ventilation). In this case, the inspiratory resistance (Rinsp) is the pressure gradient needed to overcome the resistive forces in the lungs and chest wall (Ppeak – Pplateau) divided by the inspiratory flow rate [V (insp)]:
 (25. 9)
An example of the Rinsp calculation for a patient with normal lungs is as follows: Ppeak = 15 cm H2O, Pplateau = 10 cm H2O, V (insp) = 60 L/min (1 L/sec), so Rinsp = (15 – 10)/1 = 5 cm H2O/L/sec. The minimal flow resistance in large-bore endotracheal tubes is 3 to 7 cm H2O/L/sec (6), so most of the inspiratory resistance in patients with normal lungs represents the resistance to flow in the endotracheal tube. The contribution of nonpulmonary resistive elements like endotracheal tubes is one of the shortcomings of the airway resistance determinations.
Expiratory Resistance
The resistance to expiratory airflow is more likely to detect the tendency for small airways to collapse during mechanical ventilation. The expiratory resistance (Rexp) can be measured using the driving pressure for expiratory airflow (the peak alveolar pressure at the end of inspiration minus the total PEEP level), and the peak expiratory flow rate (PEFR); i.e.,
 (25.10)
Rexp is usually higher than Rinsp, which reflects the tendency of the airways to narrow as lung volume decreases during expiration. However, like the Rinsp, the Rexp is significantly influenced by nonpulmonary resistive elements (e.g., endotracheal tube and exhalation valves).
LUNG INJURY
Normal breathing is accomplished by pulling air into the lungs, and as much as 5 liters of air can be drawn in during a single breath (from residual volume to total lung capacity) without noticeable injury to the lungs. On the other hand, positive pressure ventilation pushes air into the lungs, and this push creates abnormal stresses and strains that can damage the architecture of the lungs, particularly diseased lungs, with single-breath volumes of less than one-half liter (7,8). An example of the structural damage produced by mechanical ventilation is shown in Figure 25.4 (9).
There are several types of ventilator-induced lung injury (VILI), as described in this section. Since VILI has been studied primarily in patients with acute respiratory distress syndrome (ARDS), a brief description of VILI is also included in the chapter describing ARDS (see pages 454–455).
Volutrauma
In the early days of positive pressure ventilation, large tidal volumes were adopted to prevent atelectasis (10). Tidal volumes of 10 to 15 mL/kg (ideal body weight) became standard during mechanical ventilation, compared to normal tidal volumes of 5 to 7 mL/kg during spontaneous breathing. From the outset, it was clear that mechanical ventilation could rupture alveoli and produce air leaks (barotrauma), but in the 1970s, a study was published showing that high inflation pressures could produce diffuse pulmonary infiltration that resembles pulmonary edema (11). This was followed by a landmark study in the 1980s showing that high inflation volumes, rather than high inflation pressures, were responsible for the lung injury produced by mechanical ventilation (12). The results of this study are shown in Figure 25.5. Note that marked increases in extravascular lung water occurred only when inflation volumes were high, regardless of the inflation pressure. As a result of this study, the term volutrauma was adopted to describe the underlying mechanism for the pulmonary infiltration produced by mechanical ventilation.
The lung injury in VILI is not watery pulmonary edema, but is the result of overdistension of alveoli and disruption of the alveolar-capillary interface, leading to inflammatory infiltration of the lungs and a clinical condition that resembles ARDS (13).
Infiltrative Lung Diseases
The effects of high inflation volumes are more marked in infiltrative lung diseases like pneumonia and ARDS because the inflation volumes are distributed preferentially to regions of normal lung function. In this situation, the high inflation volumes are being delivered to lungs with a decrease in functional lung volume (see Figure 23.4 on page 454), and this predisposes to volutrauma from overdistension of alveoli in normal lung regions.
FIGURE 25.4 Electron micrographs showing a tear at the alveolar-capillary interface attributed to alveolar overdistension during mechanical ventilation. Post mortem specimen from a patient with ARDS. Scales shown in lower right corner of each image. Images from Reference 7, and digitally retouched.
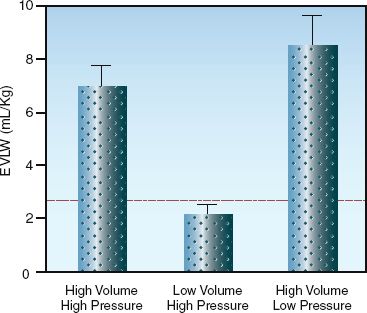
FIGURE 25.5 Effects of high pressures and high volumes on extravascular lung water (EVLW) during positive pressure ventilation. Height of the bars represents mean values, and hatched bars represent standard deviations of the mean. Dotted line represents the upper 95% limit of EVLW measurements obtained during ventilation at normal pressures and volumes. Data from Reference 12.
Low-Volume Ventilation
Concern for the risk of lung injury during conventional, high-volume ventilation prompted clinical studies evaluating lower tidal volumes during mechanical ventilation, mostly in patients with ARDS. The largest study to date included over 800 patients with ARDS (14), and compared ventilation with tidal volumes of 6 mL/kg and 12 mL/kg using predicted body weight (which is the weight at which lung volumes are normal). Ventilation with low tidal volumes was associated with a shorter duration of mechanical ventilation and 9% (absolute) reduction in mortality. As a result of this study (and other corroborating studies), a low-volume ventilation protocol known as lung protective ventilation is now recommended for all patients with ARDS. This protocol is presented later in the section.
Atelectrauma
During mechanical ventilation, small airways tend to collapse by the end of expiration, particularly in pulmonary conditions associated with reduced lung compliance (e.g., pulmonary edema, ARDS). Repetitive opening and closing of small airways during positive pressure ventilation can damage the airway epithelium, possibly by generating excessive shear forces (15). This type of lung injury is called atelectrauma (8), and it can be mitigated by the use of positive end-expiratory pressure (PEEP), which provides a pressurized “stent” to keep the small airways open during expiration.
Biotrauma
The most intriguing form of VILI is the ability of positive pressure ventilation to promote proinflammatory cytokine release from the lungs at inflation volumes that do not produce structural damage in the lungs (16). This is called biotrauma, and it can trigger the systemic inflammatory response syndrome, and can lead to inflammatory injury in the lung as well as other organs. This means that mechanical ventilation can be a source of inflammatory-mediated multiorgan failure (17), like that seen in severe sepsis and septic shock. This is not good.
Barotrauma
Positive pressure ventilation can also produce air leaks from a rupture in the airways and distal airspaces. The air that escapes can enter the pleural space (pneumothorax), or it can move along the bronchovascular bundles into the mediastinum (pneumomediastinum) and up into the subcutaneous tissues (subcutaneous emphysema), or it can track down the mediastinum and enter the peritoneal cavity (pneumoperitoneum). This form of VILI is called barotrauma, even though the source of injury can be high alveolar volume (i.e., volutrauma).
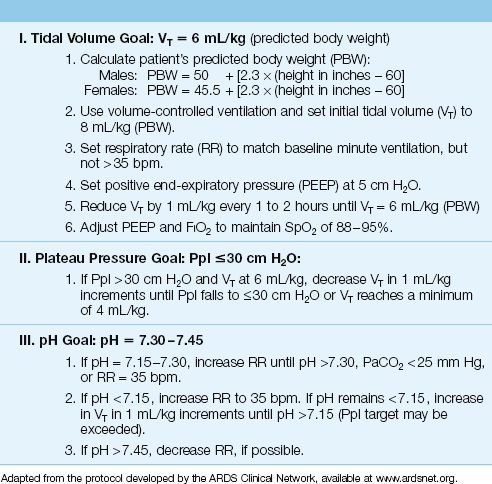
Lung Protective Ventilation
The protocol shown in Table 25.1 is known as lung protective ventilation, and it is designed to limit the risk of all forms of VILI. The important elements of this protocol are as follows:
1. Ventilation begins with a tidal volume of 8 mL/kg, based on predicted body weight (not actual or ideal body weight), and this is gradually reduced to 6 mL/kg.
2. The plateau pressure is not allowed to rise above 30 cm H2O. (Since the plateau pressure is equivalent to the peak alveolar pressure, a plateau pressure above 30 cm H2O is a reflection of excessive alveolar volume.)
3. A minimum PEEP level of 5 cm H2O is used to prevent small airways from collapsing at end-expiration (to prevent atelectrauma).
4. A rise in arterial PCO2 is allowed during low-volume ventilation as long as the arterial pH does not fall below 7.30. This strategy is known as permissive hypercapnia (18).
Lung protective ventilation is now recommended for all patients with ARDS who require mechanical ventilation. The full protocol is available on the ARDS Clinical Network website (www.ardsnet.org).
Table 25.1 Protocol for Lung Protective Ventilation in ARDS
THE PLATEAU PRESSURE: As mentioned in Chapter 23, clinical studies have not shown a consistent survival benefit with lung protective ventilation in ARDS, and this discrepancy appears to be related to the plateau pressure; i.e., a survival benefit with low-volume, lung protective ventilation is demonstrated only when the plateau pressure is above 30 cm H2O during conventional, high-volume (10–15 mL/kg) ventilation (19). Therefore, a plateau pressure ≤30 cm H2O seems more important than a low tidal volume for protecting the lungs from ventilator-induced injury.
A STANDARD PRACTICE?: Although lung protective ventilation is recommended only for patients with ARDS, there are reports that VILI can occur during conventional ventilation in patients who do not have ARDS (20), and that lung protective ventilation is associated with improved outcomes in non-ARDS patients (21). These observations, combined with the strong physiological basis for lung protective ventilation, should lead to the adoption of lung protective ventilation for all patients who require mechanical ventilation.
CARDIAC PERFORMANCE
The influence of positive pressure ventilation on cardiac performance is complex, and involves the preload and afterload forces for the right and left sides of the heart (22). These forces are described in Chapter 9.
Preload
Positive pressure ventilation can reduce ventricular filling (preload) in several ways, and these are indicated in Figure 25.6. First and foremost, positive intrathoracic pressure decreases the pressure gradient for venous inflow into the thorax (although positive-pressure ventilation also increases intra-abdominal pressure, which tends to maintain the pressure gradient for venous inflow into the thorax). Second, positive pressure on the outer surface of the heart decreases the transmural pressure during diastole, and this will reduce ventricular filling. Finally, positive pressure ventilation increases pulmonary vascular resistance, and this can impede right ventricular stroke output and hence impede left ventricular filling. In this situation, the right ventricle can dilate and push the interventricular septum toward the left ventricle, and this reduces left ventricular chamber size and further reduces left ventricular filling. This phenomenon, known as ventricular interdependence, is one of the mechanisms whereby right heart failure can impair the performance of the left side of the heart (see Fig. 13.4 on page 247).
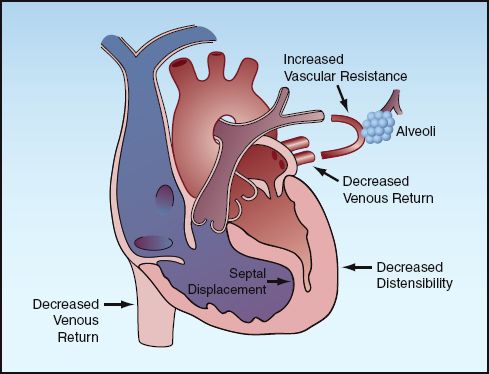
FIGURE 25.6 The mechanisms for a decrease in ventricular filling (preload) during positive pressure ventilation.
Afterload
Left ventricular afterload is a function of the peak transmural wall pressure during systole (see Figure 9.7 on page 161), which is the pressure that ventricular contraction must overcome to eject the stroke volume. Positive intrapleural pressure decreases this transmural pressure, and thereby decreases left ventricular afterload. (Conceptually, positive intrapleural pressure acts like a hand that squeezes the ventricles during systole.) Therefore, positive pressure ventilation reduces ventricular afterload, and this effect can augment cardiac output in certain situations (see next).
Cardiac Output
The overall effect of positive pressure ventilation on cardiac output is determined by the balance between the decrease in ventricular preload (which reduces cardiac output) and the decrease in ventricular afterload (which increases cardiac output) during positive pressure ventilation. This balance is determined by cardiac function, intravascular volume, and intrathoracic pressure.
Cardiac Function
The curves in Figure 25.7 show the superimposed influence of preload and afterload on cardiac output in the normal and failing heart. The normal heart operates on the steep portion of the preload curve and the flat portion of the afterload curve. In this situation, a decrease in preload has a greater influence on cardiac output than a decrease in afterload (as indicated by the arrows), so cardiac output is expected to decrease during positive pressure ventilation. However, as mentioned earlier, positive pressure ventilation also increases intra-abdominal pressure (by pushing the diaphragm down into the abdomen), and this serves to maintain the venous inflow into the thorax. As a result, the decrease in venous return (preload) can be minimal during positive pressure ventilation, and the cardiac output can decrease slightly, show no change, or even increase slightly (from the afterload reducing effect).
In contrast, the failing heart operates on the flat portion of the preload curve and the steep portion of the afterload curve. In this situation, the decrease in afterload during positive pressure ventilation has a greater influence on cardiac output than the decrease in preload, and cardiac output will increase during positive pressure ventilation. This is the basis for the use of positive pressure breathing as a “ventricular assist” maneuver in patients with advanced heart failure (23,24).
Low Intravascular Volume
When the intravascular volume is reduced, the preload-reducing effect of positive pressure ventilation predominates in both the normal and failing heart, and cardiac output will decline (22). This is particularly the case when intrathoracic pressures are high during mechanical ventilation. Maintaining a normal or adequate intravascular volume is essential during positive pressure ventilation to avoid significant deficits in cardiac output.
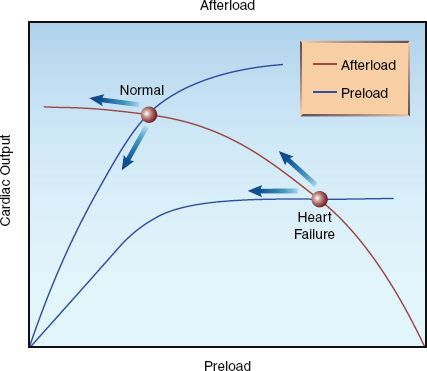
FIGURE 25.7 Superimposed curves for the relationship between preload, afterload, and cardiac output in the normal and failing heart. Arrows indicate the effects of positive pressure ventilation.
A FINAL WORD
Less Is Best
For the first 30 years after its introduction, positive pressure ventilation was dominated by large inflation volumes and high pressures, but this has changed since the discovery that pushing air into the lungs creates stresses and strains that damage the lungs, and can lead to damage in other organs as well. The emphasis now is on limiting inflation volumes and preventing overdistension of alveoli. This “less is best” strategy is currently advised only for patients with ARDS, but it seems likely that it will (and should) be adopted for all patients who require positive pressure ventilation.
REFERENCES
Books
Papadakos PJ, Lachmann B, eds. Mechanical ventilation: clinical applications and pathophysiology. Philadelphia: Saunders, Elsevier, 2008.
Basics
1. Bekos V, Marini JJ. Monitoring the mechanically ventilated patient. Crit Care Clin 2007; 23:575–611.
2. Pepe P, Marini JJ. Occult positive end-expiratory pressure in mechanically ventilated patients with airflow obstruction. The auto-PEEP effect. Am Rev Respir Dis 1982; 126:166–170.
3. Hess DR, Kacmarek RM. Basic pulmonary mechanics during mechanical ventilation. In: Essentials of Mechanical Ventilation. New York, McGraw-Hill, 1996:171–176.
4. Tobin MJ. Respiratory monitoring. JAMA 1990; 264:244–251.
5. Marini JJ. Lung mechanics determinations at the bedside: instrumentation and clinical application. Respir Care 1990; 35:669–696.
6. Katz JA, Zinn SE, Ozanne GM, Fairley BB. Pulmonary, chest wall, and lung– thorax elastances in acute respiratory failure. Chest 1981; 80:304–311.
Lung Injury
7. Dreyfuss D, Saumon G. Ventilator-induced lung injury. Am Rev Respir Crit Care Med 1998; 157:294–323.
8. Gattinoni L, Protti A, Caironi P, Carlesso E. Ventilator-induced lung injury: the anatomical and physiological framework. Crit Care Med 2010; 38(Suppl):S539–S548.
9. Hotchkiss JR, Simonson DA, Marek DJ, et al. Pulmonary microvascular fracture in a patient with acute respiratory distress syndrome. Crit Care Med 2002; 30:2368–2370.
10. Bendixen HH, Egbert LD, Hedley-White J, et al. Respiratory care. St. Louis: Mosby, 1965; 137–153.
11. Webb HH, Tierney DE. Experimental pulmonary edema due to intermittent positive pressure ventilation with high inflation pressures: protection by positive end-expiratory pressure. Am Rev Respir Dis 1974; 110:556–565.
12. Dreyfuss D, Soler P, Basset G, et al. High inflation pressure pulmonary edema: Respective effects of high airway pressure, high tidal volume, and positive end-expiratory pressure. Am Rev Respir Dis 1988; 137:1159–1164.
13. Timby J, Reed C, Zeilander S, Glauser F. “Mechanical” causes of pulmonary edema. Chest 1990; 98:973–979.
14. The Acute Respiratory Distress Syndrome Network. Ventilation with lower tidal volumes as compared with traditional tidal volumes for acute lung injury and the acute respiratory distress syndrome. N Engl J Med 2000; 342(18):1301–1308.
15. Muscedere JG, Mullen JBM, Gan K, Slutsky AS. Tidal ventilation at low airway pressures can augment lung injury. Am J Respir Crit Care Med 1994; 149:1327–1334.
16. Ranieri VM, Suter PM Tortorella C, et al. Effect of mechanical ventilation on inflammatory mediators in patients with acute respiratory distress syndrome: A randomized controlled trial. JAMA 1999; 282:54–61.
17. Ranieri VM, Giunta F, Suter P, Slutsky AS. Mechanical ventilation as a mediator of multisystem organ failure in acute respiratory distress syndrome. JAMA 2000; 284:43–44.
18. O’Croinin D, Ni Chonghaile M, Higgins B, Laffey JG. Bench-to-Bedside review: Permissive hypercapnia. Crit Care 2005; 9(1):51–59.
19. Petrucci N, Iacovelli W. Ventilation with lower tidal volumes versus traditional tidal volumes for acute lung injury and acute respiratory distress syndrome. Cochrane Database Syst Rev 2004; (2):CD003844.
20. Gajic O, Dara SI, Mendez JL, et al. Ventilator-associated lung injury in patients without acute lung injury at the onset of mechanical ventilation. Crit Care Med 2004; 32:1817–1824.
21. Serpa Neto A, Cardoso SO, Manetta JA, et al. Association between the use of lung-protective ventilation with lower tidal volumes and clinical outcomes among patients without acute respiratory distress syndrome: a meta-analysis. JAMA 2012; 308:1651–1659.
Cardiac Performance
22. Singh I, Pinsky MR. Heart-lung interactions. In Papadakos PJ, Lachmann B, eds. Mechanical ventilation: clinical applications and pathophysiology. Philadelphia: Saunders Elsevier, 2008:173–184.
23. Yan AT, Bradley TD, Liu PP. The role of continuous positive airway pressure in the treatment of congestive heart failure. Chest 2001; 120:1675–1685.
24. Boehmer JP, Popjes E. Cardiac failure: Mechanical support strategies. Crit Care Med 2006; 34(Suppl):S268–S277.


Stay updated, free articles. Join our Telegram channel

Full access? Get Clinical Tree


