On the Educational Value
of the Medical Society, in
Aequanimitas, 1904
The introduction of optical techniques for the continuous and noninvasive measurement of oxyhemoglobin saturation in blood (oximetry) and carbon dioxide in exhaled gas (capnometry) has provided the most useful advances in critical care monitoring in the last 30 years. Oximetry has had an enormous impact on patient care throughout the hospital, and the arterial O2 saturation has been called the fifth vital sign (1,2), while infrared capnometry has emerged as an indispensable component of cardiopulmonary resuscitation (see pp. 334–335).
Despite the prominent role of oximetry and capnography in critical care management, surveys have shown that 97% of house staff and ICU nurses have little or no understanding of these techniques or the parameters that are monitored (3). The material in this chapter should help to correct this situation.
OXIMETRY
All atoms and molecules absorb specific wavelengths of light, and this property is the basis for the technique known as spectrophotometry, where light waves of specific wavelengths are transmitted through a medium to determine the molecular composition of the medium. The absorption of specific wavelengths of light as they pass through a medium is proportional to the concentration of the substance that absorbs the light waves, and the length of the path that the waves travel (as defined by the Lambert-Beer Law). The application of this principle to the detection of hemoglobin in its different forms is known as oximetry.
Light Absorption by Hemoglobin
Hemoglobin (like all proteins) changes its structural configuration when it participates in a chemical reaction, and each of the configurations has a distinct pattern of light absorption. The patterns of light absorption for the different forms of hemoglobin are shown in Figure 21.1 (4). Four different forms of hemoglobin are represented in the figure: oxygenated hemoglobin (HbO2), deoxygenated hemoglobin (Hb), methemoglobin (metHb), and carboxyhemoglobin (COHb). In the red region of the light spectrum (represented by the wavelength of 660 nm), oxygenated hemoglobin (HbO), does not absorb light as well as deoxygenated hemoglobin (Hb), which is why oxygenated blood is more intensely red than deoxygenated blood. The opposite is true in the infrared region of the spectrum (represented by the wavelength of 940 nm), where HbO2 absorbs light more effectively than Hb. Based on these absorption patterns, two wavelengths of light (660 nm and 940 nm) can be used to identify oxygenated and deoxygenated hemoglobin.
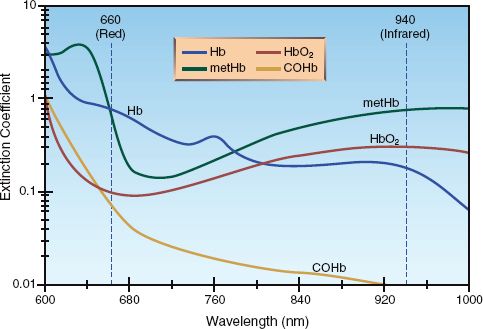
FIGURE 21.1 The absorption spectrum for the different forms of hemoglobin: oxygenated hemoglobin (HbO2), deoxygenated hemoglobin (Hb), carboxyhemoglobin (COHb), and methemoglobin (metHb) The vertical lines represent the two wavelengths of light (660 nm and 940 nm) used by pulse oximeters. Adapted from Reference 4.
Early Oximetry
Oximetry was introduced in the 1940s to detect hypoxemia in fighter pilots. Early oximetry, which measured the transmission of red and infra-red light waves through the earlobe, had two major shortcomings: (a) the transmission of light was influenced by factors other than hemoglobin (e.g., skin pigments, and the thickness of the earlobe), and (b) it was not possible to differentiate between hemoglobin in arteries and veins. As a result of these problems, oximetry failed to gain acceptance as a monitoring tool, but this situation changed in the 1970s with the introduction of pulsatile oximetry.
Pulse Oximetry
When a light beam passes through a pulsating artery, the phasic changes in arterial blood volume create pulsatile variations in the intensity of the transmitted light beam. Therefore, restricting the analysis of light transmission to pulsatile light waves will focus the analysis on arterial blood, and will eliminate errors due to light absorption by non-pulsatile elements (e.g., hemoglobin in veins). This is the basic principle of pulse oximetry (4,5), which employs an alternating-current (AC) amplifier to process pulsatile light transmission from arteries while rejecting non-pulsatile light transmission through veins, connective tissue, and skin.
The basic features of pulse oximetry are illustrated in Figure 21.2. The upper panel shows a standard pulse oximeter probe that is placed on a finger. (These probes are usually placed on the index or middle finger, but can be placed on any digit, including the great toe.) One side of the probe contains two light-emitting diodes that emit monochromatic light at wavelengths of 660 nm and 940 nm. These light waves pass through the finger and are sensed by a photodetector on the opposite side of the probe. The transmitted light waves are then passed through an AC amplifier that amplifies the pulsatile light waves and blocks the non-pulsatile waves. The intensity of light transmission at 660 nm and 940 nm is a reflection of the deoxygenated hemoglobin (Hb) and oxygenated hemoglobin (HbO2) concentrations in arterial blood, respectively. The pulse oximeter converts “light density” to “chemical density” (concentration) for Hb and HbO2 using proprietary algorithms. The ratio of HbO2 to total hemoglobin (HbO2 + Hb) is then used to define the fraction of hemoglobin that is saturated with oxygen. The resulting “pulse oximeter saturation” (SpO2) is expressed as a percentage;
 (21.1)
The lower panel of Figure 21.2 shows the pulsatile output of the pulse oximeter, which is strikingly similar to an arterial pressure waveform.
Reliability
At clinically acceptable levels of arterial oxyhemoglobin saturation (SaO2 >70%), the O2 saturation recorded by pulse oximeters (SpO2) differs by less than 3% from the actual SaO2 (6,7). In addition to accuracy, the SpO2 shows little tendency for spontaneous variations, as indicated in Table 21.1 (8).
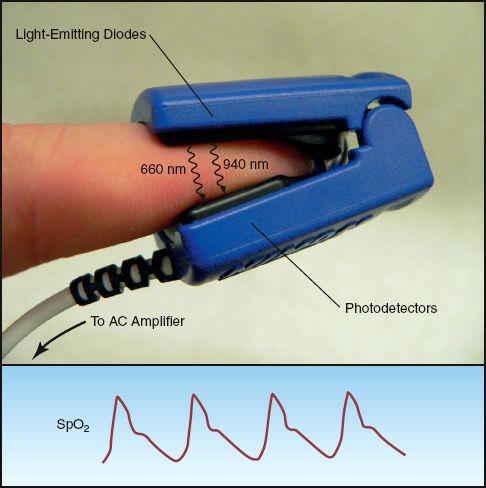
FIGURE 21.2 Fingertip pulse oximetry. The fingertip probe has light-emitting diodes (LEDs) on one side that emit light in the red (660 nm) and infrared (940 nm) spectrum, and a photodetector on the opposite side that processes light waves of alternating intensity (using an AC amplifier). The lower panel shows the pulsatile oximetry signal (SpO2) that is displayed on the bedside monitor.
Table 21.1 Variability in Oximetry and Capnometry Recordings

Dyshemoglobinemias
Standard pulse oximeters do not detect carboxyhemoglobin (COHb) or methemoglobin (metHb) in blood. Normally, these hemoglobin variants account for less than 5% of the total hemoglobin pool in blood (7,9). When metHb or COHb levels are abnormally elevated, the arterial O2 saturation (SaO2) decreases because HbO2 is a lower fraction of the total hemoglobin pool. However, the SpO2 from pulse oximetry is not influenced by COHb or metHb levels (10,11). Therefore, in cases of methemoglobinemia and carbon monoxide poisoning, the SpO2 overestimates the true SaO2, and is not a reliable marker of arterial O2 desaturation.
Hospital laboratories have large oximeters that use 8 wavelengths of light to measure all the hemoglobin variants in blood. Therefore, when abnormal elevations of metHb or COHb are suspected, an arterial blood sample should be sent to the hospital laboratory for a complete oximetry assessment. Newer blood gas analyzers are also equipped with 8 wavelengths of light, and can measure the levels of metHb and COHb in blood. (Carbon monoxide poisoning and methemoglobinemia are de-scribed in Chapter 55.)
Note: A pulse oximeter is now available that uses multiple wavelengths of light to detect all forms of hemoglobin (Rainbow Pulse CO-oximeter, Masimo Corp, Irvine, CA) (12). These devices are used by firefighters and emergency first responders for rapid, on-site detection of carbon monoxide exposure, and are not meant for routine SpO2 monitoring in a hospital setting.
Hypotension
Although pulse oximetry is based on the presence of pulsatile blood flow, SpO2 is an accurate reflection of SaO2 at blood pressures as low as 30 mm Hg (13). Damped pulsations also do not affect the accuracy of fingertip SpO2 recordings distal to a cannulated radial artery (14). When fingertip SpO2 recordings are unreliable as a result of hypotension or peripheral vasoconstriction, the forehead is an alternate site for SpO2 monitoring (see later).
Anemia
In the absence of hypoxemia, pulse oximetry is accurate down to hemoglobin levels as low as 2 to 3 g/dL (15). At hemoglobin levels between 2.5 and 9 g/dL, SpO2 is within 1% of the SaO2 (15).
Pigments
The influence of skin and fingernail color on the accuracy of SpO2 measurements has been severely curtailed by the introduction of pulse oximetry. Dark skin can produce a up to a 10% discrepancy between SpO2 and SaO2, but this occurs at O2 saturations between 70% and 80% (16), which are much lower than allowed in ICU patients. Dark fingernail polish produces a very small (2%) discrepancy between SpO2 and SaO2 (17), but the clinical significance of this effect is in doubt.
Forehead Pulse Oximetry
The forehead is an appealing site for pulse oximetry because the arterial circulation in the forehead (which originates from the internal carotid artery) is less prone to vasoconstriction than the digital arteries in the fingers (18). Clinical studies have shown that pulse oximetry in the forehead can provide suitable SpO2 measurements when fingertip SpO2 recordings are compromised by hypotension or peripheral vasoconstriction (19). The basic features of forehead pulse oximetry are shown in Figure 21.3. Forehead SpO2 sensors are placed just above the eyebrows, where vascular density is greatest. The forehead sensors have light-emitting diodes and photodetectors positioned next to each other, and they record the light intensity reflected back from the underlying arteries to derive the SpO2. This method of reflectance oximetry differs from the method of transmission oximetry used by the fingertip SpO2 sensors.
Venous Pulsations
The major limitation of forehead pulse oximetry is the risk of spuriously low SpO2 readings when there is localized venous congestion (e.g., from positive-pressure mechanical ventilation). This effect is attributed to en-hanced venous pulsations, which are misread as arterial pulsations, resulting in SpO2 readings that include reflections from HbO2 and Hb in venous blood. This effect can be minimized with an elastic headband, as shown in Figure 21.3, which helps to dispel venous blood from the forehead (20). These headbands are often provided with the forehead SpO2 sensors.
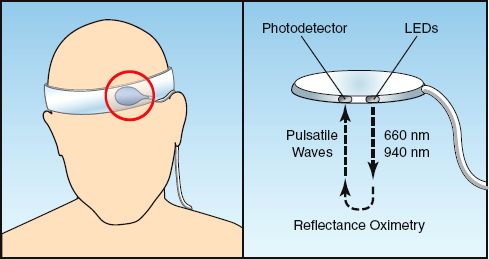
FIGURE 21.3 Forehead pulse oximetry. The forehead probe (circled in red) is placed just above the eyebrows, and an elastic headband is used to reduce venous pulsations. The probe has light-emitting diodes (LEDs) and photodetectors placed next to each other, and the intensity of pulsatile light waves that are reflected back from the underlying arteries is used to determine the SpO2.
Using Pulse Oximetry
In theory, pulse oximetry is indicated in any situation where arterial oxygenation is a concern. In reality, pulse oximetry is considered a requirement for patient safety in certain areas of the hospital (e.g., ICUs and operating suites), and pulse oximetry is mandatory for all patients in these areas. Therefore, the important issue concerning the use of pulse oximetry in the ICU is not when to use it, but how to use it. The following information is relevant in this regard.
SpO2 and Arterial O2 Content
As a surrogate measure of the O2 saturation of hemoglobin in arterial blood (SaO2), the SpO2 is one of the determinants of the O2 concentration in arterial blood (CaO2), as described in the following equation.
 (21.2)
(1.34 is the oxygen binding capacity of hemoglobin in mL/g, and [Hb] is the hemoglobin concentration in blood in g/dL.) In an idealized situation where [Hb] = 15 g/dL and SpO2 = 0.98, the CaO2 is 19.7 mL/dL (or 197 mL/L). A 10% decrease in SpO2 (from 0.98 to 0.88), which is considered a clinically relevant change, results in a 10% decrease in CaO2 (from 19.7 to 17.7 mL/dL). Based on this information, the following statements about the SpO2 are valid:
1. Since the SaO2 is not the sole determinant of the arterial O2 content, monitoring the SpO2 provides only partial information about arterial oxygenation.
2. Changes in SpO2 that are considered clinically relevant are associated with only minor changes in the O2 content of arterial blood.
Lowest Tolerable SpO2
A standard practice in the management of respiratory failure is to maintain the SpO2 above a certain level by adjusting the O2 concentration in inspired gas. However, opinions vary about the lowest tolerable SpO2. In one survey of 25 ICU directors, the lowest acceptable SpO2 varied from 85% to 95% (21). Studies in ventilator-dependent patients have shown that the threshold for hypoxemia (PaO2 = 60 mm Hg) occurs at SpO2 levels of 92% to 95% (21). However, it is important to emphasize that the lowest SpO2 needed to support aerobic metabolism has never been identified, so the choice of a minimally acceptable SpO2 is largely empirical.
Venous Oximetry
Specialized oximetry catheters are available that can monitor the O2 saturation of hemoglobin in the superior vena cava or pulmonary artery, and the operation of these catheters is illustrated in Figure 21.4. Oximetry catheters contain fiberoptic bundles that transmit two wavelengths of light (red and infrared) from an external light source to the tip of the catheter. Another channel of the catheter is connected to a photodetector that records the intensity of light that is reflected back from the hemoglobin in circulating erythrocytes. This technique (reflectance ox-imetry) is similar to the one used in forehead pulse oximetry. Oximetry catheters process and display the venous O2 saturation every 5 seconds.

FIGURE 21.4 Venous oximetry using a specialized catheter that records the venous O2 saturation (SvO2) using reflectance oximetry.
Venous O2 Saturation
The O2 saturation in mixed venous (pulmonary artery) blood and central venous (superior vena cava) blood (SvO2 and ScvO2, respectively) are described in Chapter 10 (see pp. 183–184). Both measurements are influenced by the balance between systemic O2 delivery (DO2) and O2 consumption (VO2), as described below:
 (21.3)
(For the derivation of this equation, see Equations 10.17 and 10.18 on page 183.) A decrease in venous O2 saturation below the normal range (SvO2 <65% or ScvO2 <70%) identifies a condition where O2 delivery is low relative to O2 consumption. This condition can be the result of a decrease in DO2 (from low cardiac output, anemia, or arterial O2 desaturation) or an increase in VO2 (from hypermetabolism).
Mixed Venous O2 Saturation
Measurements of SvO2 with pulmonary artery oximetry catheters are typically within 1–2% of in vitro measurements (22). The spontaneous variations in SvO2 can be considerable, as demonstrated in Table 21.1 (23). As a general rule, a greater than 5% change in SvO2 that persists for longer than 10 minutes is considered a significant change (24).
Central Venous O2 Saturation
Measurements of ScvO2 with central venous oximetry catheters (PreSep Catheter, Edwards Life Sciences) are slightly lower than the SvO2, and this difference is magnified in the presence of circulatory shock (25). Single measurements of ScvO2 can differ from SvO2 by as much as 10%, but the difference is reduced (to within 5%) when multiple measurements are obtained (26).
Dual Oximetry
The predictive value of SvO2 or ScvO2 can be increased by adding the SpO2 from pulse oximetry. The difference (SpO2–SvO2) or (SpO2–ScvO2) is roughly equivalent to the O2 extraction from capillary blood (27). Therefore, using the equation for the O2 extraction ratio (see Equation 10.12 on page 181), the following relationships can be defined (using SvO2 instead of ScvO2):
 (21.4)
An increase in (SpO2–SvO2) above the normal range (above 30%) can be the result of an increasing VO2 (hypermetabolism), or a decreasing DO2 (from progressive anemia or a declining cardiac output). An (SpO2–SvO2) that reaches 50% can also be used as a marker of tissue hypoxia, as shown in Figure 10.5 (see page 182).
CAPNOMETRY
Capnometry is the measurement of CO2 in exhaled gas using colorimetric techniques or infrared spectrophotometry.
Colorimetric Capnometry
The colorimetric detection of CO2 in exhaled gas is a quick and simple method of determining if an endotracheal tube has been placed in the lungs (28). This is a standard of care following placement of an endotracheal tube because auscultation for breath sounds is an unreliable method of determining if an endotracheal tube is in the esophagus or trachea (29).
A popular device for the colorimetric detection of CO2 in exhaled gas is shown in Figure 21.5. The central area of the device contains filter paper that is impregnated with a pH-sensitive indicator that changes color as a function of pH. When exhaled gas passes over the filter paper, the CO2 in the gas is hydrated by a liquid film on the filter paper, and the resulting pH is detected by a color change. The outer perimeter of the device contains color-coded sections indicating the concentrations of exhaled CO2 associated with each color change.
Predictive Value
The accuracy of this colorimetric device for predicting the success of endotracheal intubation is shown in Table 21.2 (28). A color change from purple to tan or yellow almost always indicates successful intubation of the trachea. The absence of a color change from purple indicates that the endotracheal tube is not in the trachea, except during a cardiac arrest, when successful intubation of the trachea does not always produce a color change from purple. This latter observation is explained by the fact that exhaled CO2 decreases when cardiac output is reduced, and the absence of a functional cardiac output during a cardiac arrest will result in very low levels of exhaled CO2. Therefore, the lack of a color change from purple on the colorimetric CO2 detector is not evidence of failure to intubate the lungs during a cardiac arrest.
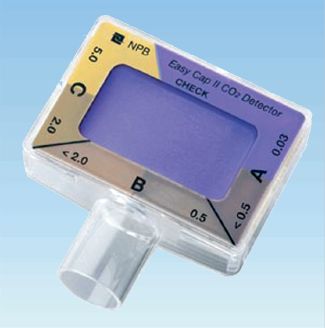
FIGURE 21.5 A disposable device (Nellcor Easy Cap II CO2 Detector) for the colorimetric detection of CO2 in exhaled gas. See text for explanation.
Table 21.2 Performance of Colorimetric CO2 Detector†

Infrared Capnography
Carbon dioxide absorbs light in the infrared spectrum, which is the basis for the use of infrared light absorption to measure the PCO2 in exhaled gas (30). This provides a more quantitative measure of exhaled CO2 than the colorimetric method. Figure 21.6 shows an infrared CO2 probe that has an airway attachment (which is placed in series with the expiratory tubing during mechanical ventilation) and a fitted transducer. When in place, the probe emits a continuous infrared light beam that travels through the exhaled gas. The photodetector has a rapid response, and can measure changes in PCO2 during a single exhalation. This is recorded as an expiratory capnogram like the one in Figure 21.6.
The Capnogram
The shape of the normal capnogram has been described as “the outline of a snake that has swallowed an elephant” (31). The PCO2 at the onset of expiration is negligible because the gas in the upper airways is first to leave the lungs. As exhalation proceeds, gas from the alveoli begins to contribute to the exhaled gas, and the PCO2 begins to rise steadily. The rate of rise eventually declines, and the exhaled PCO2 reaches a plateau. When gas exchange is normal, the PCO2 at the end of expiration (called the end-tidal PCO2) is equivalent to the PCO2 in end-capillary (arterial) blood.
End-Tidal vs. Arterial PCO2
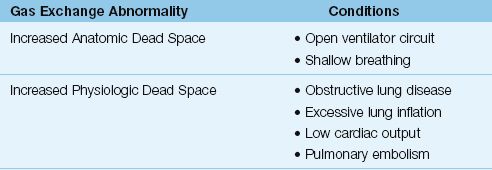
When pulmonary gas exchange is normal, the end-tidal PCO2 is only 2 to 3 mm Hg lower than the arterial PCO2 (30). However, when gas exchange in the lungs is impaired, and specifically when there is increased dead space ventilation, the end-tidal PCO2 decreases relative to the arterial PCO2. In this situation, the PaCO2–PETCO2 difference is greater than 3 mm Hg. The conditions associated with an increased PaCO2–PETCO2 difference are listed in Table 21.3.
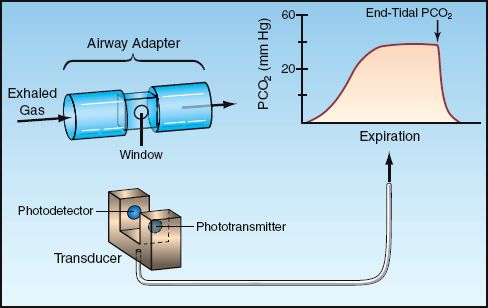
FIGURE 21.6 Infrared capnography. The airway adapter and fitted transducer allow for a steady beam of infrared light to pass through exhaled gas. The photodetector records the PCO2 continuously during each exhalation, which is displayed in the expired capnogram.
Table 21.3 Conditions Associated with an Increased PaCO2–PETCO2 Gradient
The end-tidal PCO2 can be higher than arterial PCO2 in the following situations (32): (a) when CO2 production is high (from hypermetabolism or a metabolic acidosis) and there is a low inflation volume or a high cardiac output, or (b) when the concentration of inhaled O2 is very high (the O2 displaces CO2 from Hb).
Nonintubated Patients
End-tidal PCO2 can be monitored in nonintubated patients using a modified nasal cannula. These are commercially available (Salter divided nasal cannula, DRE Medical, Louisville, KY), or a nasal cannula can be modified as shown in Figure 21.7 (33). The tubing between the two nasal prongs must be occluded (either with a cotton ball inserted through one of the nasal prongs or with a small screw clamp). This allows one nasal prong to be used for oxygen inhalation, while the other nasal prong is used to transmit exhaled gas. A 14-gauge intravascular catheter (2 inches long) is inserted into the exhalation side of the nasal cannula to transmit gas to a CO2 detector. A sidestream CO2 detector (i.e., one that applies suction to draw gas from the tubing) is best suited for this application. If one of these is not available, a mainstream infrared CO2 detector (such as the one shown in Fig. 20.5) can be used with a suction pump to draw gas samples from the cannula (at 150 mL/minute). The respiratory therapy department can help with this modification.
Clinical Applications
The following are some useful applications of end-tidal CO2 monitoring.
Arterial PCO2
The end-tidal PCO2 can be used as a noninvasive method of monitoring the arterial PCO2. The arterial PCO2 should be measured simultaneously with the end-tidal PCO2 to establish the baseline PaCO2–PETCO2 gradient. This gradient should remain the same as long as no other process intervenes to disturb pulmonary gas exchange. Changing ventilator settings will influence the PaCO2–PETCO2 gradient (34), so the arterial PCO2 should be measured after each change in ventilator settings to determine the new relationship between arterial and end-tidal PCO2.
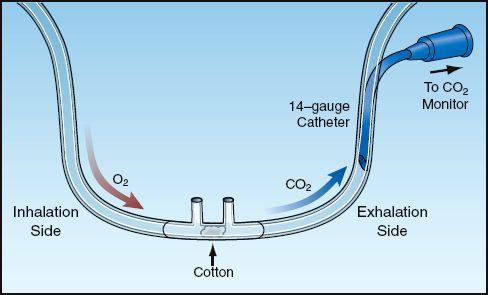
FIGURE 21.7 A modified nasal cannula to monitor end-tidal PCO2 during spontaneous breathing.
Cardiac Output
The most promising application of end-tidal PCO2 monitoring is the noninvasive detection of changes in cardiac output. There is a close correlation between changes in end-tidal PCO2 and changes in cardiac output, as demonstrated in Figure 21.8 (35). This can be useful for detecting acute changes in cardiac output (e.g., in response to volume loading), and is proving very useful for monitoring changes in cardiac output during cardiopulmonary resuscitation (see pages 334–335).
Nosocomial Complications
A sudden decrease in end-tidal PCO2 with an increase in the PaCO2–PETCO2 gradient can be an early warning sign for any of the following conditions:
1. Overdistension of alveoli from high tidal volumes or PEEP.
2. Migration of an endotracheal tube into a mainstem bronchus (36).
3. Acute pulmonary embolism (37).
4. Acute pulmonary edema.
5. Pneumonia.
Ventilator Weaning
During weaning from mechanical ventilation, end-tidal PCO2 monitoring can serve several purposes (38). In uneventful weaning (e.g., following surgery), it serves as a noninvasive measure of PaCO2. In difficult or complicated weaning, it can help determine the success or failure of the wean attempt. For example, a progressive rise in end-tidal PCO2 can be a sign of an increase in the work of breathing (a sign of wean failure), while a decrease in end-tidal PCO2 can be a sign of respiratory muscle weakness with shallow breathing (another sign of failure to wean).
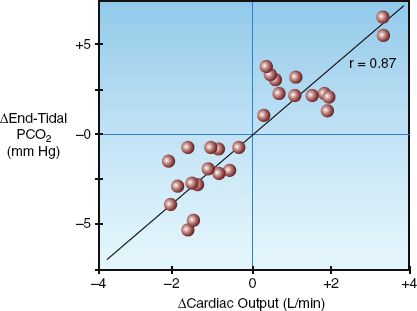
FIGURE 21.8 Relationship between changes in end-tidal PCO2 and changes in cardiac output in a group of postoperative patients. r = correlation coefficient. Data from Reference 35.
A FINAL WORD
Filling the Void
The fall from grace of the pulmonary artery catheter has created a void in the ability to monitor the cardiac output, but the techniques described in this chapter can help to fill this void. Both dual oximetry (i.e., combining pulse oximetry and central venous oximetry) and end-tidal PCO2 monitoring can be useful for evaluating the adequacy of cardiac output, and for detecting changes in cardiac output (e.g., in response to volume loading). End-tidal PCO2 monitoring has the advantage of being totally noninvasive, while dual oximetry has the advantage of monitoring the balance between systemic O2 delivery (DO2) and O2 uptake (VO2). Of course, nothing can replace the pulmonary artery catheter (at least at the present time) for monitoring cardiac output and systemic oxygenation.
REFERENCES
Introduction
1. Neff TA. Routine oximetry. A fifth vital sign? Chest 1988; 94:227.
2. Mower WR, Myers G, Nicklin EL, et. al. Pulse oximetry as a fifth vital sign in emergency geriatric assessment. Acad Emerg Med 1998; 5:858–869.
3. Stoneham MD, Saville GM, Wilson IH. Knowledge about pulse oximetry among medical and nursing staff. Lancet 1994; 344:1339–1342.
Oximetry
4. Barker SJ, Tremper KK. Pulse oximetry: applications and limitations. Internat Anesthesiol Clin 1987; 25:155–175.
5. Ortega R, Hansen CJ, Elterman K, Woo A. Videos in clinical medicine: pulse oximetry. N Engl J Med 2011; 364:e33.
6. Wahr JA, Tremper KK. Noninvasive oxygen monitoring techniques. Crit Care Clin 1995; 11:199–217.
7. Severinghaus JW, Kelleher JF. Recent developments in pulse oximetry. Anesthesiology 1992; 76:1018–1038.
8. Hess D, Agarwal NN. Variability of blood gases, pulse oximeter saturation, and end-tidal carbon dioxide pressure in stable, mechanically ventilated trauma patients. J Clin Monit 1992; 8:111–115.
9. Soubani AO. Noninvasive monitoring of oxygen and carbon dioxide. Am J Emerg Med 2001; 19:141-146.
10. Hampson NB, Piantidosi CA, Thom SR, Weaver LK. Practice recommendations in the diagnosis, management, and prevention of carbon monoxide poisoning. Am J Respir Crit Care Med 2012; 186:1095–1101.
11. Barker SJ, Kemper KK, Hyatt J. Effects of methemoglobinemia on pulse oximetry and mixed venous oximetry. Anesthesiology 1989; 70:112–117.
12. Barker SJ, Badal JJ. The measurement of dyshemoglobins and total hemoglobin by pulse oximetry. Curr Opin Anesthesiol 2008; 21:805–810.
13. Severinghaus JW, Spellman MJ. Pulse oximeter failure thresholds in hypo-tension and vasoconstriction. Anesthesiology 1990; 73:532–537.
14. Morris RW, Nairn M, Beaudoin M. Does the radial arterial line degrade the performance of a pulse oximeter? Anesth Intensive Care 1990; 18:107–109.
15. Jay GD, Hughes L, Renzi FP. Pulse oximetry is accurate in acute anemia from hemorrhage. Ann Emerg Med 1994; 24:32–35.
16. Feiner JR, Severinghaus JW, Bickler PE. Dark skin decreases the accuracy of pulse oximeters at low oxygen saturation: the effects of oximeter probe type and gender. Anesth Analg 2007; 105(Suppl):S18–S23.
17. Chan ED. What is the effect of fingernail polish on pulse oximetry? Chest 2003; 123:2163–2164.
18. Branson RD, Manheimer PD. Forehead oximetry in critically ill patients: the case for a new monitoring site. Respir Care Clin N Amer 2004; 10:359–367.
19. Palve H. Reflection and transmission pulse oximetry during compromised peripheral perfusion. J Clin Monit 1992; 8:12–15.
20. Agashe GS, Coakely J, Mannheimer PD. Forehead pulse oximetry. Headband use helps alleviate false low recordings likely related to venous pulsation artifact. Anesthesiology 2006; 105:1111–1116.
21. Jubran A, Tobin M. Reliability of pulse oximetry in titrating supplemental oxygen therapy in ventilator-dependent patients. Chest 1990; 97:1420–1435.
22. Armaganidis A, Dhinaut JF, Billard JL, et al. Accuracy assessment for three fiberoptic pulmonary artery catheters for SvO2 monitoring. Intensive Care Med 1994; 20:484–488.
23. Noll ML, Fountain RL, Duncan CA, et al. Fluctuation in mixed venous oxygen saturation in critically ill medical patients: a pilot study. Am J Crit Care 1992; 3:102–106.
24. Krafft P, Steltzer H, Heismay M, et al. Mixed venous oxygen saturation in critically ill septic shock patients. Chest 1993; 103:900–906.
25. Rivers EP, Ander DS, Powell D. Central venous oxygen saturation monitoring in the critically ill patient. Curr Opin Crit Care 2001; 7:204–211.
26. Dueck MH, Kilmek M, Appenrodt S, et al. Trends but not individual values of central venous oxygen saturation agree with mixed venous oxygen saturation during varying hemodynamic conditions. Anesthesiology 2005; 103:249–257.
27. Bongard FS, Leighton TA. Continuous dual oximetry in surgical critical care. Ann Surg 1992; 216:60–68.
Colorimetric Capnometry
28. Ornato JP, Shipley JB, Racht EM, et al. Multicenter study of a portable, hand-size, colorimetric end-tidal carbon dioxide detection device. Ann Emerg Med 1992; 21:518–523.
29. Mizutani AR, Ozake G, Benumoff JL, et al. Auscultation cannot distinguish esophageal from tracheal passage of tube. J Clin Monit 1991; 7:232–236.
Infrared Capnography
30. Stock MC. Capnography for adults. Crit Care Clin 1995; 11:219–232. .
31. Gravenstein JS, Paulus DA, Hayes TJ. Capnography in clinical practice. Boston ButterworthHeinemann, 1989; 11.
32. Moorthy SS, Losasso AM, Wilcox J. End-tidal PCO2 greater than PaCO2. Crit Care Med 1984; 12:534–535.
33. Roy J, McNulty SE, Torjman MC. An improved nasal prong apparatus for end-tidal carbon dioxide monitoring in awake, sedated patients. J Clin Monit 1991; 7:249–252.
34. Hoffman RA, Kreiger PB, Kramer MR, et al. End-tidal carbon dioxide in critically ill patients during changes in mechanical ventilation. Am Rev Respir Dis 1989; 140:1265–1268.
35. Shibutani K, Shirasaki S, Braatz T, et al. Changes in cardiac output affect PETCO2, CO2 transport, and O2 uptake during unsteady state in humans. J Clin Monit 1992; 8:175–176.
36. Gandhi SK, Munshi CA, Bardeen-Henschel A. Capnography for detection of endobronchial migration of an endotracheal tube. J Clin Monit 1991; 7:35–38.
37. Rodger MA, Gwynne J, Rasuli P. Steady-state end-tidal alveolar dead space fraction and D-dimer. Bedside tests to exclude pulmonary embolism. Chest 2001; 120:115–119.
38. Healey CJ, Fedullo AJ, Swinburne AJ, Wahl GW. Comparison of noninvasive measurements of carbon dioxide tension during weaning from mechanical ventilation. Crit Care Med 1987; 15:764–767.


Stay updated, free articles. Join our Telegram channel

Full access? Get Clinical Tree


