FIGURE 20.1 Ventilation–perfusion (V/Q) relationships and associated blood gas abnormalities.
Pathophysiology
Dead space ventilation increases in the following situations:
1. When the alveolar–capillary interface is destroyed; e.g., emphysema
2. When blood flow is reduced; i.e., low cardiac output
3. When alveoli are overdistended; e.g., during positive-pressure ventilation
ARTERIAL BLOOD GASES: An increase in VD/VT above 0.3 results in both hypoxemia (decreased arterial PO2) and hypercapnia (increased arterial PCO2), which is analogous to what would happen if you held your breath. The hypercapnia usually appears when the VD/VT is above 0.5 (5).
Intrapulmonary Shunt
A V/Q ratio below 1.0 (Fig. 20.1, lower panel) occurs when pulmonary capillary blood flow is excessive relative to ventilation. The excess blood flow, known as intrapulmonary shunt, does not participate in pulmonary gas exchange. There are two types of intrapulmonary shunt. True shunt indicates the total absence of gas exchange between capillary blood and alveolar gas (V/Q = 0), and is equivalent to an anatomic shunt between the right and left sides of the heart. Venous admixture represents the capillary flow that does not equilibrate completely with alveolar gas (0<V/Q <1). As the venous admixture increases, the V/Q ratio decreases until it becomes a true shunt (V/Q = 0).
The fraction of the cardiac output that represents intrapulmonary shunt is known as the shunt fraction. In normal subjects, intrapulmonary shunt flow (Qs) represents less than 10% of the total cardiac output (Qt), so the shunt fraction (Qs/Qt) is less than 10% (1,2,4).
Pathophysiology
Intrapulmonary shunt fraction is increased in the following situations:
1. When the small airways are occluded; e.g., asthma
2. When the alveoli are filled with fluid; e.g., pulmonary edema, pneumonia
3. When the alveoli collapse; e.g., atelectasis
4. When capillary flow is excessive; e.g., in nonembolized regions of the lung in pulmonary embolism
ARTERIAL BLOOD GASES: The influence of shunt fraction on arterial O2 and CO2 tensions (PaO2, PaCO2, respectively) is shown in Figure 20.2. The PaO2 falls progressively as shunt fraction increases, but the PaCO2 remains constant until the shunt fraction exceeds 50% (4). The PaCO2 is often below normal in patients with increased intrapulmonary shunt as a result of hyperventilation triggered by the disease process or by the accompanying hypoxemia.
Inhaled Oxygen
The shunt fraction also determines the influence of inhaled oxygen on the arterial PO2. This is shown in Figure 20.3 (4). As intrapulmonary shunt increases from 10 to 50%, an increase in fractional concentration of inspired oxygen (FIO2) produces less of an increment in the arterial PO2. When the shunt fraction exceeds 50%, the arterial PO2 is independent of changes in FIO2, and the condition behaves like a true (anatomic) shunt. This means that, in conditions associated with a high shunt fraction (e.g., acute respiratory distress syndrome), the FIO2 can often be lowered to non-toxic levels (FIO2 below 60%) without further compromising arterial oxygenation. This can be a valuable maneuver for preventing pulmonary oxygen toxicity.
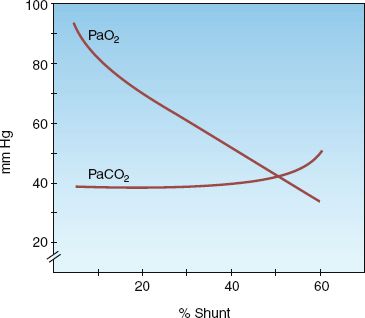
FIGURE 20.2 The influence of shunt fraction on arterial PO2 (PaO2) and arterial PCO2 (PaCO2). From Reference 4.
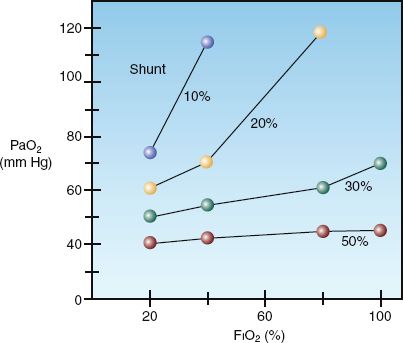
FIGURE 20.3 The influence of shunt fraction on the relationship between the inspired oxygen (FIO2) and the arterial PO2 (PaO2). From Reference 4.
MEASURES OF GAS EXCHANGE
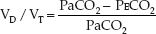
The calculation of dead space ventilation (VD/VT) is based on the difference between the PCO2 in exhaled gas and end-capillary (arterial) blood. In the normal lung, the capillary blood equilibrates fully with alveolar gas, and the exhaled PCO2 (PECO2) is equivalent to the arterial PCO2 (PaCO2). As dead space ventilation (VD/VT) increases, the PECO2 de-creases relative to the PaCO2. The Bohr equation shown below (derived by Christian Bohr, father of Neils Bohr, one of the founders of quantum mechanics) is based on this principle.
 (20.1)
Thus, when the PECO2 decreases relative to the PaCO2, the calculated VD/VT rises. The PECO2 is measured in a random sample of expired gas (mean ex-haled PCO2), and is not measured at the end of expiration (end-tidal PCO2).
Intrapulmonary Shunt Fraction
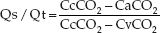
The intrapulmonary shunt fraction (Qs/Qt) is derived by the relationship between the O2 content in arterial blood (CaO2), mixed venous blood (CvO2), and pulmonary capillary blood (CcO2).
 (20.2)
The problem with this formula is the inability to measure the pulmonary capillary O2 content (CcO2) directly. As a result, pure oxygen breathing (to produce 100% oxyhemoglobin saturation in pulmonary capillary blood) is recommended for the shunt calculation. However in this situation, Qs/Qt measures only true shunt.
The A-a PO2 Gradient
The PO2 difference between alveolar gas and arterial blood (PAO2–PaO2) is an indirect measure of ventilation–perfusion abnormalities (5–7). The PAO2–PaO2 (A-a PO2) gradient is determined with the alveolar gas equation shown below.
 (20.3)
This equation defines the relationship between the PO2 in alveolar gas (PAO2), the PO2 in inhaled gas (PIO2), the PCO2 in arterial blood (PaCO2), and the respiratory quotient (RQ). The RQ defines the relative rates of exchange of O2 and CO2 across the alveolar–capillary interface: i.e., RQ = VCO2/VO2. The PIO2 is determined using the fractional concentration of inspired oxygen (FIO2), the barometric pressure (PB), and the partial pressure of water vapor (PH2O) in humidified gas:
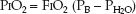 (20.4)
If equations 20.3 and 20.4 are combined (for the alveolar PO2), the A–a PO2 gradient can be calculated as follows:
 (20.5)
In a healthy subject breathing room air at sea level, FIO2=0.21, PB=760 mm Hg, PH2O=47 mm Hg, PaO2=90 mm Hg, PaCO2=40 mm Hg, and RQ=0.8:
 (20.6)
This represents an idealized rather than normal A-a PO2 gradient, because the A-a PO2 gradient varies with age and with the concentration of inspired oxygen.
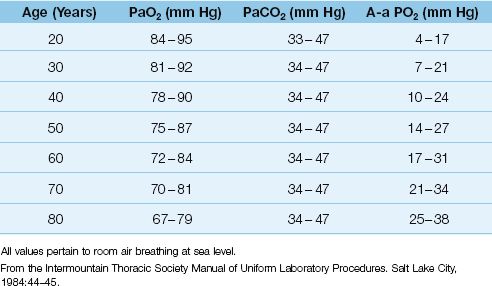
Influence of Age
As shown in Table 20.1, the normal A-a PO2 gradient rises steadily with advancing age (6). Assuming that most adult patients in an ICU are 40 years of age or older, the normal A-a PO2 gradient in an adult ICU patient can be as high as 25 mm Hg when the patient is breathing room air. However, few ICU patients breathe room air, and the A-a PO2 gradient is increased further when oxygen is added to inhaled gas (see next).
Table 20.1 Normal Arterial Blood Gases
Influence of Inspired Oxygen
The influence of inspired oxygen on the A-a PO2 gradient is shown in Figure 20.4 (7). The A-a PO2 gradient increases from 15 to 60 mm Hg as the FIO2 increases from 21% (room air) to 100%. According to this relationship, the normal A-a PO2 gradient increases 5 to 7 mm Hg for every 10% increase in FIO2. This effect is presumably caused by the loss of regional hypoxic vasoconstriction in the lungs. Hypoxic vasoconstriction in poorly ventilated lung regions diverts blood to more adequately ventilated regions, and this helps to preserve the normal V/Q balance. Loss of regional hypoxic vasoconstriction during supplemental O2 breathing maintains blood flow in poorly ventilated lung regions, and this increases intrapulmonary shunt fraction and increases the A-a PO2 gradient.
The FIO2 is difficult to estimate accurately when supplemental O2 is delivered via nasal prongs or “open” face masks (see Chapter 22), and this limits the accuracy of the A-a PO2 gradient in these situations.
Positive-Pressure Ventilation
Positive-pressure mechanical ventilation elevates the pressure in the airways above the ambient barometric pressure. Therefore, when determining the A-a PO2 gradient in a ventilator-dependent patient, the mean airway pressure should be added to the barometric pressure (8). In the example presented in equation 20.6, a mean airway pressure of 30 cm H2O would increase the A-a PO2 gradient from 10 to 16 mm Hg (a 60% increase). Thus, neglecting the contribution of positive airway pressure during mechanical ventilation will underestimate the degree of abnormal gas exchange.
The a/A PO2 Ratio
Unlike the A-a PO2 gradient, the a/A PO2 ratio is relatively unaffected by the FIO2. This is demonstrated in Figure 20.4. The independence of the a/A PO2 ratio in relation to the FIO2 is explained by the equation below.
 (20.7)
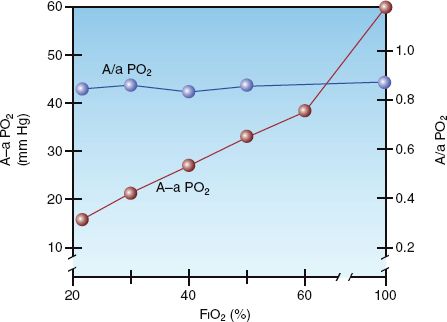
FIGURE 20.4 The influence of FIO2 on the alveolar-arterial PO2 gradient (A-a PO2) and the arterial-alveolar PO2 ratio (a/A PO2) in normal subjects. From Reference 7.
Because the alveolar PO2 is in both the numerator and denominator of the equation, the influence of FIO2 on the PAO2 is eliminated. Thus, the a/A PO2 ratio is a mathematical manipulation that eliminates the influence of FIO2 on the A-a PO2 gradient. The normal a/A PO2 ratio is 0.74 to 0.77 when breathing room air, and 0.80 to 0.82 when breathing 100% oxygen (7).
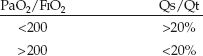
The PaO2/FIO2 Ratio
The PaO2/FIO2 ratio is used as an indirect estimate of shunt fraction. The following correlations have been reported (9).
The major limitation of the PaO2/FIO2 ratio is the inability to estimate the FIO2 accurately when supplemental O2 is delivered through nasal prongs or “open” face masks (see Chapter 22). (This limitation has also been described for the A-a PO2 gradient.)
Blood Gas Variability
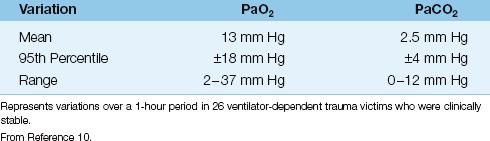
The arterial PO2 and PCO2 can vary spontaneously without a change in the clinical condition of the patient. This is demonstrated in Table 20.2, which shows the spontaneous variation in arterial PO2 and PCO2 over a one-hour period in a group of clinically stable trauma victims (10). Note that the arterial PO2 varied by as much as 36 mm Hg, while the arterial PCO2 varied by as much as 12 mm Hg. This variability has also been observed in patients in a medical ICU (11). Because of this degree of spontaneous variation, routine monitoring of arterial blood gases can be misleading.
Table 20.2 Spontaneous Blood-Gas Variability
HYPOXEMIA
Hypoxemia can be defined as an arterial PO2 below what is expected for a patient’s age, as defined in Table 20.1. However, hypoxemia usually doesn’t raise red flags until the arterial PO2 falls below 60 mm Hg (or the arterial O2 saturation falls below 90%). The causes of hypoxemia can be separated into 3 categories based on the physiological process involved (12,13). Each group of disorders can be distinguished by the A-a PO2 gradient and/or the mixed venous PO2, as shown in Table 20.3.
Table 20.3 Sources of Hypoxemia
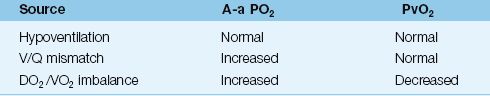
Hypoventilation
Alveolar hypoventilation causes both hypoxemia and hypercapnia, similar to breath-holding. There is no V/Q imbalance in the lungs, so the A-a PO2 gradient is not elevated. The common causes of alveolar hypoventilation are listed in Table 20.4. Most cases of hypoventilation in the ICU are the result of drug-induced respiratory depression or neuromuscular weakness. Obesity-related hypoventilation (Pickwickian syndrome) is also a consideration, as this condition is present in up to one-third of morbidly obese patients (body mass index >35 kg/m2) (14).
Table 20.4 Alveolar Hypoventilation in the ICU
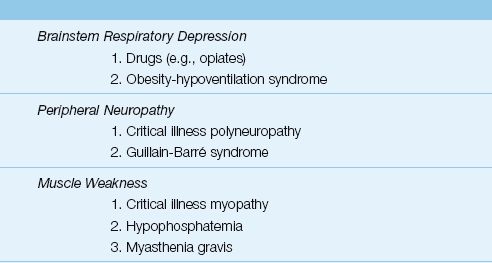
Respiratory Muscle Weakness
Most cases of respiratory muscle weakness in the ICU are the result of an idiopathic polyneuropathy and myopathy that is specific to ICU patients, particularly those with sepsis, prolonged mechanical ventilation, and prolonged neuromuscular paralysis (15). The standard method of evaluating respiratory muscle strength is to measure the maximum inspiratory pressure (PImax), which is the maximum pressure recorded during a maximum inspiratory effort against a closed valve. The normal PImax varies with age and gender, but most healthy adults can generate a negative PImax of at least 80 cm H2O (16). A PImax that does not exceed -25 cm H2O is considered evidence of respiratory muscle failure (17). (See Chapter 45 for more information on neuromuscular weakness syndromes in the ICU.)
V/Q Mismatch
Most cases of hypoxemia are the result of a V/Q mismatch in the lungs. Virtually any lung disease can be included in this category, but the common ones encountered in the ICU are pneumonia, inflammatory lung injury (acute respiratory distress syndrome), obstructive lung disease, hydrostatic pulmonary edema, and pulmonary embolism. The A-a PO2 gradient is almost always elevated in these conditions, but the elevation can be minimal in patients with severe airways obstruction (which behaves like hypoventilation).
DO2/VO2 Imbalance
As explained in Chapter 10, a decrease in systemic O2 delivery (DO2) is usually accompanied by an increase in O2 extraction from capillary blood, and this serves to maintain a constant rate of O2 uptake (VO2) into the tissues. The increased O2 extraction from capillary blood results in a decrease in the PO2 of venous blood, and this can have an deleterious effect on arterial oxygenation, as explained below.
Mixed Venous PO2
The O2 in arterial blood represents the sum of the O2 in mixed venous (pulmonary artery) blood and the O2 added from alveolar gas. When gas exchange is normal, the PO2 in alveolar gas is the major determinant of the arterial PO2. However, when gas exchange is impaired, the contribution of the alveolar PO2 declines and the contribution of the mixed venous PO2 rises (18). The greater the impairment in gas exchange, the greater the contribution of the mixed venous PO2 to the arterial PO2. (If there is no gas exchange in the lungs, the mixed venous PO2 would be the sole determinant of the arterial PO2.)
The diagram in Figure 20.5 demonstrates the influence of mixed venous PO2 on the arterial PO2 when gas exchange is impaired. The curves in the graph represent the transition from mixed venous PO2 to arterial PO2 as blood flows through the lungs. The slope of each curve reflects the efficiency of gas exchange in the lungs. Note that the curve representing the V/Q abnormality results in a lower arterial PO2 because the slope is decreased (indicating impaired oxygen exchange in the lungs). If this curve begins at a lower mixed venous PO2, as indicated, the curve shifts downward, resulting in a further decrease in arterial PO2. This illustrates how a decrease in mixed venous PO2 can aggravate the hypoxemia caused by a V/Q abnormality. It also indicates that, in the presence of a V/Q abnormality, the mixed venous PO2 is an important consideration in the evaluation of hypoxemia.
The relationship between O2 delivery (DO2), O2 uptake (VO2), and the mixed venous PO2 (PvO2) can be stated as follows:
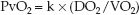 (20.8)
(k is a proportionality constant.) Thus, any condition that reduces DO2 (e.g., low cardiac output, anemia) or increases VO2 (e.g., hypermetabolism) can decrease the PvO2 and aggravate the hypoxemia caused by abnormal gas exchange in the lungs.

FIGURE 20.5 The influence of a V/Q abnormality on the transition from venous to arterial PO2, and the added effect of a low mixed venous PO2 (PvO2).
Diagnostic Evaluation
The evaluation of hypoxemia can proceed according to the flow diagram in Figure 20.6. This approach uses three measures: A-a PO2 gradient, mixed venous PO2, and maximum inspiratory pressure. The PO2 in superior vena cava blood (central venous PO2) can be used as the mixed venous PO2 when there is no indwelling pulmonary artery catheter.
The first step in the approach involves a determination of the A-a PO2 gradient. After correcting for age and FIO2, the A-a PO2 gradient can be interpreted as follows:
1. Normal A-a PO2 gradient indicates hypoventilation rather than a cardiopulmonary disorder. In this situation, the most likely problems are drug-induced respiratory depression and neuromuscular weakness. The latter condition can be uncovered by measuring the maximum inspiratory pressure (PImax), which is described earlier.
2. Increased A-a PO2 gradient indicates a V/Q abnormality (cardiopulmonary disorder) and a possible superimposed DO2/VO2 imbalance (e.g., a decrease in cardiac output). The mixed venous (or central venous) PO2 will help to identify a DO2/VO2 imbalance.
a. If the venous PO2 is 40 mm Hg or higher, the problem is solely a V/Q mismatch in the lungs.
b. If the venous PO2 is below 40 mm Hg, there is a DO2/VO2 imbalance adding to the hypoxemia created by a V/Q mismatch in the lungs. The source of this imbalance is either a decreased DO2 (from anemia or a low cardiac output) or an increased VO2 (from hypermetabolism).
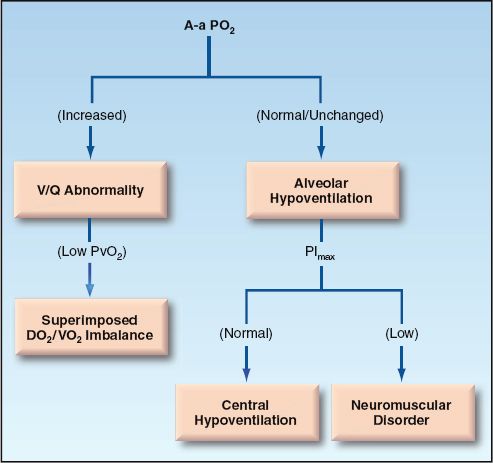
FIGURE 20.6 Flow diagram for the evaluation of hypoxemia.
Spurious Hypoxemia
Spurious hypoxemia is a rarely reported phenomenon that is characterized by hypoxemia in an arterial blood sample without corresponding hypoxemia in circulating blood (as measured by pulse oximetry) (19). This phenomenon seems to occur only in patients with hematologic malignancies who have marked leukocytosis (WBC >100,000) or thrombocytosis (platelet count >1,000,000). The reduced PO2 in the blood sample has been attributed to O2 consumption by activated leukocytes in the sample, a phenomenon that has been called leukocyte larceny (20). This does not explain why marked thrombocytosis can also produce spurious hypoxemia because platelets are not oxygen-guzzlers like activated leukocytes. Regardless of the mechanism, there is no accepted method of preventing spurious hypoxemia (rapid cooling of blood samples has had inconsistent results), so you should be aware of the phenomenon and the value of pulse oximetry for validating in vitro PO2 measurements (pulse oximetry is described in the next chapter).
HYPERCAPNIA
Hypercapnia is defined as an arterial PCO2 (PaCO2) above 46 mm Hg that does not represent compensation for a metabolic alkalosis (21). The causes of hypercapnia can be identified by considering the determinants of PaCO2 in the following relationship, where VCO2 is the rate of CO2 production in the body, VA is the rate of alveolar ventilation, and k is a proportionality constant (1).
 (20.9)
Alveolar ventilation is the portion of the total ventilation (VE) that is not dead space ventilation (VD/VT); that is, VA = VE (1 – VD/VT). Therefore, equation 20.9 can be restated as follows:
 (20.10)
This equation identifies three major sources of hypercapnia: (a) increased CO2 production (VCO2), (b) hypoventilation (1/VE), and (c) increased dead space ventilation (VD/VT).
Hypoventilation
Hypoventilation was discussed briefly in the last section on hypoxemia, and Table 20.4 shows the common causes of hypoventilation. Because hypoxemia is so common in ICU patients, hypercapnia may be the first sign of hypoventilation from neuromuscular weakness or drug-induced respiratory depression. This is also the case in obesity-hypoventilation syndrome, where hypercapnia while awake is often the first evidence of hypoventilation. On the other hand, hypercapnia is a relatively late sign in neuromuscular disorders, and does not appear until the maximum inspiratory pressure or PImax (described earlier) is below 50% of normal (17).
V/Q Abnormality
As mentioned earlier, hypercapnia is not a feature of increased intrapulmonary shunt until late in the process (which is why hypercapnia is not a feature of pulmonary edema or other infiltrative lung processes until they are far advanced). Hypercapnia is more a feature of increased dead space ventilation (such as occurs in advanced emphysema, where there is destruction of the alveolar-capillary interface), and the PaCO2 usually begins to rise when dead space ventilation accounts for more than 50% of total ventilation (VD/VT >0.5).
Increased CO2 Production
An increase in CO2 production is usually related to oxidative metabolism, but non-metabolic CO2 production is possible when extracellular acids generate hydrogen ions that combine with bicarbonate ions and generate CO2. Whatever the source, increased CO2 production is normally accompanied by an increase in minute ventilation, which eliminates the excess CO2 and maintains a constant arterial PCO2. Therefore, excess CO2 production does not normally cause hypercapnia. However, when CO2 excretion is impaired, an increase in CO2 production can lead to an increase in PaCO2. Thus, increased CO2 production is an important factor in promoting hypercapnia only when the ability to eliminate CO2 is impaired.
Overfeeding
Overfeeding, or the provision of calories in excess of daily needs, is a recognized cause of hypercapnia in patients with severe lung disease and acute respiratory failure (22). Nutrition-associated hypercapnia occurs predominantly in ventilator-dependent patients, and can delay weaning from mechanical ventilation. Overfeeding with carbohydrates is particularly problematic because the oxidative metabolism of carbohydrates generates more carbon dioxide than the other nutrient substrates (lipids and proteins). This is described in more detail in Chapter 47.
Diagnostic Evaluation
The bedside evaluation of hypercapnia is shown in Figure 20.7. The evaluation of hypercapnia, like hypoxemia, begins with the A-a PO2 gradient (23). A normal or unchanged A-a PO2 gradient indicates that the problem is alveolar hypoventilation (the same as described for the evaluation of hypoxemia). An increased A-a PO2 gradient indicates a V/Q abnormality (an increase in dead space ventilation) that may or may not be accompanied by an increase in CO2 production.
Measuring CO2 Production
The rate of CO2 production (VCO2) can be measured at the bedside with specialized metabolic carts that are normally used to perform nutritional assessments. These carts are equipped with infrared devices that can measure the CO2 in expired gas (much like the end-tidal CO2 monitors described in Chapter 21), and can determine the volume of CO2 excreted per minute. In steady-state conditions, the rate of CO2 excretion is equivalent to the VCO2. The normal VCO2 is 90 to 130 L/minute/m2, which is roughly 80% of the VO2. As mentioned earlier, an increased VCO2 is evidence for one of the following conditions: generalized hypermetabolism, overfeeding (excess calories), or metabolic acidoses.
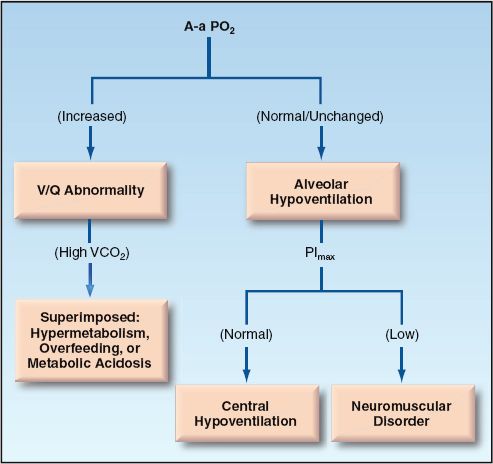
FIGURE 20.7 Flow diagram for the evaluation of hypercapnia.
A FINAL WORD
It is important to remember that the arterial PO2 is not a useful measure for determining the amount of oxygen in the blood (this requires the hemoglobin concentration in blood and the percent saturation of hemoglobin with oxygen, as shown in Equation 10.6 in Chapter 10). Instead, the PaO2 (along with the PaCO2) is used to evaluate gas exchange in the lungs, and can be useful in identifying the source of the problem with gas exchange.
An approach to O2 and CO2 balance that is superior in many ways to the measurement of arterial blood gases is described in the next chapter.
REFERENCES
Bell SM. Lavoisier in the Year One. New York: W.H. Norton & Co., 2005.
Pulmonary Gas Exchange
1. Dantzger DR. Pulmonary gas exchange. In: Dantzger DR, ed. Cardiopul-monary critical care. 2nd ed. Philadelphia: WB Saunders, 1991; 25–43.
2. Lanken PN. Ventilation-perfusion relationships. In: Grippi MA, ed. Pul-monary Pathophysiology. Philadelphia: JB Lippincott, 1995; 195–210.
3. Buohuys A. Respiratory dead space. In: Fenn WO, Rahn H, eds. Handbook of physiology: respiration. Bethesda: American Physiological Society, 1964; 699–714.
4. D’Alonzo GE, Dantzger DR. Mechanisms of abnormal gas exchange. Med Clin North Am 1983; 67:557–571.
Measures of Gas Exchange
5. Gammon RB, Jefferson LS. Interpretation of arterial oxygen tension. UpToDate Web Site, 2006. (Accessed 3/11/2006)
6. Harris EA, Kenyon AM, Nisbet HD, et al. The normal alveolar-arterial oxygen tension gradient in man. Clin Sci 1974; 46:89–104.
7. Gilbert R, Kreighley JF. The arterial/alveolar oxygen tension ratio. An index of gas exchange applicable to varying inspired oxygen concentrations. Am Rev Resp Dis 1974; 109:142–145.
8. Carroll GC. Misapplication of the alveolar gas equation. N Engl J Med 1985; 312:586.
9. Covelli HD, Nessan VJ, Tuttle WK. Oxygen derived variables in acute respiratory failure. Crit Care Med 1983; 11:646–649.
10. Hess D, Agarwal NN. Variability of blood gases, pulse oximeter saturation, and end-tidal carbon dioxide pressure in stable, mechanically ventilated trauma patients. J Clin Monit 1992; 8:111–115.
11. Sasse SA, Chen P, Mahutte CK. Variability of arterial blood gas values over time in stable medical ICU patients. Chest 1994; 106:187–193.
Hypoxemia
12. Duarte A, Bidani A. Evaluating hypoxemia in the critically ill. J Crit Illness 2005; 20:91–93.
13. White AC. The evaluation and management of hypoxemia in the chronic critically ill patient. Clin Chest Med 2001; 22:123–134.
14. Nowbar S, Burkhart KM, Gonzalez R, et al. Obesity-associated hypoventilation in hospitalized patients: prevalence, effects, and outcome. Am J Med 2004; 116:1–7.
15. Rich MM, Raps EC, Bird SJ. Distinction between acute myopathy syndrome and critical illness polyneuropathy. Mayo Clin Proc 1995; 70:198–199.
16. Bruschi C, Cerveri I, Zoia MC, et al. Reference values for maximum respiratory mouth pressures: A population-based study. Am Rev Respir Dis 1992; 146:790–793.
17. Baydur A. Respiratory muscle strength and control of ventilation in patients with neuromuscular disease. Chest 1991; 99:330–338.
18. Rossaint R, Hahn S-M, Pappert D, et al. Influence of mixed venous PO2 and inspired oxygen fraction on intrapulmonary shunt in patients with severe ARDS. J Appl Physiol. 1995; 78:1531–1536.
19. Lele A, Mirski MA, Stevens RD. Spurious hypoxemia. Crit Care Med 2005; 33:1854–1856.
20. Fox MJ, Brody JS, Weintraub LR. Leukocyte larceny: A cause of spurious hypoxemia. Am J Med 1979; 67:742–746.
Hypercapnia
21. Weinberger SE, Schwartzstein RM, Weiss JW. Hypercapnia. N Engl J Med 1989; 321:1223–1230.
22. Talpers SS, Romberger DJ, Bunce SB, Pingleton SK. Nutritionally associated increased carbon dioxide production. Chest 1992; 102:551–555.
23. Gray BA, Blalock JM. Interpretation of the alveolar-arterial oxygen difference in patients with hypercapnia. Am Rev Respir Dis 1991; 143:4–8.


Stay updated, free articles. Join our Telegram channel

Full access? Get Clinical Tree


