In a person with normal lungs, breathing can be performed exclusively by the diaphragm.
 In the adult, the tip of an orotracheal tube moves an average of 3.8 cm with flexion and extension of the neck, but can travel up to 6.4 cm. In infants and children, displacement of even 1 cm can move the tube above the vocal cords or below the carina.
 The following anatomy should be considered when contemplating the use of a double-lumen tube. The adult right mainstem bronchus is ∼ 2.5 cm long before it branches into lobar bronchi. In 10% of adults, the right upper lobe bronchus departs from the right mainstem bronchus less than 2.5 cm below the carina. In 2% to 3% of adults, the right upper lobe bronchus opens directly into the trachea, above the carina.
 When lung compliance is reduced, larger changes in pleural pressure are needed to create the same tidal volume (VT). Patients with low lung compliance breathe with smaller VT and more rapidly, making spontaneous respiratory rate the most sensitive clinical index of lung compliance.
 Carotid and aortic bodies are stimulated by PaO2 values less than 60 to 65 mm Hg. Thus, patients who depend on hypoxic ventilatory drive do not have PaO2 values >65 mm Hg. The response of the peripheral receptors will not reliably increase ventilatory rate or minute ventilation to herald the onset of hypoxemia during general anesthesia or recovery.
 There are three etiologies of hyperventilation: Arterial hypoxemia, metabolic acidemia, and central etiologies (e.g., intracranial hypertension, hepatic cirrhosis, anxiety, pharmacologic agents).
 Increases in dead space ventilation primarily affect CO2 elimination (with minimal influence on arterial oxygenation), and physiologic shunt increase primarily affects arterial oxygenation (with minimal influence on CO2 elimination).
 During spontaneous ventilation, the ratio of alveolar ventilation to dead space ventilation is 2:1. The alveolar-to-dead space ventilation ratio during positive-pressure ventilation is 1:1. Thus, minute ventilation during mechanical ventilatory support must be greater than that during spontaneous ventilation to achieve the same PaCO2.
 PaCO2 ≥ PETCO2 unless the patient inspires or receives exogenous CO2. The difference between PaCO2 and PETCO2 is due to dead space ventilation. The most common reason for an acute increase in dead space ventilation is decreased cardiac output.
 Calculation of the shunt fraction is the best tool for evaluating the lungs’ efficiency in oxygenating the arterial blood. It is the only index of oxygenation that takes into account the contribution of mixed venous blood to arterial oxygenation.
 When functional residual capacity (FRC) is reduced, lung compliance falls and results in tachypnea, and venous admixture increases, creating arterial hypoxemia.
 There is no compelling evidence that defines rules or parameters for ordering preoperative pulmonary function tests. Rather, they should be obtained to ascertain the presence of reversible pulmonary dysfunction (bronchospasm) or to define the severity of advanced pulmonary disease.
 Patients who smoke should be advised to stop smoking at least 2 months prior to an elective operation to decrease the risk of postoperative pulmonary complications (PPCs).
 The operative site is one of the most important determinants of the risk of PPC. The highest risk for PPC is associated with nonlaparoscopic upper abdominal operations, followed by lower abdominal and intrathoracic operations.
 The single most important aspect of postoperative pulmonary care and prevention of PPC is early ambulation. Patients should be encouraged to get out of bed and walk.
Multimedia
 Law of Laplace
 Lung Volumes
 Lung Blood Flow Distribution
 Continuum of Ventilation and Perfusion
 Flow Volume
Anesthesiologists directly manipulate pulmonary function. Thus, a sound and thorough working knowledge of applied pulmonary physiology is essential to the safe conduct of anesthesia. This chapter discusses pulmonary anatomy, the control of ventilation, oxygen and carbon dioxide transport, ventilation–perfusion relationships, lung volumes and pulmonary function testing, abnormal physiology and anesthesia, the effect of smoking on pulmonary function, and assessing risk for postoperative pulmonary complications (PPCs).
FUNCTIONAL ANATOMY OF THE LUNGS
This section emphasizes functional lung anatomy, with structure described as it applies to the mechanical and physiologic function of the lungs.
Thorax
The thoracic cage is shaped like a truncated cone, with a small superior aperture and a larger inferior opening to which the diaphragm is attached. The sternal angle is located in the horizontal plane that passes through the vertebral column at the T4 or T5 level. This plane separates the superior from the inferior mediastinum. During ventilation, the predominant changes in thoracic diameter occur in the anteroposterior direction in the upper thoracic region and in the lateral or transverse direction in the lower thorax.
Muscles of Ventilation
Work of breathing is the energy expenditure of ventilatory muscles. Similar to other skeletal muscles, the ventilatory muscles are endurance muscles subject to fatigue from inadequate oxygen delivery, poor nutrition, increased work secondary to chronic obstructive pulmonary disease (COPD) with gas trapping, or increased airway resistance. The ventilatory muscles include the diaphragm, intercostal muscles, abdominal muscles, cervical strap muscles, sternocleidomastoid muscles, and the large back and intervertebral muscles of the shoulder girdle. During non-strenuous breathing, the diaphragm performs most of the muscle work. Work contribution from the intercostal muscles in non-strenuous breathing is minor. Normally, at rest, inspiration requires work while exhalation is passive. As work of breathing increases, abdominal muscles assist with rib depression and increase intra-abdominal pressure to facilitate forced exhalation causing the “stitch,” or rib pain that athletes experience when they actively exhale. With a further increase in work is required, the cervical strap muscles are recruited to help elevate the sternum and upper portions of the chest to optimize the dimensions of the thoracic cavity. Finally, during periods of maximal work, recruitment of large back and paravertebral muscles of the shoulder girdle contribute to ventilatory effort. The muscles of the abdominal wall, the most powerful muscles of expiration, are important for expulsive efforts such as coughing.1 However, with normal lungs, breathing can be performed solely by the diaphragm.
Breathing is an endurance phenomenon involving fatigue-resistant muscle fibers, characterized by a slow-twitch response to electrical stimulation that must create sufficient force to lift the ribs and generate subatmospheric pressure in the intrapleural space. These fatigue-resistant fibers comprise approximately 50% of the total diaphragmatic muscle fibers. The high oxidative capacity of these fibers creates endurance units.2 Fast-twitch muscle fibers, more susceptible to fatigue, have rapid responses to electrical stimulation imparting strength and allowing greater force over less time. The combination of fast-twitch fibers useful during brief periods of maximal ventilatory effort (coughing, sneezing) and slow-twitch fibers providing endurance (breathing without rest) underscore the unique dual function of the diaphragm as a muscle.3
A working muscle like the diaphragm must be firmly anchored at both its origin and insertion. However, its unique insertion is mobile—a central tendon originates from fibers attached to the vertebral bodies as well as the lower ribs and sternum. Diaphragmatic contraction results in descent of the diaphragmatic dome and expansion of the thoracic base creating decreases in intrathoracic and intrapleural pressure and an increase in intra-abdominal pressure.
The cervical strap muscles, active even during breathing at rest, are the most important inspiratory accessory muscles. When diaphragm function is impaired, as in patients with cervical spinal cord transection they can become the primary inspiratory muscles.
Lung Structures
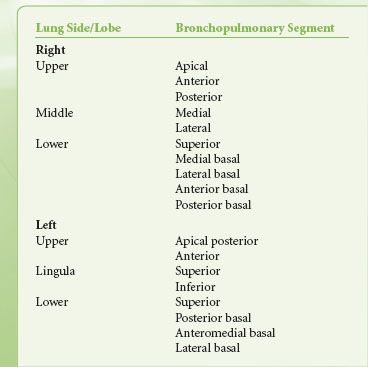
In an intact respiratory system, the expandable lung tissue fills the pleural cavity. The visceral and parietal pleurae oppose each other, creating a potential intrapleural space where pressure decreases when the diaphragm descends and the rib cage expands. At the end of inspiration, the resultant subatmospheric intrapleural pressure is a reflection of the opposing and equal forces between the natural tendency of the lungs to collapse and the chest wall musculature to remain expanded. These equal and opposing forces at end inspiration result in the functional residual capacity (FRC), the volume of gas remaining in the lungs at passive end expiration. At FRC, the intrapleural space normally has a slightly sub-ambient pressure (–2 to –3 mm Hg). Major divisions of the right and left lung are listed in Table 11-1. Knowledge of the bronchopulmonary segments is important for localizing lung pathology, interpreting lung radiographs, identifying lung regions during bronchoscopy, and operating on the lung. Each bronchopulmonary segment is separated from its adjacent segments by well-defined connective tissue planes, which often anatomically confine initial primary lung pathologies.
TABLE 11-1. MAJOR DIVISIONS OF THE LUNG
The lung parenchyma can be subdivided into three airway categories based on functional lung anatomy (Table 11-2). The conductive airways allow or conduct basic gas transport without gas exchange. The next group of airways, which have smaller diameters, are transitional airways. Transitional airways are not only conduits for gas movement, but also allow limited gas diffusion and exchange. Finally, the smallest respiratory airways’ primary function is gas exchange.
TABLE 11-2. FUNCTIONAL AIRWAY DIVISIONS
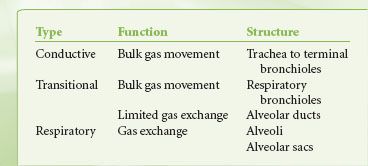
Conventionally, large airways with diameters of >2 mm create 90% of total airway resistance. The number of alveoli increases progressively with age, from approximately 24 million at birth and reaches its final adult count of 300 million by the age of 8 or 9 years. These alveoli are associated with about 250 million precapillaries and 280 billion capillary segments, resulting in a surface area of ∼70 m2 for gas exchange.
Conductive Airways
In the adult, the trachea is a fibromuscular tube ∼10 to 12 cm long with an outer diameter of ∼20 mm. Structural support is provided by 20 U-shaped structures composed of hyaline cartilage, with the opening of the U facing posteriorly. The cricoid membrane tethers the trachea to the cricoid cartilage at the level of the sixth cervical vertebral body. The trachea enters the superior mediastinum and bifurcates at the sternal angle (the lower border of the fourth thoracic vertebral body). Normally, half of the trachea is intrathoracic and half is extrathoracic. Since both ends of the trachea are attached to mobile structures, the adult carina can move superiorly as much as 5 cm from its normal resting position. Awareness of airway “motion” is essential to proper care of the intubated patient. In the adult, the tip of an orotracheal tube moves an average of 3.8 cm with flexion and extension of the neck but can travel as far as 6.4 cm.4 In infants and children, tracheal tube movement with respect to the trachea is even more critical: Displacement of even 1 cm can result in unintentional extubation or bronchial intubation.
The next airway generation below the carina is composed of the right and left mainstem bronchi. The diameter of the right bronchus is generally greater than that of the left. In the adult, the right bronchus leaves the trachea at ∼25 degrees from the vertical tracheal axis, whereas the angle of the left bronchus is ∼45 degrees. Thus, unintentional endobronchial intubation or aspiration of foreign material is more likely to occur on the right than the left. Furthermore, the right upper lobe bronchus dives almost directly posterior at ∼90 degrees from the right main bronchus, facilitating aspiration of foreign bodies and fluid into the right upper lobe in the supine patient. In children younger than 3 years of age, the angles created by the right and left mainstem bronchi are approximately equal, with takeoff angles of about 55 degrees.
The adult right main bronchus is ∼2.5 cm long before it initially branches into lobar bronchi. However, in 10% of adults, the right upper lobe bronchus departs from the right mainstem bronchus less than 2.5 cm from the carina. Furthermore, in ∼2% to 3% of adults, the right upper lobe bronchus opens into the trachea, superior to the carina. Patients with these anomalies require special consideration when placing double-lumen tracheal tubes, especially if one contemplates inserting a right-sided endobronchial tube. After the right upper and middle lobe bronchi divide from the right main bronchus, the main channel becomes the right lower lobe bronchus.
The left main bronchus is ∼5 cm long before its initial branching point to the left upper lobe and the lingula; it then continues as the left lower lobe bronchus.
The bronchioles, typically 1 mm in diameter, are devoid of cartilaginous support and have the highest proportion of smooth muscle in their walls. Of the three to four bronchiolar generations, the final generation is the terminal bronchiole, which is the last airway component incapable of gas exchange.
Transitional Airways
The respiratory bronchiole, which follows the terminal bronchiole, is the first site in the tracheobronchial tree where gas exchange occurs. In adults, two or three generations of respiratory bronchioles lead to alveolar ducts, of which there are four to five generations, each with multiple openings into alveolar sacs. The final divisions of alveolar ducts terminate in alveolar sacs that open into alveolar clusters.
Respiratory Airways and the Alveolar–Capillary Membrane
The alveolar–capillary membrane has two primary functions: Transport of respiratory gases (oxygen and carbon dioxide), and the production of a wide variety of local and humoral substances. Gas transport is facilitated by the pulmonary capillary beds, which logically are the densest capillary networks in the body. This extensive vascular branching system starts with pulmonary arterioles in the region of the respiratory bronchioles. Each alveolus is closely associated with ∼1,000 short capillary segments.
The alveolar–capillary interface is complicated but well designed to facilitate gas exchange. Viewed with electron microscopy, the alveolar wall consists of a thin capillary epithelial cell, a basement membrane, a pulmonary capillary endothelial cell, and a surfactant lining layer. The flattened, squamous type I alveolar cells cover ∼80% of the alveolar surface. Type I cells contain flattened nuclei and extremely thin cytoplasmic extensions that provide the surface suitable for gas exchange. Type I cells are highly differentiated and metabolically limited, which makes them highly susceptible to injury. When type I cells are damaged severely (during acute lung injury or adult respiratory distress syndrome), type II cells replicate and modify to form new type I cells.5
Type II alveolar cells are interspersed among type I cells, primarily at alveolar–septal junctions. These polygonal cells have vast metabolic and enzymatic activity, and manufacture surfactant. The enzymatic activity required to produce surfactant is only 50% of the total enzymatic activity present in type II alveolar cells.6 The remaining enzymatic activity modulates local electrolyte balance, as well as endothelial and lymphatic cell functions. Both type I and type II alveolar cells have tight intracellular junctions, providing a relatively impermeable barrier to fluids.
Type III alveolar cells, alveolar macrophages, are an important element of immunologic lung defense. Their migratory and phagocytic activities permit ingestion of foreign materials within alveolar spaces.7 Although functional pulmonary macrophages reduce the incidence of lung infection,8 they also play an integral role in the organ-wide pulmonary inflammatory response. Thus, it is highly controversial whether the presence of these cells is beneficial (reducing the sequelae of infection) or harmful (contributing to the inflammatory response).9
Pulmonary Vascular Systems
Two major circulatory systems supply blood to the lungs: The pulmonary and bronchial vascular networks. The pulmonary vascular system delivers mixed venous blood from the right ventricle to the pulmonary capillary bed via two pulmonary arteries. After gas exchange occurs in the pulmonary capillary bed, blood is returned to the left atrium via four pulmonary veins. The pulmonary veins run independently along the intralobar connective tissue planes. The pulmonary capillary system adequately provides the metabolic and oxygen needs of the alveolar parenchyma. The bronchial arterial system provides oxygen to the conductive airways and pulmonary vessels. Anatomic connections between the bronchial and pulmonary venous circulations create an absolute shunt of ∼2% to 5% of the total cardiac output, and represents “normal” shunt.
LUNG MECHANICS
Lung movement occurs secondary to forces external to the lungs. During spontaneous ventilation, the external forces are produced by ventilatory muscles. The response of the lungs to these external forces is governed by two main characteristics: (1) ease of elastic recoil of the chest wall and (2) resistance to gas flow within airways.
Elastic Work
The natural tendency of the lungs is to collapse because of elastic recoil; thus, expiration at rest is normally passive as gas flows out of the lungs. The thoracic cage exerts an outward-directed force, and the lungs exert an inward-directed force and because the outward force of the thoracic cage exceeds the inward force of the lung, the overall tendency of the lung within the thoracic cage is to remain inflated. FRC represents the gas volume in the lungs when the outward and inward forces on the lung are equal. Gravitational forces create a more subatmospheric pressure in nondependent areas of the lung than in dependent areas. In the upright adult, the difference in intrapleural pressure from the top to the bottom of the lung is ∼7 cm H2O.
Surface tension at an air–fluid interface produces forces that tend to further reduce the area of interface. For a bubble to remain inflated, the gas pressure within a bubble which is contained by surface tension must be higher than the surrounding gas pressure. Alveoli resemble bubbles in this respect, but unlike a bubble, alveolar gas communicates with the atmosphere via the airways. The Laplace equation describes this phenomenon: P = 2T/R, where P is the pressure within the bubble (dyne ⋅ cm−2), T is the surface tension of the liquid (dyne ⋅ cm−1), and R is the radius of the bubble (cm).
During inspiration, the surface tension of the liquid in the lung increases to 40 mN/m, a value close to that of plasma. During expiration, this surface tension falls to 19 mN/m, a value lower than that of most other fluids. This change in surface tension creates hysteresis of the alveoli, the phenomenon of different pressure–volume relationships of the alveoli during inspiration versus expiration. Unlike a bubble, the pressure within an alveolus decreases as the radius of curvature decreases, creating gas flow from larger to smaller alveoli which maintains structural stability and prevents lung collapse.
The alveolar transmural pressure gradient, or transpulmonary pressure, is the difference between intrapleural and alveolar pressure and is directly proportional to lung volume. Intrapleural pressure can be safely measured with a percutaneously inserted catheter10; however, clinicians rarely perform this technique. When measured with an esophageal balloon in the midesophagus, esophageal pressure can be used as a reflection of intrapleural pressure.11 Commercially available esophageal pressure monitors increase the ease and accuracy of measuring esophageal pressure as a reflection of intrapleural pressure.12 These monitors are useful for estimating the elastic work performed by the patient during spontaneous ventilation, mechanical ventilation, or a combination of spontaneous and mechanical ventilation. By estimating intrapleural pressure on a real-time basis, it is possible to quantitate the patient’s work of breathing and changes secondary to intervention. For example, low levels of inspiratory pressure support can compensate for the work of breathing imposed by the endotracheal tube.13
Physiologic work of breathing includes elastic work (inspiratory work required to overcome the elastic recoil of the pulmonary system) and resistive work (work to overcome resistance to gas flow in the airway). For a patient in whom breathing apparatus is employed, the concept of total work of breathing encompasses physiologic work plus equipment-imposed ventilatory work to overcome the resistance imposed by the breathing apparatus, for example, an endotracheal tube or a ventilator demand valve.
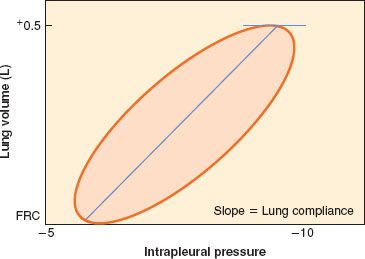
If the lungs are slowly inflated and deflated, the pressure–volume curve during inflation differs from that obtained during deflation. The two curves form a hysteresis loop that becomes progressively broader as the tidal volume is increased (Fig. 11-1). To inflate the lungs, pressure greater than the recoil pressure of deflation is needed, which means that the lung accepts deformation poorly and, once deformed, reforms to its original shape slowly. Elastic hysteresis is important for the maintenance of normal lung compliance but is not clinically significant.
FIGURE 11-1. Dynamic pressure–volume loop of resting tidal volume. Quiet, normal breathing is characterized by hysteresis of the pressure–volume loop. The lung is more resistant to deformation than expected and returns to its original configuration less easily than expected. The slope of the line connecting the zenith and nadir lung volumes is lung compliance, ∼500 mL/3 cm H2O = 167 mL/cm H2O. FRC, functional residual capacity.
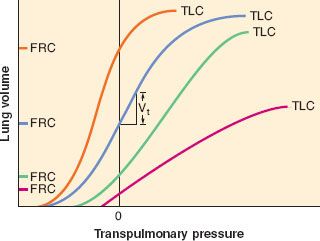
 The sum of the pressure–volume relationships of the thorax and lung results in a sigmoidal curve (Fig. 11-2). The vertical line drawn at end expiration coincides with FRC. Normally, humans breathe on the steepest part of the sigmoidal curve, where compliance (δV/δP) or slope is highest. In restrictive pulmonary diseases, the compliance curve shifts to the right, has decreased slope (δV/δP), or both. This decreased lung compliance results in smaller FRCs. When lung compliance is reduced, larger changes in intrapleural pressure are required to create the same tidal volume; that is, the thorax has to work harder to acquire the same volume of gas into the lungs. The body, being an energy conserving organism, prefers to move less gas with each breath rather than working harder to achieve the same tidal volume.
 Thus, patients with restrictive lung disease typically breathe with smaller tidal volumes at more rapid rates, making spontaneous ventilatory rate one of the most sensitive indices of lung compliance. When lung compliance is decreased, the benefit of therapeutic continuous positive airway pressure (CPAP) is its ability to shift the vertical line (defined as FRC) to the right, allowing the patient to breathe on a steeper, more efficient portion of the volume–pressure curve. In other words, CPAP can increase the FRC, which allows for a slower ventilatory rate with a larger tidal volume.
FIGURE 11-2. Pulmonary pressure–volume relationships at different values of total lung capacity (TLC), ignoring hysteresis. The blue line depicts the normal pulmonary pressure–volume relationships. Humans normally breathe on the linear, steep part of this sigmoidal curve, where the slope, which is equal to compliance, is greatest. The black vertical line at zero defines functional residual capacity (FRC), regardless of the position of the curve on the graph. Mild restrictive lung disease, indicated by the green line, shifts the curve to the right with little change in slope. However, with restrictive disease, the patient breathes on a lower FRC, at a point on the curve where the slope is less. Severe restrictive pulmonary disease profoundly depresses the FRC and diminishes the slope of the entire curve (red line). Obstructive disease (orange line) elevates both FRC and compliance.
At the other end of the spectrum, patients with diseases which increase lung compliance expend less elastic work to inspire but have decreased elastic recoil, resulting in larger than normal FRC (gas trapping). In such cases, their pressure–volume curves shift to the left and steepen. Chronic obstructive lung disease and acute asthma are the most common examples of diseases with high lung compliance. If lung compliance and FRC are sufficiently high that elastic recoil is minimal, the patient must use ventilatory muscles to actively exhale. The difficulty these patients experience in emptying the lungs is compounded by the increased airway resistance.
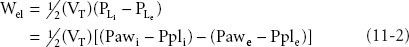
Both compliance and inspiratory elastic work can be measured for a single breath by measuring airway (Paw), intrapleural (Ppl) pressures, and tidal volume. If esophageal pressure is measured correctly, the esophageal pressure values can be substituted for Ppl values. Lung compliance, CL, the slope of the volume–pressure curve, is given by the equation

where PL is transpulmonary pressure, PLi and PLe are transpulmonary pressure at end-inspiratory and end-expiratory, VT is tidal volume, Pawe and Pawi are expiratory and inspiratory airway pressures, and Pple and Ppli are expiratory and inspiratory intrapleural pressures.
Elastic work (Wel) is performed during inspiration only because expiration is passive during normal breathing. The area within the triangle in Figure 11-2 describes the work required to inspire. The equation that yields elastic work (and the area of the triangle) is
Resistance to Gas Flow
Both laminar and turbulent flows exist within the respiratory tract, usually in mixed patterns. The physics of each, however, is significantly different and worth consideration.
Laminar Flow
Below critical flow rates that create turbulent flow, gas proceeds through a straight tube as a series of concentric cylinders that slide over one another. Fully developed flow has a parabolic profile with a velocity of zero at the cylinder wall and a maximum velocity at the center of the advancing “cone.” This type of streamlined flow is usually inaudible. The advancing conical front means that some fresh gas reaches the end of the tube before the tube has been completely filled with fresh gas. Thus, laminar flow in the airways results in alveolar ventilation that can occur even when the tidal volume (VT) is less than anatomic dead space. This phenomenon certainly has significant clinical implications, and as noted by Rohrer in 1915,14 it allows high-frequency ventilation to achieve adequate alveolar ventilation.
Resistance to laminar gas flows in a straight, unbranched cylinder can be calculated by the following equation:
where PB and PA are barometric and alveolar pressures. It is essential to note that as radius decreases in narrowed airways, resistance will increase by a power of four. Viscosity is the only physical gas property that is relevant under conditions of laminar flow. Helium has a low density, but its viscosity is close to that of air. Therefore, helium will not improve gas flow if the flow is laminar. However, if flow is turbulent due to critical airway narrowing or abnormally high airway resistance, low-density helium is useful therapy (see next section).
Turbulent Flow
High flow rates, particularly through branched or irregularly shaped tubes, disrupt the orderly flow of laminar gas. When resistance to gas flow is significant, turbulent flow occurs and is usually audible. Turbulent flow usually presents with a square front so fresh gas will not reach the end of the tube until the amount of gas entering the tube is almost equal to the volume of the tube. Thus, turbulent flow effectively purges the contents of a tube. Four conditions that will change laminar flow to turbulent flow are high gas flows, sharp angles within the tube, branching in the tube, and a decrease in the diameter of the tube. During laminar flow, resistance is inversely proportional to gas flow rate. Conversely, during turbulent flow, resistance increases significantly in proportion to the flow rate. A detailed description of these phenomena is beyond the scope of this chapter, but the reader is referred to descriptions by Nunn.15
Increased Airway Resistance
Bronchiolar smooth muscle hyperreactivity (true bronchospasm), mucosal edema, mucous plugging, epithelial desquamation, tumors, and foreign bodies all increase airway resistance. The conscious subject can detect small increases in inspiratory resistance.16 The normal response to increased inspiratory resistance is increased inspiratory muscle effort, with little change in FRC.17 Emphysematous patients retain remarkable ability to preserve an adequate alveolar ventilation, even with gross airway obstruction. In patients with preoperative Forced expiratory volume in one second (FEV1) values <1 L, PaCO2 is normal in most patients. Furthermore, asthmatic patients compensate well for increased airway resistance and also keep the mean PaCO2 in the lower end of normal range.18 Thus, an increased PaCO2 in the setting of increased airway resistance warrants serious attention as it may signal that the patient’s compensatory mechanisms are nearly exhausted. Mild expiratory resistance does not result in muscle use for active exhalation in conscious or anesthetized subjects. Instead, the initial work to overcome expiratory resistance is performed by augmenting inspiratory force until a sufficiently high lung volume is achieved, which allows elastic recoil to overcome expiratory resistance.19 Only when expiratory resistance becomes excessive are accessory muscles recruited to expel gas from the lungs. During acute increases in expiratory resistance, this response can be well tolerated by most patients. However, chronic use of accessory muscles to exhale significantly increases the risk of ventilatory failure if work of breathing is further increased. When work of breathing exceeds physiologic reserves, work of breathing becomes detrimental to physiologic homeostasis and increases the risk of ventilatory failure. Acute ventilatory failure secondary to ventilatory muscle fatigue is evidenced by an acute increase in arterial carbon dioxide. Commonly, this is precipitated by pneumonia or heart failure.
Physiologic Changes in Respiratory Function Associated with Aging
Physiologic aging of the lung is associated with dilation of the alveoli, enlargement of the airspaces, decrease in exchange surface area, and loss of supporting tissue. Changes in the aging lung and chest wall result in decreased lung recoil (elastance), creating an increased residual volume and FRC. In addition, compliance of the chest wall diminishes, thereby increasing the work of breathing compared with younger subjects. Respiratory muscle strength decreases with aging and is strongly correlated with nutritional status and cardiac index. Expiratory flow rates decrease with a flow–volume curve suggestive of small airway resistance. Despite these changes, the respiratory system is normally able to maintain adequate gas exchange at rest and during exertion throughout life, with only modest decrements in PaO2 and no change in PaCO2. With aging, respiratory centers in the nervous system demonstrate decreased sensitivity to hypoxemia and hypercapnia resulting in a blunted ventilatory response when challenged by heart failure, airway obstruction, or pneumonia.20
CONTROL OF VENTILATION
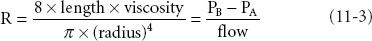
Mechanisms that control ventilation are extremely complex, requiring integration with many parts of the central and peripheral nervous systems (Fig. 11-3). LeGallois, who localized the respiratory centers in the brainstem in 1812, demonstrated that breathing does not depend on an intact cerebrum. Rather, breathing depends on a small region of the medulla near the origin of the vagus nerves.21 Countless studies in the past two centuries have greatly increased our knowledge and understanding of the anatomic components of ventilatory control. However, experimental work performed in animals is difficult to apply to humans because of interspecies variation.
FIGURE 11-3. Classic central nervous system (CNS) respiratory centers. Diagram illustrates major respiratory centers, neurofeedback circuits, primary neurohumoral sensory inputs, and mechanical outputs.
Terminology
Breathing, ventilation, and respiration are often used interchangeably. However, it is important to realize that these terms have distinct meanings. The term breathing refers to the act of inspiring and exhaling that requires energy utilization for muscle work and thus, is limited by energy reserves. Ventilation, on the other hand, is the movement of gas in and out of the lungs. When spontaneous, ventilation requires energy for muscle work and is thus, breathing. Respiration occurs when energy is released from organic molecules. Such energy release is dependent on the movement of gas molecules such as carbon dioxide and oxygen across membranes whether alveolar or mitochondrial. Thus, humans breathe to ventilate and ventilate to respire. Despite what appears to be clear distinctions in terminology, vernacular use of these terms are often confused in daily dialog. For example, respirators are used to treat those who have succumbed to respiratory arrest and do not have a respiratory rate, and residents are sometimes advised to breathe down a patient using potent anesthetic agent.
Generation of Ventilatory Pattern
Refer to Table 11-3 for definitions of terms used in this section. A respiratory center is a specific area in the brain that integrates neural traffic resulting in spontaneous ventilation. Within the pontine and medullary reticular formations, there are several discrete respiratory centers that function as the control system (see Fig. 11-3).
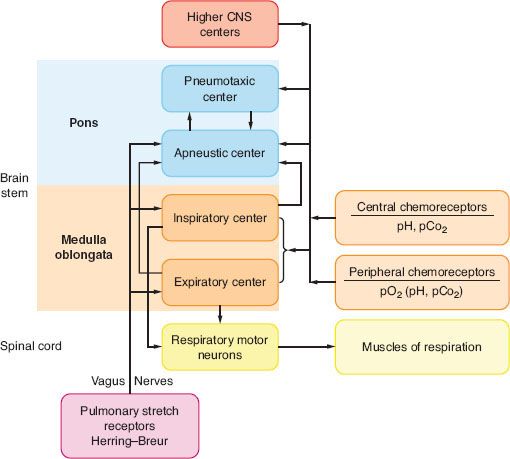
TABLE 11-3. DEFINITION OF RESPIRATORY PATTERN TERMINOLOGY
Initial descriptions of brainstem respiratory functions are based on classic ablation and electrical stimulation studies. Another method for localizing respiratory centers entails recording action potentials from different areas of the brainstem with microelectrodes. This method is based on the assumption that local brain activity that occurs in phase with respiratory activity is evidence that the area under study has “respiratory neurons”.22 These techniques are imperfect for precisely localizing discrete respiratory centers.
Medullary Centers
The medulla oblongata contains the most basic ventilatory control centers in the brain. Specific medullary areas are primarily active during inspiration or during expiration, with many neural inspiratory or expiratory interconnections. The inspiratory centers that reside in the dorsal respiratory group (DRG) are located in the dorsal medullary reticular formation. The DRG is the source of elementary ventilatory rhythmicity23,24 and serves as the “pacemaker” for the respiratory system.25 Whereas resting lung volume occurs at end expiration, the electrical activity of the ventilatory centers is at rest at end inspiration. The rhythmic activity of the DRG persists even when all incoming peripheral and interconnecting nerves are sectioned or blocked completely. Isolating the DRG in this manner results in ataxic, gasping ventilation with frequent maximum inspiratory efforts: Apneustic breathing.
The ventral respiratory group (VRG), which is located in the ventral medullary reticular formation, serves as the expiratory coordinating center. The inspiratory and expiratory neurons function by a system of reciprocal innervation, or negative feedback.22 When the DRG creates an impulse to inspire, inspiration occurs and the DRG impulse is quenched by a reciprocating VRG impulse. This VRG transmission prohibits further use of the inspiratory muscles, thus allowing passive expiration to occur.
Pontine Centers
The pontine centers process information that originates in the medulla. The apneustic center is located in the middle or lower pons. With activation, this center sends impulses to inspiratory DRG neurons and is designed to sustain inspiration. Electrical stimulation of this area results in inspiratory spasm.26 The middle and lower pons contain specific areas for phase-spanning neurons.27 These neurons assist with the transition between inspiration and expiration, and do not exert direct control over ventilatory muscles.
The pneumotaxic respiratory center is in the rostral pons. A simple transection through the brainstem that isolates this portion of the pons from the upper brainstem reduces ventilatory rate and increases tidal volume. If both vagus nerves are additionally transected, apneusis results.28 Thus, the primary function of the pneumotaxic center is to limit the depth of inspiration. When maximally activated, the pneumotaxic center secondarily increases ventilatory frequency. However, the pneumotaxic center performs no pacemaking function and has no intrinsic rhythmicity.
Higher Respiratory Centers
Many higher brain structures clearly affect ventilatory control processes. In the midbrain, stimulation of the reticular activating system increases the rate and amplitude of ventilation.29 The cerebral cortex also affects breathing pattern, although precise neural pathways are not known. Occasionally, the ventilatory control process becomes subservient to other regulatory centers. For example, the respiratory system plays an important role in the control of body temperature because it supplies a large surface area for heat exchange. This is especially important in animals in which panting is a primary means of dissipating heat. Thus, the, ventilatory pattern is influenced by neural input from descending pathways from the anterior and posterior hypothalamus to the pneumotaxic center of the upper pons.
Vasomotor control and certain respiratory responses are closely linked. Stimulation of the carotid sinus not only decreases vasomotor tone, but also inhibits ventilation. Alternatively, stimulation of the carotid body chemoreceptors (see Chemical Control of Ventilation section) results in an increase in both ventilatory activity and vasomotor tone.
Reflex Control of Ventilation
Reflexes that directly influence ventilatory pattern usually do so to prevent airway obstruction. Deglutition, or swallowing, involves the glossopharyngeal and vagus nerves. Stimulation of the anterior and posterior pharyngeal pillars of the posterior pharynx induces swallowing. During swallowing, inspiration ceases momentarily, it is usually followed by a single large breath, and briefly increases ventilation.
Vomiting significantly modifies normal ventilatory activity.30 Swallowing, salivation, gastrointestinal reflexes, rhythmic spasmodic ventilatory movements, and significant diaphragmatic and abdominal muscular activity must be coordinated over a very brief interval. Because of the obvious risk of aspirating gastric contents, it is advantageous to inhibit inspiration during vomiting. Input into the respiratory centers occurs from both cranial and spinal cord nerves.
Coughing results from stimulation of the tracheal subepithelium, especially along the posterior tracheal wall and carina.31 Coughing also requires coordination of both airway and ventilatory muscle activity. An effective cough requires deep inspiration and then forced exhalation against a momentarily closed glottis to increase intrathoracic pressure, thus allowing an expulsive expiratory maneuver.
Proprioception in the pulmonary system, the qualitative knowledge of the gas volume within the lungs, probably arises from smooth muscle spindle receptors. These proprioceptors, which are located within the smooth muscle of all airways, are sensitive to pressure changes. Airway stretch reflexes can be demonstrated during distention of isolated airways so airway pressure, rather than volume distention, appears to be the primary stimulation.32 Clinical conditions in which pulmonary airway stretch receptors are stimulated include pulmonary edema and atelectasis.
Golgi tendon organs (tendon spindles), which are arranged in series within ventilatory muscles, facilitate proprioception. The intercostal muscles are rich in tendon spindles, whereas the diaphragm has a limited number. Thus, the pulmonary stretch reflex primarily involves the intercostal muscles but not the diaphragm. When the lungs are full and the chest wall is stretched, these receptors send signals to the brainstem that inhibit further inspiration.
In 1868, Hering and Breuer reported that lightly anesthetized, spontaneously breathing animals would cease or decrease ventilatory effort during sustained lung distention.33 This response was blocked by bilateral vagotomy. The Hering–Breuer reflex is prominent in lower-order mammals and is sufficiently active in lower mammals that even 5 cm H2O CPAP will induce apnea. In humans, however, the reflex is only weakly present, as evidenced by the fact that humans will continue to breathe spontaneously with CPAP in excess of 40 cm H2O.
Chemical Control of Ventilation
Peripheral Chemoreceptors
In a simplistic view of chemical ventilatory control, the peripheral chemoreceptors respond primarily to lack of oxygen, and the central nervous system (CNS) receptors respond primarily to changes in PCO2, pH, and acid–base disturbances.
The peripheral chemoreceptors are composed of the carotid and aortic bodies. The carotid bodies, located at the bifurcation of the common carotid artery, have predominantly ventilatory effects. The aortic bodies, which are scattered about the aortic arch and its branches, have predominantly circulatory effects. The neural output from the carotid body reaches the central respiratory centers via the afferent glossopharyngeal nerves. Output from the aortic bodies travels to the medullary centers via the vagus nerve. Both carotid and aortic bodies are stimulated by decreased PaO2, but not by decreased SaO2 or CaO2. When PaO2 falls to less than 100 mm Hg, neural activity from these receptors begins to increase. However, it is not until the PaO2 reaches 60 to 65 mm Hg that neural activity increases sufficiently to substantially augment minute ventilation. Thus, patients who depend on hypoxic ventilatory drive have PaO2 values in the mid-60s. Once the PaO2 values of these patients exceed 60 to 65 mm Hg, ventilatory drive diminishes and PaO2 falls until ventilation is again stimulated by arterial hypoxemia. Thus, during withdrawal of mechanical ventilatory support in the patient who depends on hypoxic ventilatory drive, the PaO2 must fall to less than 65 mm Hg for spontaneous ventilation to resume.
The carotid bodies are also sensitive to decreased pHa, but this response is minor. Similarly, changes in PaCO2 do not stimulate these receptors sufficiently to alter minute ventilation. Increases in blood temperature, hypoperfusion of the carotid bodies themselves, and some chemicals will stimulate these receptors. Sympathetic ganglion stimulation by nicotine or acetylcholine will stimulate the carotid and aortic bodies; this effect is blocked by hexamethonium. Blockade of the cytochrome electron transport system by cyanide will prevent oxidative metabolism and will also stimulate these receptors.
Ventilatory effects resulting from stimulation of these receptors are increased ventilatory rate and tidal volume. Hemodynamic changes resulting from stimulation of these receptors include bradycardia, hypertension, increases in bronchiolar tone, and increases in adrenal secretion. The carotid body chemical receptors have been termed ultimum moriens (“last to die”). Although the response of peripheral receptors to hypoxemia was formerly believed to be resistant to the influences of anesthesia, potent inhaled anesthetics appear to depress hypoxic ventilatory response by depressing carotid body response to hypoxemia.34 The response of the peripheral receptors is not sufficiently robust to reliably increase ventilatory rate or minute ventilation to herald the onset of arterial hypoxemia during general anesthesia or recovery from anesthesia. Furthermore, flumazenil, in a 1 mg intravenous dose, only partially reversed the diazepam-induced depression of hypoxic ventilatory drive.35 Mora’s data further suggest that humans may develop tolerance to respiratory depressant effects of diazepam.
Central Chemoreceptors
Approximately 80% of the ventilatory response to inhaled carbon dioxide originates in the central medullary centers. Acid–base regulation involving carbon dioxide, H+, and bicarbonate is related primarily to chemosensitive receptors located in the medulla close to or in contact with the cerebrospinal fluid (CSF). The chemosensitive areas of the brainstem are in the inferolateral aspects of the medulla near the origin of cranial nerves IX and X. The area just beneath the surface of the ventral medulla is exquisitely sensitive to the extracellular fluid H+ concentration.36 Although the central response is the major factor in the regulation of breathing by carbon dioxide, carbon dioxide has little direct stimulating effect on these chemosensitive areas. These receptors are primarily sensitive to changes in H+ concentration. Carbon dioxide has a potent but indirect effect by reacting with water to form carbonic acid, which dissociates into hydrogen and bicarbonate ions.37
An acute increase in PaCO2 is a more potent ventilatory stimulus than an acute increase in arterial H+ concentration from a metabolic source. Carbon dioxide, but not H+, passes readily through the blood–brain and blood–CSF barriers. Local buffering systems immediately neutralize H+ in arterial blood and body fluids. In contrast, the CSF has minimal buffering capacity. Thus, once carbon dioxide crosses into the CSF, H+ are created and trapped in the CSF, resulting in a CSF H+ concentration considerably greater than that found in the blood. Because carbon dioxide crosses the blood–brain barrier readily, the PCO2 values in the CSF, cerebral tissue, and jugular venous blood rise quickly and to the same degree as the PaCO2, although the central values are ∼10 mm Hg higher than those measured in arterial blood.
The ventilatory response to changes in PaCO2 (increased VT, increased respiratory rate) is rapid and peaks within 1 to 2 minutes after an acute change in PaCO2. With the same, persistent level of carbon dioxide stimulation, the resultant increase in ventilation declines over a period of several hours, probably as a result of bicarbonate ions that are actively transported from the blood into the CSF through the arachnoid villi, thereby increasing CSF pH toward the normal range.38
With chronic carbon dioxide retention, CSF pH is renormalized which determines ventilatory response to subsequent changes in arterial carbon dioxide tension. This phenomenon explains the differing effects of acute hypercapnia versus chronic hypercapnia on the CNS mediated ventilatory response. The goals of mechanical ventilatory support in a patient with chronic CO2 retention are different from a normal patient. In this instance, providing mechanical support which allows a PaCO2 range to generate a pH which is normal for that specific patient is referred to as “eucapnic ventilation.” Attempting to achieve a normal PaCO2, “normocarbia,” in such a patient will iatrogenically result in alkalemia, further increasing CSF pH and raising the apneic threshold.39 Finally, central medullary chemoreceptors also respond to temperature change. Cold CSF (with normal pH) or local anesthetic applied to the medullary surface will depress ventilation.
Ventilatory Response to Altitude
Ventilatory response and adaptation to high altitude are good examples of the integration of peripheral and central chemoreceptor control of ventilation. The following mechanism of acclimatization was proposed by Severinghaus and coworkers in 1963 and has since been confirmed.40
Following ascent from sea level to 4,000 m, acute exposure to high altitude and low PIO2 results in arterial hypoxemia. This decrease in PaO2 activates the peripheral hypoxemic ventilatory drive by stimulating the carotid and aortic bodies, and causes increased minute ventilation. As minute ventilation increases, PaCO2 and CSF PCO2 decrease, causing concomitant increases in pHa and CSF pH. The alkaline shift of the CSF decreases ventilatory drive via medullary chemoreceptors, partially offsetting hypoxemic drive. A temporary equilibrium is attained within minutes, with PaCO2 only 2 to 5 mm Hg less than normal and PaO2 approximately 45 mm Hg. This initially profound hypoxemia probably causes the acute respiratory distress and other associated symptoms (headache, diarrhea) associated with rapid ascent. However, the CNS is able to restore CSF pH to normal (7.326) by pumping bicarbonate ions out of the CSF over 2 to 3 days. In 2 to 3 days, CSF bicarbonate concentration decreases approximately 5 mEq/L and restores CSF pH to within 0.01 pH unit of values at sea level. Then, centrally mediated ventilatory drive returns to normal, and hypoxic drive and stimulation of peripheral receptors can proceed unopposed. Thus, after 3 days’ exposure to 4,000 m altitude, ventilatory adaptation would result in a new equilibrium, with PaCO2 approximately 30 mm Hg and PaO2 approximately 55 mm Hg. Following descent to sea level, the low CSF bicarbonate concentration persists for several days, and the climber “overbreathes” until CSF bicarbonate and pH values return to normal.
Breath-holding
Most adults with normal lungs and gas exchange can hold their breath for ∼1 minute when breathing room air without previously hyperventilating. After 1 minute of breath-holding under these circumstances, PaO2 decreases to ∼65 to 70 mm Hg and PaCO2 increases by ∼12 mm Hg. In the absence of supplemental oxygen and hyperventilation, the “breakpoint” at which normal people are compelled to breathe is remarkably constant at a PaCO2 of 50 mm Hg.41,42 However, if the individual breathes 100% oxygen before breath-holding, he or she should be able to hold his or her breath for 2 to 3 minutes, or until PaCO2 rises to 60 mm Hg. Hyperventilation before breath-holding reducing PaCO2 to 20 mm Hg can lengthen the period of breath-holding to 3 to 4 minutes.43 Hyperventilation with 100% oxygen before breath-holding should extend the apneic period to 6 to 10 minutes. The rate of PaCO2 rise in awake, preoxygenated adults with normal lungs who hold their breath without previous hyperventilation is 7 mm Hg/min in the first 10 seconds, 2 mm Hg/min in the next 10 seconds, and 6 mm Hg/min thereafter.42
The duration of voluntary breath-holding is directly proportional to lung volume at onset, and is probably related both to oxygen stores in the alveoli and to the rate at which PaCO2 rises. With smaller lung volumes, the same amount of carbon dioxide is emptied into a smaller volume during the apneic period, thus increasing the carbon dioxide concentration more rapidly than occurs with larger lung volumes. Of note, apneic patients during general anesthesia actually “breath-hold” at FRC rather than at vital capacity (VC), which tends to accelerate the rate of PaCO2 rise. Despite this difference in lung volume, the rate of rise of PaCO2 in apneic anesthetized patients is 12 mm Hg during the first minute and 3.5 mm Hg/min thereafter, significantly lower than in the awake state.43,44 During anesthesia, metabolic rate and carbon dioxide production are significantly less than during ambulatory wakefulness, which likely accounts for the lower rate of PaCO2 rise under anesthesia.
Hyperventilation with room air prior to prolonged breath-holding during exercise is inadvisable. During underwater swimming after poolside hyperventilation, the urge to breathe is first stimulated by a rising PaCO2. Because an increased arterial carbon dioxide tension provides the stimulus to inspire, swimmers who hyperventilate with room air before swimming long distances frequently lose consciousness from arterial hypoxemia before the PaCO2 is sufficiently increased to stimulate the “need” to breathe.
Hyperventilation is rarely followed by an apneic period in awake humans, despite a markedly depressed PaCO2. However, minute ventilation may decrease significantly. Aggressive intermittent positive-pressure breathing treatments for patients with COPD who continue to have a carbon dioxide based ventilatory drive can depress minute ventilation sufficiently to create arterial hypoxemia if they breathe room air after cessation of therapy.45 In contrast, even mild hyperventilation during general anesthesia will produce prolonged apneic periods.46
Quantitative Aspects of Chemical Control of Breathing
The ventilatory responses to oxygen and carbon dioxide can be assessed quantitatively. Unfortunately, the quantitative indices of hypoxemic sensitivity are not clinically useful because the normal range is wide and confounded by many environmental factors. The reader is referred to a classical discussion of the quantitative indices of hypoxemic sensitivity.47
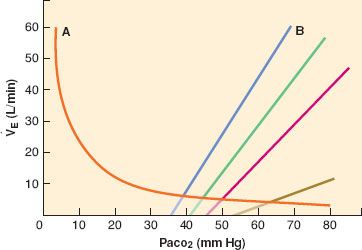
Ventilatory responses to PaCO2 changes are measured in several ways, provided that carbon dioxide production remains constant. When subjects voluntarily increase minute ventilation to a prescribed level, the PaCO2 decreases hyperbolically. The plot of minute ventilation (independent variable) and PaCO2 (dependent variable) is the metabolic hyperbola (Fig. 11-4). The metabolic hyperbola is cumbersome to evaluate and difficult to use clinically.
FIGURE 11-4. Carbon dioxide–ventilatory response curve. The metabolic hyperbola, curve A, is generated by varying VA/QE and measuring changes in carbon dioxide concentration. The hyperbolic configuration makes it cumbersome for clinical use. The carbon dioxide–ventilatory response curve, B, is linear between approximately 20 and 80 mm Hg. It is generated by varying PaCO2 (usually by controlling inspired carbon dioxide concentration) and measuring the resultant VA/QE. This is the most commonly used test of ventilatory response. The slope defines “sensitivity”; the set point, or resting PaCO2, occurs at the intersection of the metabolic hyperbola and the carbon dioxide–ventilatory response curve; and the apneic threshold can be obtained by extrapolating the carbon dioxide–ventilatory response curve to the x-intercept. In the absence of surgical stimulation, increasing doses of potent inhaled anesthesia or opioids will shift the curve to the right and eventually depress the slope (green, red, and brown lines). Painful stimulation will reverse these changes to varying and unpredictable degrees.
Related posts:


Stay updated, free articles. Join our Telegram channel

Full access? Get Clinical Tree


