(10.1)
This ratio is typically reported as a percentage (the percent saturation of hemoglobin). The SO2 can be measured using spectrophotometry (which is called oximetry, and is described in Chapter 21), or it can be estimated using the PO2 of blood, as described next.
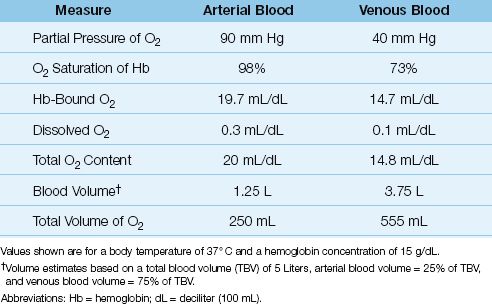
Table 10.1 Normal Measures of Oxygen in Arterial and Venous Blood
Oxyhemoglobin Dissociation Curve
The SO2 is determined by the PO2 in blood and the tendency of the iron moieties in hemoglobin to bind O2. The relationship between SO2 and PO2 is described by the oxyhemoglobin dissociation curve like the one shown in Figure 10.1. The “S” shape of the curve offers two advantages. First, the arterial PO2 (PaO2) is normally on the upper, flat part of the curve, which means that a large drop in PaO2 (down to 60 mm Hg) results in only minor changes in the arterial O2 saturation (SaO2). Secondly, the capillary PO2 (which is equivalent to the venous PO2 or PvO2 after equilibration with the tissues) is on the steep portion of the curve, which facilitates the exchange of O2 in both the pulmonary and systemic capillaries.
SHIFTS IN THE CURVE: A number of conditions can alter the affinity of hemoglobin for O2 and shift the position of the oxyhemoglobin dissociation curve. These are listed in the boxes in Figure 10.1. A shift of the curve to the right facilitates oxygen release in the systemic capillaries, while a shift to the left facilitates oxygen uptake in the pulmonary capillaries. The position of the curve is indicated by the P50, which is the PO2 that corresponds to an O2 saturation of 50%. The P50 is normally about 27 mm Hg (1), and it increases when the curve shifts to the right, and de-creases when the curve shifts to the left. A decrease in the P50 to 15 mm Hg has been reported in blood that is stored in acid-citrate-dextrose (ACD) preservative for 3 weeks, due to a leftward shift in the oxyhemoglobin dissociation curve from depletion of 2,3 diphosphoglycerate (2,3-DPG) in the red blood cells (2).
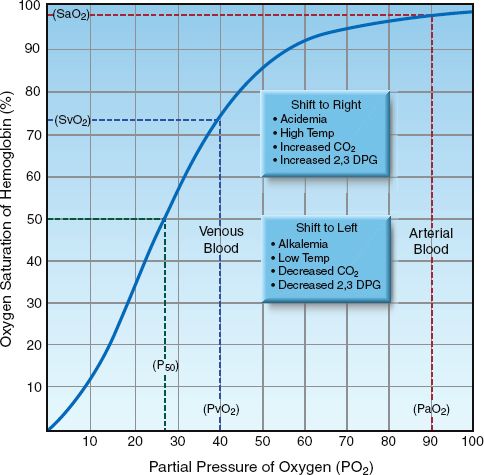
FIGURE 10.1 Oxyhemoglobin dissociation curve showing the normal relationship between the PO2 in blood and the O2 saturation of hemoglobin. The P50 is the PO2 that corresponds to 50% saturation of hemoglobin with O2. Abbreviations: PaO2 = arterial PO2; PvO2 = venous PO2; SaO2 = arterial SO2; SvO2 = venous SO2.
Shifts in the oxyhemoglobin dissociation curve have opposing effects in the pulmonary and systemic capillaries that seem to cancel each other. For example, a rightward shift of the curve caused by acidemia (the Bohr effect) will facilitate O2 release in the systemic capillaries but will hinder O2 uptake in the pulmonary capillaries. So what is the net effect of acid-emia on tissue oxygenation? The answer is based on the influence of shifts in the oxyhemoglobin dissociation curve on different portions of the curve; i.e., shifts in the curve cause less of a change in the flat portion of the curve (where the arterial PO2 and SO2 reside) than in the steep portion of the curve (where the capillary PO2 and SO2 reside). Therefore, a rightward shift of the curve from acidemia will facilitate O2 release in the systemic capillaries more than it hinders O2 uptake in the pulmonary capillaries, and the overall effect benefits tissue oxygenation.
Oxygen Content
The concentration of O2 in blood (called the O2 content) is the summed contribution of the O2 that is bound to hemoglobin and the O2 that is dissolved in plasma.
Hemoglobin-Bound Oxygen
The concentration of hemoglobin-bound O2 (HbO2) is described by the following equation (3):
 (10.2)
where: [Hb] is the concentration of hemoglobin in g/dL (grams per 100 mL), 1.34 is the O2 binding capacity of hemoglobin, in mL/g (i.e., one gram of hemoglobin will bind 1.34 mL of O2 when fully saturated), and SO2 is the O2 saturation, expressed as a ratio.
Dissolved Oxygen
Oxygen does not dissolve readily in plasma (which is why hemoglobin is needed as a carrier molecule). The solubility of O2 in plasma is temperature-dependent, and varies inversely with a change in body temperature. At a normal body temperature (37°C), each increment in PO2 of 1 mm Hg will increase the concentration of dissolved O2 by 0.03 mL/L (4). This relationship is expressed as a solubility coefficient of 0.03 mL/L/mm Hg. The concentration of dissolved O2 in plasma at 37°C is then described as follows:
 (10.3)
(Note that the solubility coefficient is reduced by a factor of 10 so the units of dissolved O2 are the same as those for hemoglobin-bound O2.) This equation highlights the limited solubility of oxygen in plasma (see next).
Arterial O2 Content
The O2 content in arterial blood (CaO2) is determined by combining equations 10.2 and 10.3 and inserting the SO2 and PO2 of arterial blood (SaO2 and PaO2).
 (10.4)
As shown in Table 10.1, the normal arterial O2 content is 20 mL/dL (or 200 mL/L), and only 1.5% (0.3 mL/dL) represents dissolved O2. Note also that the total volume of O2 in arterial blood is less than half the volume of O2 in venous blood (!). This is a reflection of the uneven distribution of blood volume in the circulatory system, with 75% of the volume in the veins.
Venous O2 Content
The venous O2 content (CvO2) represents the O2 content in “mixed” venous blood (from the right heart or pulmonary artery). The equation describing CvO2 is similar in format to equation 10.4, but the SO2 and PO2 are for mixed venous blood (SvO2 and PvO2).
 (10.5)
As shown in Table 10.1, the normal mixed venous O2 content is about 15 mL/dL, and less than 1% (0.1 mL/dL) represents dissolved O2. Note also that the difference between the arterial and venous O2 content (CaO2 – CvO2) is 5 ml/dL, or 50 mL/L, which means that 50 mL of O2 is extracted from each liter of blood flowing through the capillaries. At a normal cardiac output of 5 L/min, the O2 extracted from capillary blood would be 5 × 50 = 250 mL/min, which is the normal O2 consumption in an adult at rest. This demonstrates how the oxygenation of blood can provide information about tissue oxygenation.
Simplified O2 Content Equation
The dissolved O2 is such a small fraction of the total O2 content that it is usually eliminated from the equation describing O2 content, as shown below.
 (10.6)
The O2 content of blood is thus equivalent to the Hb-bound O2, as de-scribed in Equation 10.2.
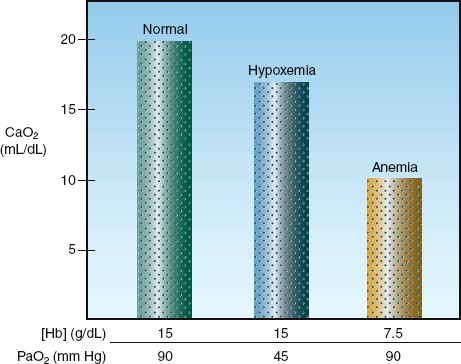
FIGURE 10.2 The effects of equivalent (50%) reductions in hemoglobin concentration [Hb] and arterial PO2 (PaO2) on the oxygen content in arterial blood (CaO2).
Anemia vs. Hypoxemia
There is a tendency to use the arterial PO2 (PaO2) as an indication of how much O2 is in the blood. However, the O2 content of blood is determined primarily by [Hb], as shown in equation 10.6. The influence of proportional decreases in [Hb] and PaO2 on the arterial O2 content is shown in Figure 10.2. A 50% reduction in [Hb] (from 15 to 7.5 g/dL) results in an equivalent 50% reduction in CaO2 (from 20 to 10 mL/dL), while a 50% reduction in the PaO2 (from 90 to 45 mm Hg, which corresponds to a decrease in SaO2 from 98% to 78%) results in only a 20% decrease in CaO2 (from 20 to 16 mL/dL). This demonstrates that anemia has a much greater influence on arterial oxygenation than hypoxemia. The PaO2 measurement is useful for evaluating gas exchange in the lungs (as described in Chapter 20), not for evaluating the oxygenation of blood.
SYSTEMIC OXYGEN BALANCE
Oxygen Transport & Energy Metabolism
The business of nutrient metabolism is to extract the energy stored in nutrient fuels (which is accomplished by disrupting high-energy carbon bonds) and transfer the energy to storage molecules like adenosine triphosphate (ATP). The energy yield from this process is determined by the balance between rate of O2 transport to metabolizing tissues and the rate of metabolism. This balance is illustrated in Figure 10.3. Oxygen transport has two components: the rate of O2 delivery to the microcirculation (DO2), and the rate of O2 uptake into the tissues (VO2). When the VO2 matches the metabolic rate (MR), glucose is completely oxidized to yield 36 ATP molecules (673 kcal) per mole. When VO2 is less than the metabolic rate (i.e., when VO2<MR), some of the glucose is diverted to form lactate, and the energy yield falls to 2 ATP molecules (47 kcal) per mole.
Types of Hypoxia
The condition where the energy yield of nutrient metabolism is limited by the availability of oxygen is called dysoxia (5), and the clinical expression of this condition is multiorgan dysfunction progressing to multiorgan failure. Dysoxia can be the result of an inadequate supply of O2, which results in tissue hypoxia, or it can be caused by a defect in oxygen utilization in the mitochondria, which is called cytopathic hypoxia (6,7). Tissue hypoxia is the mechanism of organ injury in hypovolemic and cardiogenic shock (6), whereas cytopathic hypoxia is operative in severe sepsis and septic shock (7).
As demonstrated in Figure 10.3, the DO2 and VO2 play an important role in determining the energy yield from nutrient metabolism. The remainder of this section will describe how the DO2 and VO2 are derived, and how the relationship between DO2 and VO2 can be used to evaluate the state of tissue oxygenation. These parameters require a measurement of cardiac output, which can be obtained using the thermodilution technique (described in Chapter 8) or a variety of noninvasive techniques (de-scribed in Reference 8). The normal range of values for the O2 transport parameters are shown in Table 10.2.
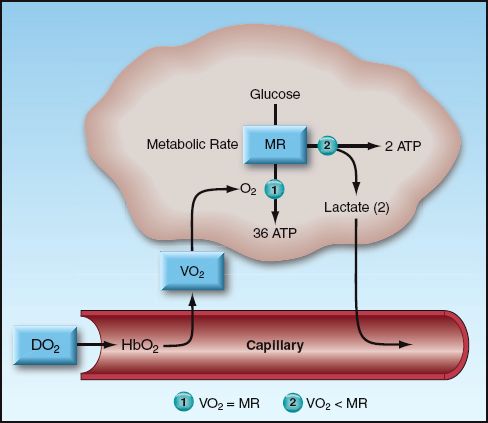
FIGURE 10.3 Illustration of the factors that determine the energy yield from glucose metabolism. When the rate of oxygen uptake (VO2) into the tissues is unable to match the metabolic rate (MR), glucose metabolism is diverted to lactate production, and the energy yield drops dramatically. Abbreviations: DO2 = rate of O2 delivery; HbO2 = oxygenated hemoglobin; ATP = adenosine triphosphate.
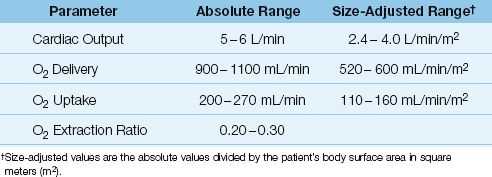
Table 10.2 Oxygen Transport Parameters and Normal Range of Values
Oxygen Delivery (DO2)
The rate of O2 transport from the heart to the systemic capillaries is called the oxygen delivery (DO2), and is a function of the cardiac output (CO) and the O2 content of arterial blood (CaO2) (9).
 (10.7)
(The multiplier of 10 is used to convert the CaO2 from mL/dL to mL/L.) If the CaO2 is broken down into its components (1.34 × [Hb] × SaO2), equation 10.7 can be rewritten as:
 (10.8)
Three measurements are needed to calculate the DO2: cardiac output, hemoglobin concentration, and arterial O2 saturation. The DO2 in healthy adults at rest is 900–1100 mL/min, or 500–600 mL/min/m2 when adjusted for body size (see Table 10.2).
Oxygen Uptake
The rate of O2 transport from the systemic capillaries into the tissues is called the oxygen uptake (VO2). Since oxygen is not stored in tissues, the VO2 is also a global measure of the oxygen consumption of metabolizing tissues. The VO2 can be described as the product of the cardiac output (CO) and the difference between arterial and venous O2 content (CaO2 – CvO2).
 (10.9)
(The multiplier of 10 is included for the same reason as explained for the DO2.) This equation is a modified version of the Fick equation for cardiac output (CO = VO2/CaO2 – CvO2); using this equation to calculate the VO2 is called the reverse Fick method (10). The CaO2 and CvO2 in equation 10.9 share a common term (1.34 × [Hb]), so the equation can be restated as:
 (10.10)
Four measurements are required to calculate the VO2: the 3 measurements used for the DO2 calculation, plus the O2 saturation in “mixed” venous blood (SvO2) in the pulmonary artery, which requires a pulmon-ary artery catheter. The VO2 in healthy adults at rest is 200–300 mL/min, or 110–160 mL/min/m2 when adjusted for body size (see Table 10.2).
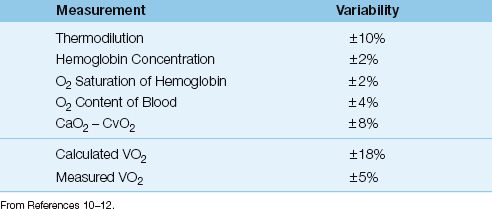
Variability
Each of the 4 measurements used to derive the VO2 has an inherent variability, and these are shown in Table 10.3 (10–12). The variability of the calculated VO2 is ±18%, which is the summed variability of the component measurements. Therefore, the VO2 that is calculated from the modified Fick equation must change by at least 18% for the change to be considered significant.
Fick Method vs. Whole Body VO2
The calculated VO2 from the modified Fick equation is not the whole body VO2 because it does not include the O2 consumption of the lungs (10,13,14). Normally, the VO2 of the lungs accounts for less than 5% of the whole body VO2 (13), but it can make up 20% of the whole body VO2 when there is inflammation in the lungs (which is common in ICU patients) (14).
WHOLE BODY VO2: The whole body VO2 is measured by monitoring the O2 concentration in inhaled and exhaled gas. This requires a specialized in-strument equipped with an oxygen analyzer (such as the metabolic carts used by nutrition support services). The instrument is connected to the proximal airway (usually in intubated patients), and it records the VO2 as the product of minute ventilation (VE) and the fractional concentration of O2 in inhaled and exhaled gas (FIO2 and FEO2).
 (10.11)
The measured (whole body) VO2 has a variability of ±5% (10,12), which is much less than the variability of the calculated VO2, as shown in Table 10.3. The major drawback of the measured VO2 is the need for specialized equipment and trained personnel, which is costly and limits the availability of the measurement.
Table 10.3 Variability of Measurements Related to VO2
Using the VO2
The two conditions associated with a low VO2 are a decreased metabolic rate (hypometabolism) and inadequate tissue oxygenation resulting in anaerobic metabolism. Since hypometabolism is uncommon in ICU pa-tients, an abnormally low VO2 (<200 mL/min or <110 mL/min/m2) can be used as evidence of inadequate tissue oxygenation. An example of this is shown in Figure 10.4, which shows serial measurements of cardiac index (CI), systemic O2 uptake (VO2), and serum lactate levels during the first postoperative day in a patient who underwent an abdominal aortic aneurysm repair. Note that the VO2 is abnormally low throughout the study period, while the serum lactate began to rise above normal (>4 mM/L) at the 8th postoperative hour. The abnormally low VO2 represents inadequate tissue oxygenation, as confirmed by the eventual rise in blood lactate levels. However, there is a lag time of 6 hours from the first evidence of a low VO2 to the first evidence of an elevated lactate level. This indicates that the VO2 may be a more sensitive marker of inadequate tissue oxygenation than the serum lactate level. Note that the cardiac index remains in the normal range despite the evidence of impaired tissue oxygenation, demonstrating the nonvalue of cardiac output monitoring for evaluating tissue oxygenation.
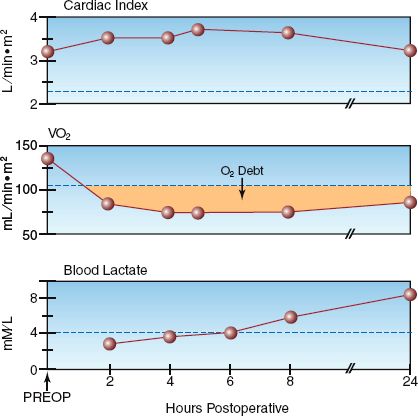
FIGURE 10.4 Serial measurements of cardiac index, systemic O2 uptake (VO2), and blood lactate levels in the postoperative period following an abdominal aortic aneurysm repair. The dotted lines indicate the upper or lower limits of normal for each measurement. The shaded area represents the oxygen debt.
OXYGEN DEBT: The shaded area in the VO2 curve in Figure 10.4 shows the magnitude of the VO2 deficit over time. The cumulative deficit in tissue oxygenation is called the oxygen debt, and clinical studies have shown a direct relationship between the size of the oxygen debt and the risk of multiorgan failure (15,16).
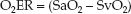
Oxygen Extraction
The fractional uptake of O2 into tissues is determined with the oxygen extraction ratio (O2ER), which is the ratio of O2 uptake (VO2) to O2 delivery (DO2).
 (10.12)
This ratio can be multiplied by 100 and expressed as a percentage. The VO2 and DO2 share common terms (Q × 1.34 × [Hb] × 10), which allows equation 10.12 to be restated as follows:
 (10.13)
Maintaining an SaO2 above 0.9 (90%) is a standard practice, so the de-nominator in equation 10.13 can be eliminated; i.e.,
 (10.14)
When arterial blood is fully oxygenated (SaO2 = 1), the O2ER is determined by a single variable, as shown below:
 (10.15)
The VO2 is normally about 25% of the DO2, so the normal O2ER is 0.25 (range = 0.2–0.3, as shown in Table 10.2). Thus, only 25% of the O2 delivered to the capillaries is taken up into the tissues when conditions are normal. This changes when O2 delivery is reduced, as described next.
Control of VO2
The oxygen transport system operates to maintain a constant VO2 in the face of variations in O2 delivery (DO2), and this is accomplished by compensatory changes in the O2 extraction (17). This control system is de-scribed by rearranging the terms in equation 10.12 so that VO2 is the dependent variable:
 (10.16)
This equation predicts that the VO2 will remain constant when DO2 is decreased if there is an equivalent increase in O2 extraction. However, if O2 extraction is fixed, a decrease in DO2 will result in an equivalent decrease in VO2.
The control of VO2 is demonstrated by the relationship between DO2 and VO2 in Figure 10.5 (17). O2 extraction is represented by the (SaO2 – SvO2) difference because the SaO2 is above 90%. At the normal point on the curve, the (SaO2 – SvO2) is 25%. As the DO2 decreases below normal (moving to the left along the curve), the VO2 initially remains unchanged, indicating that the O2 extraction is increasing. However, a point is eventually reached where the VO2 begins to decrease; at this point, the SvO2 has dropped to 50%, resulting in an increase in (SaO2 – SvO2) to almost 50%. The point where the VO2 begins to decrease is the point where O2 extraction is maximal (about 50%) and is unable to increase further. Beyond this point, decreases in DO2 are accompanied by similar decreases in VO2, indicating the onset of tissue hypoxia. Thus, the point where O2 extraction is maximal is the anaerobic threshold.
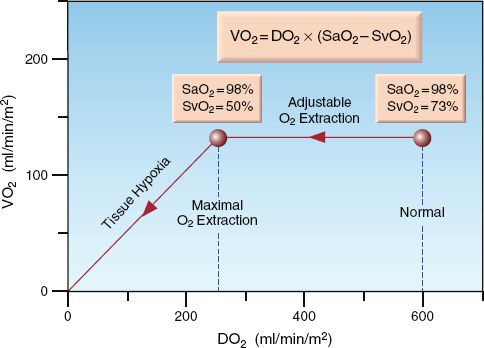
FIGURE 10.5 Graph showing the relationship between O2 delivery (DO2) and O2 up-take (VO2). O2 extraction is represented by (SaO2 – SvO2). See text for explanation.
Monitoring O2 Extraction
The O2 extraction can be monitored as the (SaO2 – SvO2) as long as the SaO2 is above 90%. The SaO2 is monitored by pulse oximetry (described in Chapter 21) and the SvO2 is monitored with pulmonary artery catheters (or central venous catheters, as described later). The following general rules can be applied to the interpretation of (SaO2 – SvO2). These interpretations are based on the assumption that the metabolic rate is normal or unchanging.
1. The normal (SaO2 – SvO2) is 20% to 30%.
2. An increase in (SaO2 – SvO2) above 30% indicates a decrease in O2 delivery (i.e., usually anemia or a low cardiac output).
3. An increase in (SaO2 – SvO2) that approaches 50% indicates either threatened or inadequate tissue oxygenation.
4. A decrease in (SaO2 – SvO2) below 20% indicates a defect in O2 utilization in tissues, which is usually the result of inflammatory cell injury in severe sepsis or septic shock.
When the SaO2 approaches 100%, O2 extraction can be monitored using only the SvO2, as described next.
Venous Oxygen Saturation
The modified Fick equation for VO2 (i.e., equation 10.10) can be modified again so the derived variable is the mixed venous O2 saturation (SvO2). This results in the following equation, which identifies the determinants of SvO2.
 (10.17)
If arterial blood is fully oxygenated (SaO2 = 1), the denominator in the parentheses is equivalent to the DO2, and the equation can be rewritten as:
 (10.18)
This equation predicts that the SvO2 will vary inversely (i.e., in the opposite direction) with changes in O2 extraction (VO2/DO2).
Monitoring the SvO2
The SvO2 is ideally measured in mixed venous blood in the pulmonary arteries, which requires a pulmonary artery catheter. The SvO2 can be measured periodically in blood samples withdrawn through the PA catheter, or it can be monitored continuously using fiberoptic PA cath-eters. (The measurement of SvO2 with fiberoptic catheters is described in Chapter 21). The normal range for SvO2 in pulmonary artery blood is 65% to 75% (18). Continuous SvO2 monitoring is associated with spontaneous fluctuations that average 5% but can be as high as 20% (19). A change in SvO2 must exceed 5% and persist for longer than 10 minutes to be considered a significant change (20).
The following rules for interpreting the SvO2 are based on the relationships in equations 10.16 and 10.18, and are similar in principle to the rules for interpreting the (SaO2 – SvO2) described earlier.
1. The normal SvO2 is 65–75%.
2. A decrease in SvO2 below 65% indicates a decrease in O2 delivery (i.e., usually anemia or a low cardiac output).
3. A decrease in SvO2 that approaches 50% indicates either threatened or inadequate tissue oxygenation.
4. An increase in SvO2 above 75% indicates a defect in O2 utilization in tissues, which is usually the result of inflammatory cell injury in severe sepsis or septic shock.
Central Venous O2 Saturation
The O2 saturation in the superior vena cava, known as the “central ven-ous” O2 saturation (ScvO2), has been proposed as an alternative to the mixed venous O2 saturation (SvO2) because it eliminates the need for a PA catheter. However, the ScvO2 is higher than the SvO2 by an average of 7±4% (absolute difference) in critically ill patients (18,21). Discrepancies in the two measurements are greatest in patients with heart failure, cardiogenic shock, and sepsis. The higher ScvO2 in low output states is attributed to peripheral vasoconstriction with preservation of cerebral blood flow, and the higher ScvO2 in sepsis is attributed to an increase in splanchnic O2 consumption (21).
Despite this discrepancy, changes in ScvO2 generally mirror those in the SvO2 (21), and trends in the ScvO2 are considered more informative than individual measurements (22). The normal range of ScvO2 in one study was preselected at 70% to 89% (23), which is consistent with the use of an ScvO2 >70% as one of the early goals of management in patients with severe sepsis or septic shock (24).
The ScvO2 is monitored with central venous catheters, but the tip of the catheter must be in the superior vena cava. Periodic measurements of ScvO2 can be obtained in blood samples withdrawn through the catheter, or the ScvO2 can be monitored continuously using specially designed fiberoptic catheters (PreSep Catheters, Edwards Life Sciences, Irvine, CA). The criteria for a significant change in ScvO2 are the same as those mentioned for SvO2.
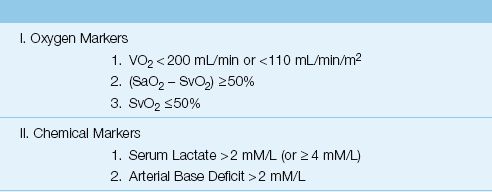
A summary of the oxygen-related measurements that can be used as markers of impaired tissue oxygenation is shown in Table 10.4. The value of the O2-related markers is enhanced if they are used in combination with the chemical markers described next.
Table 10.4 Markers of Inadequate Tissue Oxygenation
CHEMICAL MARKERS
The serum lactate level and arterial base deficit are readily available measurements that have both diagnostic and prognostic value. The lactate level is the superior measurement, as will be shown.
Lactate
(Note: There are several conditions that elevate blood lactate levels without an associated derangement in tissue oxygenation, and these are described in Chapter 32. The following description pertains only to conditions where elevated lactate levels are associated with abnormalities in O2 availability or O2 utilization in tissues.)
Lactate is well suited for the detection of anaerobic conditions because it is the end-product of anaerobic glycolysis. (The end-product is actually lactic acid, a weak acid that promptly dissociates to form lactate.) One possible drawback is the negative charge of the lactate molecule, which will hinder movement through cell membranes and could delay the appearance of lactate in the blood. This is consistent with the observations in Figure 10.4, which shows a delay of several hours from the first evidence of anaerobic metabolism (low VO2) to the first evidence of an elevated blood lactate level.
Lactate in Blood
Lactate production is the major end-point of metabolism in erythrocytes (because they have no mitochondria), and circulating erythrocytes are second only to skeletal muscle in the daily production of lactate (25). Lactate production in erythrocytes does not, however, create a difference in lactate concentration between whole blood and plasma (26). Activa-ted neutrophils are a significant source of lactate production in inflammatory conditions like the acute respiratory distress syndrome (de-scribed in Chapter 23), but lactate release from lung inflammation does not create a difference in lactate levels between venous and arterial blood (25). Therefore, lactate levels can be measured in plasma, whole blood, venous blood, or arterial blood, with similar results. The normal lactate concentration in blood is ≤2 mmol/L, but lactate levels above 4 mM/L have more prognostic value, as described next.
Prognostic Value
The serum lactate level is more than a diagnostic tool because it has prognostic implications as well. Studies in critically ill patients have shown that the probability of survival is related to the initial lactate level (prior to treatment), and to the time required for an elevated lactate to return to normal (lactate clearance). This is shown in Figure 10.6.
INITIAL LACTATE LEVEL: The graph on the left in Figure 10.6 is from a study involving septic patients (28) that shows an increase in the in-hospital mortality rate as the initial serum lactate level increases to above 2 mmol/L. Also shown is a dramatic increase in mortality rate in the first 3 days (as indicated by the horizontal lines in each column) when the initial lactate level is ≥4 mM/L. This is consistent with other studies (25,26) showing that an initial lactate level ≥4 mM/L indicates a significant risk of a fatal outcome during the ICU stay.
LACTATE CLEARANCE: The graph on the right in Figure 10.6 is from a study that included serial measurements of serum lactate in a group of hemodynamically unstable patients with elevated lactate levels (29). The lowest mortality rate occurred when lactate levels normalized within 24 hours, and the mortality rate increased dramatically when lactate levels did not normalize within 48 hours . This relationship between the rate of lactate clearance and the mortality rate has been observed in several studies (25,27,29,30), and occurs predominantly in patients with severe sepsis and septic shock. The rate of lactate clearance in these patients has greater prognostic value than the initial lactate level (25, 30). Lactate clearance can be incorporated into the early goals of management in patients with severe sepsis and septic shock (which are described in Chapter 14) because of the observation that a lactate clearance >10% in the first 6 hours after diagnosis is associated with improved survival (30).
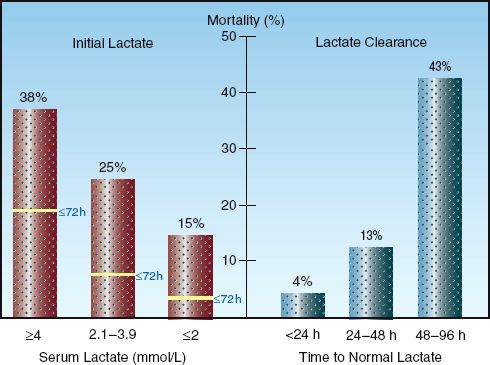
FIGURE 10.6 Graphs showing the prognostic value of monitoring serum lactate levels. Graph on the left (from Reference 28) shows the association between initial lactate levels and in-hospital mortality rate, including the mortality rate in the first 3 days after the initial lactate. Graph on the right (from Reference 29) shows the association between the time for lactate levels to normalize (lactate clearance) and in-hospital mortality rate.
Lactate in Sepsis
Lactate accumulation in sepsis is not the result of an inadequate supply of O2, but instead appears to be related to the accumulation of pyruvate as a result of inhibition of pyruvate dehydrogenase (the enzyme that converts pyruvate to acetyl coenzyme A and moves glycolysis from the cytoplasm to the Krebs cycle in mitochondria) (31). Endotoxin and other components of bacterial cell walls have been implicated in the inhibition of this enzyme (31). This mechanism of lactate accumulation is consistent with the notion that a defect in O2 utilization in mitochondria (i.e., cytopathic hypoxia) is the cause of cell injury in severe sepsis and septic shock (7), as mentioned earlier. The notion that tissue O2 levels are not deficient in patients with severe sepsis and septic shock has important implications for the management of these patients (which is described in Chapter 14).
Lactate as an Adaptive Fuel
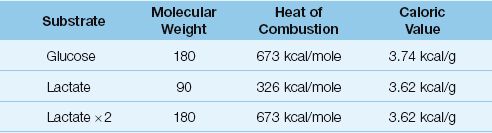
The association of elevated serum lactate levels with poor outcomes has created a perception that the lactate molecule has deleterious effects. This is unproven, and it is possible that lactate may have a beneficial role as an “adaptive fuel” in critically ill patients (32). The energy yield from the oxidative metabolism of lactate is equivalent to that of glucose, as shown in Table 10.5. The caloric density (kcal/g) of lactate and glucose are equivalent and, since one glucose molecule produces 2 lactate molecules, the energy yield from the complete oxidation (kcal/mole) of lactate and glucose are equivalent. There is evidence that lactate oxidation in the heart is increased in patients with septic shock (33), and evidence that lactate oxidation is an important source of energy in neuronal tissue subjected to hypoxia and ischemia (34). Therefore, it is possible that lactate is more friend than foe in critically ill patients.
Table 10.5 Glucose vs. Lactate as Oxidative Fuels
Arterial Base Deficit
The “base deficit” is considered a more specific marker of metabolic acidosis than the serum bicarbonate (35), and is defined as the amount (in millimoles) of base that must be added to one liter of blood to raise the pH to 7.40 (at a PCO2 of 40 mm Hg). Most blood gas analyzers determine the base deficit routinely using a PCO2/HCO3 nomogram, and the re-sults are included in the blood gas report. The normal arterial base deficit is ≤2 mmol/L; increases above 2 mmol/L are classified as mild (2 to 5 mmol/L), moderate (6 to 14 mmol/L), and severe (≥15 mmol/L).
Arterial base deficit has been a popular marker of impaired tissue oxygenation in acute surgical emergencies, especially trauma. Studies in trauma victims show a correlation between the magnitude of acute blood loss and the magnitude of elevation in arterial base deficit (36), and acute trauma resuscitation that normalizes the arterial base deficit within hours is associated with a favorable outcome (36). Based on these observations, normalization of the arterial base deficit is one of the end-points of trauma resuscitation (37).
Base Excess vs. Lactate
When used as a marker of tissue oxygenation, the arterial base deficit is a surrogate measure of serum lactate levels. However, base deficit is not specific for lactate because it is influenced by other causes of metabolic acidosis (e.g., ketosis, renal insufficiency). In one study comparing base deficit and lactate levels in patients admitted to a surgical ICU (38), both were similar in predictive value on admission, but lactate was superior to base deficit for predicting outcome when serial measurements of both were followed after ICU admission. This observation, combined with the lack of specificity of arterial base deficit as a measure of lactate, indicates that the arterial base deficit offers no advantages over blood lactate levels in the evaluation of tissue oxygenation.
NEAR INFRARED SPECTROSCOPY
Near infrared spectroscopy (NIRS) is a noninvasive method of measuring the venous O2 saturation in tissues using the optical properties of hemoglobin in the oxygenated (HbO2) and dexoxygenated (Hb) state. This is described in Chapter 21 in relation to pulse oximetry. NIRS is essentially tissue oximetry without the “pulse” component. A light source is placed on the skin that emits light with wavelengths specific for HbO2 (990 nm) and Hb (660 nm), and the light of each wavelength that is reflected back from the underlying tissues (subcutaneous tissue and muscle) is picked up by a photodetector and processed to display the tissue O2 saturation (StO2):
 (10.19)
The StO2 includes the O2 saturation in arteries, capillaries, and veins within the tissue, but most of the blood in tissues (70–75%) is in veins, so the StO2 is assumed to be a measure of the venous O2 saturation in the underlying tissue, which is then used as a measure of the balance between O2 delivery and O2 consumption in that tissue (i.e., equation 10.18 for tissues instead of the whole body). It has been used mostly in the brain and skeletal muscle (39), and is not without problems; e.g., several other factors can influence StO2, such as skin color, tissue thickness and composition, and myoglobin (for muscle), and a few studies indicate 50% to 100% of the NIRS signal from skeletal muscle is from myoglobin (40). This is one of the problems with NIRS; i.e., you are not sure what is being measured.
Cytochrome Oxidase
The most exciting feature of NIRS is the potential to monitor mitochondrial O2 consumption (41). This is possible because of the optical properties of cytochrome oxidase, the enzyme responsible for converting O2 to water at the end of the electron transport chain. Cytocrome oxidase (CytOx) is the “waste disposal unit” of the electron transport chain; i.e., it receives electrons that have been “spent” producing ATP, and disposes of these electrons by donating them to oxygen (4 electrons per O2 molecule). This reduces O2 to water, and is responsible for about 90% of cellular O2 consumption.
 (10.20)
The loss of electrons converts CytOx from a reduced to an oxidized state. In a steadystate condition, CytOx is a balance of oxidized and reduced forms, and it absorbs light at 830 nm in this balanced redox state. This absorption band is lost when CytOx is in the reduced form, which occurs when CytOx is no longer donating electrons to O2 (and mitochondrial O2 consumption therefore ceases). Thus, the presence or absence of the 830 nm absorption band is a potential marker for the presence or absence of mitochondrial ATP production.
Unfortunately, cytochrome oxidase is present in miniscule amounts compared to hemoglobin, and this makes it difficult to detect the absorption band. The absence of an 830 nm absorption band could mean either CytOx is in the reduced state (and metabolism is anaerobic) or you can’t pick up the signal from CytOx in a balanced redox state (and metabolism is aerobic). Once again, understanding what you are monitoring can be problematic with NIRS.
I was first introduced to NIRS in the mid-1970s (in the laboratory of Britton Chance, who discovered cytochrome oxidase), and in the almost-40 years since that time, NIRS has always been an exciting but unrealized technology. The next few years will probably be more of the same.
A FINAL WORD
The importance of monitoring systemic or tissue oxygenation is based on the premise that inadequate tissue oxygenation is responsible for cell in-jury, multiorgan failure, and fatal outcomes in critically ill patients. This premise is difficult to evaluate because of the inability to directly measure tissue O2 levels. Increased serum lactate levels have been used as evidence of inadequate tissue oxygenation in critically ill patients, but the elevated lactate levels in septic shock are not the result of limited O2 availability in tissues (31), as described earlier in the chapter. In fact, the consensus opinion is that inflammatory cell injury is the culprit responsible for multiorgan failure and fatal outcomes in septic shock (see Chapter 14). Since septic shock is the leading cause of death in ICUs, it seems that inadequate tissue oxygenation is not as important as we think it is in critically ill patients. This, of course, has obvious implications for the current emphasis on promoting tissue oxygenation in critical care management.
REFERENCES
Oxygen in Blood
1. Nunn JF. Oxygen. In Nunn’s Applied Respiratory Physiology. 4th ed. London: Butterworth-Heinemann Ltd, 1993:247–305.
2. McConn R, Derrick JB. The respiratory function of blood: transfusion and blood storage. Anesthesiology 1972; 36:119–127.
3. Zander R. Calculation of oxygen concentration. In: Zander R, Mertzlufft F, eds. The oxygen status of arterial blood. Basel: S. Karger, 1991:203–209.
4. Christoforides C, Laasberg L, Hedley-Whyte J. Effect of temperature on solubility of O2 in plasma. J. Appl Physiol 1969; 26:56–60.
Systemic Oxygen Balance
5. Connett RJ, Honig CR, Gayeski TEJ, Brooks GA. Defining hypoxia: a systems view of VO2, glycolysis, energetics, and intracellular PO2. J Appl Physiol 1990; 68:833–842.
6. Loiacono LA, Shapiro DS. Detection of hypoxia at the cellular level. Crit Care Clin 2010; 26:409–421.
7. Fink MP. Cytopathic hypoxia. Mitochondrial dysfunction as a mechanism contributing to organ dysfunction in sepsis. Crit Care Clin 2001; 17:219–237.
8. Mohammed I, Phillips C. Techniques for determining cardiac output in the intensive care unit. Crit Care Clin 2010; 26:353–364.
9. Hameed SM, Aird WC, Cohn SM. Oxygen delivery. Crit Care Med 2003; 31(Suppl): S658–S667.
10. Schneeweiss B, Druml W, Graninger W, et al. Assessment of oxygen-consumption by use of reverse Fick-principle and indirect calorimetry in critically ill patients. Clin Nutr 1989; 8:89–93.
11. Sasse SA, Chen PA, Berry RB, et al. Variability of cardiac output over time in medical intensive care unit patients. Chest 1994; 22:225–232.
12. Bartlett RH, Dechert RE. Oxygen kinetics: Pitfalls in clinical research. J Crit Care 1990; 5:77–80.
13. Nunn JF. Non respiratory functions of the lung. In: Nunn JF (ed). Applied Respiratory Physiology. Butterworth, London, 1993:306–317.
14. Jolliet P, Thorens JB, Nicod L, et al. Relationship between pulmonary oxygen consumption, lung inflammation, and calculated venous admixture in pa-tients with acute lung injury. Intensive Care Med 1996; 22:277–285.
15. Dunham CM, Seigel JH, Weireter L, et al. Oxygen debt and metabolic acid-emia as quantitative predictors of mortality and the severity of the ischemic insult in hemorrhagic shock. Crit Care Med 1991; 19:231–243.
16. Shoemaker WC, Appel PL, Krom HB. Role of oxygen debt in the development of organ failure, sepsis, and death in high-risk surgical patients. Chest 1992; 102:208–215.
17. Leach RM, Treacher DF. The relationship between oxygen delivery and consumption. Disease-a-Month 1994; 30:301–368.
18. Maddirala S, Khan A. Optimizing hemodynamic support in septic shock using central venous and mixed venous oxygen saturation. Crit Care Clin 2010; 26:323–333.
19. Noll ML, Fountain RL, Duncan CA, et al. Fluctuations in mixed venous oxygen saturation in critically ill medical patients: a pilot study. Am J Crit Care 1992; 3:102–106.
20. Krafft P, Stelzer H, Heismay M, et al. Mixed venous oxygen saturation in critically ill septic shock patients. Chest 1993; 103:900–906.
21. Reinhart K, Kuhn H-J, Hartog C, Bredle DL. Continuous central venous and pulmonary artery oxygen saturation monitoring in the critically ill. Intensive Care Med 2004; 30:1572–1578.
22. Dueck MH, Kilmek M, Appenrodt S, et al. Trends but not individual values of central venous oxygen saturation agree with mixed venous oxygen saturation during varying hemodynamic conditions. Anesthesiology 2005; 103:249–257.
23. Pope JV, Jones AE, Gaieski DF, et al. Multicenter study of central venous oxygen saturation (ScvO2) as a predictor of mortality in patients with sepsis. Ann Emerg Med 2010; 55:40–46.
24. Dellinger RP, Levy MM, Carlet JM, et al. Surviving sepsis campaign: international guidelines for management of severe sepsis and septic shock: 2008. Crit Care Med 2008; 36:296–327.
Chemical Markers
25. Okorie ON, Dellinger P. Lactate: biomarker and potential therapeutic target. Crit Care Clin 2011; 27:299–326.
26. Aduen J, Bernstein WK, Khastgir T, et al. The use and clinical importance of a substrate-specific electrode for rapid determination of blood lactate concentrations. JAMA 1994; 272:1678–1685.
27. Vernon C, LeTourneau JL. Lactic acidosis: recognition, kinetics, and associated prognosis. Crit Care Clin 2010; 26:255–283.
28. Trzeciak S, Dellinger RP, Chansky ME, et al. Serum lactate as a predictor of mortality in patients with infection. Intensive Care Med 2007; 33:970–977.
29. McNelis J, Marini CP, Jurkiewicz A, et al. Prolonged lactate clearance is associated with increased mortality in the surgical intensive care unit. Am J Surg 2001; 182:481–485.
30. Nguyen HB, Rivers EP, Knoblich BP, et al. Early lactate clearance is associated with improved outcome in severe sepsis and septic shock. Crit Care Med 2004; 32:1637–1642.
31. Thomas GW, Mains CW, Slone DS, et al. Potential dysregulation of the pyruvate dehydrogenase complex by bacterial toxins and insulin. J Trauma 2009; 67:628–633.
32. Gladden LB. Lactate metabolism: a new paradigm for the third millenium. J Physiol 2004; 558.1:5–30.
33. Dhainaut J-F, Huyghebaert M-F, Monsallier JF, et al. Coronary hemodynamics and myocardial metabolism of lactate, free fatty acids, glucose, and ketones in patients with septic shock. Circulation 1987; 75:533–541.
34. Schurr A. Lactate, glucose, and energy metabolism in the ischemic brain. Int J Mol Med 2002; 10:131–136.
35. Severinghaus JW. Case for standard-base excess as the measure of non-respiratory acid-base imbalance. J Clin Monit 1991; 7:276–277.
36. Davis JW, Shackford SR, Mackersie RC, Hoyt DB. Base deficit as a guide to volume resuscitation. J Trauma 1998; 28:1464–1467.
37. Tisherman SA, Barie P, Bokhari F, et al. Clinical practice guideline: endpoints of resuscitation. J Trauma 57:898–912.
38. Martin MJ, Fitzsullivan E, Salim A, et al. Discordance between lactate and base deficit in the surgical intensive care unit: which one do you trust? Am J Surg 2006; 191:625–630.
Near Infrared Spectroscopy
39. Boushel R, Piantadosi CA. Near-infrared spectroscopy for monitoring muscle oxygenation. Acta Physiol Scandinav 2000; 168:615–622.
40. Ward KR, Ivatury RR, Barbee RW, et al. Near infrared spectroscopy for evaluation of the trauma patient: a technological review. Resuscitation 2006; 27–64.
41. Cooper CE, Springett R. Measurement of cytochrome oxidase and mitochondrial energetics by near-infrared spectroscopy. Phil Trans R Soc Lond 1997; 352:669–676.


Stay updated, free articles. Join our Telegram channel

Full access? Get Clinical Tree


