Weaning from Mechanical Ventilation: Introduction
Thirty years ago, the weaning of patients from the ventilator was relegated to nurses and respiratory therapists. It aroused little interest among physicians. It certainly wasn’t thought worthy of serious scientific inquiry. All this has changed. No other area of critical care has undergone so great a transformation. But the illumination has also cast shadows. In particular, discussion of weaning is now bedeviled by imprecise language. This can be seen as just deserts insofar as few clinicians use the term weaning in the strict literal sense—a gradual reduction in the level of ventilator support. Instead, most patients today are taken off the ventilator cold turkey. It would be fine if the confused language stopped there. But this is only one small example of how fundamental scientific misunderstanding has arisen from imprecise word choices.
Under the cloak of imprecise language, much muddled thinking, flawed logic, and misinterpretation has crept into the field. These language problems are not just pedantic quirks. Instead, they impede the rigor of research in this area, as well as interpretation of the findings. Communication is also hindered by the lumping together of many distinct components of this complex process. To enhance clarity, we divide weaning into seven stages.
Seven Stages of Weaning
We divide weaning into seven stages to draw attention to areas that receive minimal attention (Fig. 58-1). Stage 1 is preweaning, when no attempt at weaning is desirable. For example, when a patient is receiving 80% oxygen and positive end-expiratory pressure (PEEP) of 15 cm H2O, performing any disconnect from the ventilator (for measurement of weaning predictors) is inappropriate and may even be dangerous. Every ventilated patient begins at stage 1, and some patients never get beyond that stage. For example, in a prospective study of 249 ventilated patients,1 sixty-five patients (26%) died during mechanical ventilation without any attempt at weaning. In another report of 357 patients entered into a trial of weaning techniques,2 12.9% never reached the stage of any active weaning attempt. We identify this preweaning stage to emphasize the importance of the transition between it and the next stage of a patient’s clinical course.
Figure 58-1
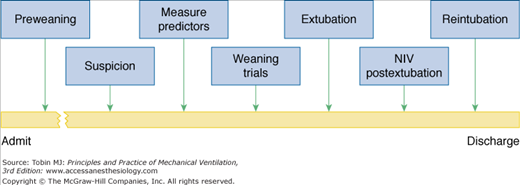
Seven stages of weaning. Stage 1 is preweaning, a stage that many patients never get beyond. Stage 2 is the period of diagnostic triggering, the time when a physician begins to think that the patient might be ready come off the ventilator. Stage 3 is the time of measuring and interpreting weaning predictors. Stage 4 is the time of decreasing ventilator support (abruptly or gradually). Stage 5 is either extubation (of a weaning-success patient) or reinstitution of mechanical ventilation (in a weaning-failure patient). Stage 6 is use of noninvasive ventilation after extubation. Stage 7 is reintubation. Failure to appreciate stage 2 probably leads to the greatest delays in weaning.
Stage 2 is the period during which the clinician contemplates the possibility that the patient is ready for weaning. This statement may seem obvious to the point of banality. But the point at which this thought first enters the mind of a physician managing a complex patient is not so straightforward. In such a patient, the key act is for a physician to think that the patient just might come off the ventilator successfully. Except for self-extubations, this decision is not made by the patient. The idea has to begin in the doctor’s brain. Several large studies have documented that many patients are ventilated for a week or more and the ventilator is then successfully discontinued on the first day that weaning predictor tests are measured.3,4 A physician has to ask himself or herself whether the patient might have tolerated extubation a day or so earlier. Failure to recognize this second stage may be the greatest obstacle to expeditious weaning.
Psychologists have undertaken extensive research into how probabilistic reasoning is employed in making decisions, investigating how people perceive, process, and evaluate the probabilities of uncertain events.5–7 Studies have clarified how interactions between the demands of a task and the limitations of a thinker negatively impact cognitive processes. Research on inferences that involve a sequence of steps has revealed that people make wrong decisions because they are more confident in their judgments (such as deciding that a patient is not ready for a T-tube trial) than is validly justified by the data on which the decisions are based.5
In his recently published book, Thinking, Fast and Slow, the Nobel laureate, Daniel Kahneman, brings together the voluminous research conducted by his group and other investigators on human decision making over the past five decades.7 Kahneman presents human thinking as involving two independent systems. System One is amazingly fast, intuitive, and effort-free—but prone to error. System Two is the slow process of forming judgments based on conscious thinking and deductive reasoning. To activate System Two requires mental effort and hard work. Consequently, people turn to System One for most decisions. One of the discoveries cited by the Nobel committee was Kahneman’s demonstration that overreliance on simple “seat-of-the-pants” decisions (characteristic of System One) can lead to large systematic errors, which have serious and persistent consequences.6,7 An example of a System One error in ventilator weaning is a clinician’s intuition that a patient is not ready for a T-tube trial. Another System One error pertinent to weaning, and highlighted by Kahneman’s research, is a clinician’s failure to pay close attention to prior probability (Bayesian reasoning)—a failure that leads to major errors in decision making.6 When taking care of a ventilator-supported patient, physicians should be mindful of these cognitive processes and employ compensatory tactics such as the use of screening tests to spot a patient’s readiness for weaning. By alerting an unsuspecting physician to a patient’s readiness to tolerate unassisted ventilation—hours or days before he or she would otherwise order a spontaneous breathing trial—weaning-predictor tests circumvent the cognitive errors inherent in clinical decision making.8
Stage 3 is the time of obtaining physiologic measurements that serve as predictors, and interpreting the data appropriately in the context of each patient’s unique clinical condition. The critical word here is interpretation. It is imperative to be clear about why these predictor tests are being performed, the influence of a patient’s preexisting condition on the interpretation of the results, what action to take based on the results, and when it is prudent to adjust the thresholds for taking action. These points may seem self-evident, but the literature is replete with evidence of cloudy thinking on each point.
Stage 4 is to decrease ventilator support. Support is either removed abruptly and completely (T-tube trial) or gradually decreased over hours or days. Stage 5 is extubation of a patient who tolerated stage 4 or reinstitution of mechanical ventilation in a patient who failed the weaning trial. Stage 6 is continued ventilator support after extubation using noninvasive ventilation; this stage applies to only a minority of patients. Stage 7 is reintubation, usually accompanied by the reinstitution of mechanical ventilation.
Pathophysiology of Weaning Failure
Over the last 20 years, understanding of the mechanisms that cause patients to fail their first attempt to recommence spontaneous breathing has increased considerably. Advances in this aspect of weaning research have been enormously greater than change in clinical management. Greater understanding of pathophysiology has led to new approaches to the timing of the weaning process, prediction of outcome, and techniques used for weaning. Delineation of pathophysiologic principles led to the undertaking of clinical trials. The trials, in contrast, have contributed little to our understanding of the pathophysiology of weaning failure.
Research on pathophysiology has been limited to failure of attempts at spontaneous breathing when a still-intubated patient is first disconnected from the ventilator. Virtually no pathophysiologic research has been conducted in patients who develop acute respiratory failure in the hours immediately after extubation. Likewise, very little research has been conducted in patients who fail repeated weaning attempts, and, as a consequence, may be transferred to centers that specialize in the delivery of mechanical ventilation in the post–intensive care setting.
When intubated patients are disconnected from the ventilator and left to breathe on their own, about a fifth are unable to sustain spontaneous ventilation. If the trial is extended, these weaning failure patients will develop hypercapnia unless severe hypoxemia first intervenes. The pathophysiologic mechanisms that cause weaning failure can be divided into those occurring at the level of control of breathing, mechanics of the lung and chest wall, the respiratory muscles, the cardiovascular system, and gas-exchange properties of the lung.
The physiologic processes that fall under the heading of control of breathing primarily include afferent and efferent signals, and the processing of these signals in the brainstem. Clinical research on control of breathing has primarily focused on the overall level of respiratory motor output, termed respiratory drive. In human research, it is not realistic to obtain electrode recordings from the respiratory centers, and it is extremely difficult to measure phrenic nerve traffic. Consequently, a number of indirect methods have been used to assess respiratory drive. Measurement of the ventilatory response to hypercapnia or hypoxia is used in ambulatory patients, but difficult to apply in weaning failure patients. Electromyographic (EMG) recordings from the diaphragm reflect phrenic nerve traffic, but are difficult to standardize among patients.
Most data on respiratory drive in weaning failure patients has been obtained with two techniques: the airway occlusion method (P0.1) and mean inspiratory flow (VT/TI) of breathing pattern analysis. In a spontaneously breathing patient, it is not possible to measure P0.1 on every breath or even at frequent intervals. If P0.1 is measured repeatedly, the act of measurement will alter respiratory drive.9 As such, continuous measurements of respiratory drive over the evolution of weaning failure have been limited to VT/TI. VT/TI suffers from the limitation that oral airflow is far removed from the brainstem. Any intervening impediment, such as abnormal lung mechanics, can cause a decrease in VT/TI. Thus, there is always the possibility that VT/TI is providing an underestimate of respiratory drive. An advantage, however, of breathing pattern analysis over other methods of measuring respiratory drive is that it also provides information on respiratory timing.
Tobin et al10 studied seventeen patients who underwent a T-tube trial of weaning. Seven patients developed severe distress, and arterial carbon dioxide tension (PaCO2) rose from 42 to 56 mm Hg, and pH fell from 7.43 to 7.35. Between the beginning and end of the trial, which lasted 40 ± 11 minutes, the patients developed an increase in VT/TI: 265 ± 27 to 328 ± 32 mL/s. These findings were surprising. At that time, it was expected that acute hypoventilation—the physiologic terminology for an increase in PaCO2—would have been accompanied by a decrease in drive. Yet, not one patient had a value of VT/TI below the 95% confidence limits of normal subjects. Although VT/TI was not depressed in the weaning failure patients, it was not higher than in the weaning success patients. Subsequent studies, using P0.1, revealed that respiratory drive is higher in weaning failure patients than in weaning success patients.11–15
The patients also showed marked changes in respiratory timing (Fig. 58-2). Upon resumption of spontaneous breathing, the weaning-failure patients exhibited immediate and marked shortening of inspiratory time (TI): 0.81 ± 0.11 versus 1.41 ± 0.27 seconds in weaning-success patients. Within the respiratory centers, expiratory time (TE) is strongly coupled to TI. Consequently, TE was also shorter in the weaning-failure patients than in the weaning-success patients: 1.24 ± 0.27 versus 2.48 ± 0.47 seconds. The combined changes in TI and TE led to a marked increase in respiratory frequency (f): 32.3 ± 2.3 versus 20.9 ± 2.8 breaths/min. Because the rate of inspiratory flow (VT/TI) was equivalent in the two patient groups, the short TI resulted in a lower tidal volume (VT) in the weaning-failure patients: 194 ± 23 versus 398 ± 56 mL. The decrease in VT was balanced by the increase in f, and thus minute ventilation ( ) was equivalent in the two groups. A decrease in VT without an increase in
  must result in higher overall dead space ventilation (VD/VT). Indeed, the combined changes in VT and f accounted for 81% of the increase in PaCO2 observed in the weaning-failure patients. From the above discussion, it is evident that the fundamental abnormality in control of breathing in weaning failure is a shortening of TI.
Figure 58-2
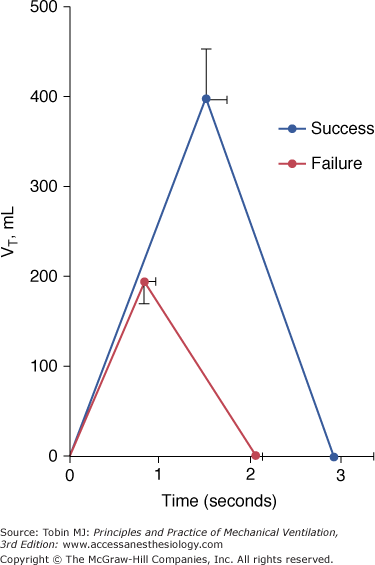
The mean respiratory cycle during spontaneous breathing in seven weaning-failure and ten weaning-success patients. The early termination of inspiratory time in the weaning-failure patients leads to a decrease in tidal volume (VT). The decrease in inspiratory time, coupled with a decrease in expiratory time, results in a faster respiratory frequency. Bars represent 1 standard error (SE). (Used, with permission, from Tobin et al.10)
Several groups of investigators have shown that the combination of increased f and low VT is a characteristic abnormality in weaning-failure patients. Vassilakopoulos et al16 studied thirty patients at two points in time. Measurements were first obtained shortly after the patients failed a T-tube trial. Measurements were repeated approximately 9 days later, shortly before the patients were successfully extubated. The investigators found that an index of rapid shallow breathing, frequency-to-tidal-volume ratio (f/VT), was lower in weaning failure than in weaning-success patients: 62 ± 21 versus 98 ± 38. They obtained additional detailed measurements of lung mechanics and respiratory muscle function, and found that only two variables, tension–time index and f/VT, were significant determinants of weaning failure.
Research indicates that most weaning-failure patients develop an increase in respiratory drive as they experience progressive ventilatory failure. Clinical experience, however, suggests that at least some patients have depressed respiratory drive. Jubran and Tobin15 observed that two of seventeen (11.8%) weaning-failure patients developed PaCO2 values of greater than 70 mm Hg during a T-tube trial, and yet detailed measurements of their lung mechanics and respiratory muscle function were within the range of the weaning-success patients. These limited data suggest that perhaps 10% of patients who develop hypercapnia during a failed weaning trial may do so primarily because of respiratory center depression.
Physiologic variables for quantifying lung mechanics can be grouped under three major headings: resistance, elastance, and gas trapping. The most detailed data on respiratory mechanics in patients being weaned from mechanical ventilation comes from a study by Jubran and Tobin of thirty-one patients with chronic obstructive pulmonary disease (COPD) undergoing a weaning trial.17 Over the course of a trial of spontaneous breathing lasting 45 ± 8 minutes, seventeen patients developed acute distress and an increase in (from 45 to 58 mm Hg), requiring the reinstitution of mechanical ventilation. The remaining fourteen patients tolerated the trial and were successfully extubated; these served as a control group.
At the start of the trial, inspiratory lung resistance was equivalent in the weaning-failure and weaning-success patients: 9.0 ± 1.7 versus 5.3 ± 1.1 cm H2O/L/s (Fig. 58-3).17 By the end of the trial, resistance increased to 14.8 ± 2.0 cm H2O/L/s in the failure patients, but it did not change in the success patients. Four factors may account for the increase in resistance: (a) an increase in inspiratory flow (unlikely because the increase in flow was no higher in failure patients than in success patients); (b) a decrease in lung volume (unlikely because most patients also develop gas trapping); (c) accumulation of secretions (unlikely because all patients had been suctioned before the trial, and secretions were no different in the two groups); and (d) bronchoconstriction. Bronchoconstriction appears to be the most likely explanation in that patients with COPD have heightened airway reactivity—although it is not clear why this should be greater in weaning-failure than in weaning-success patients.
Figure 58-3
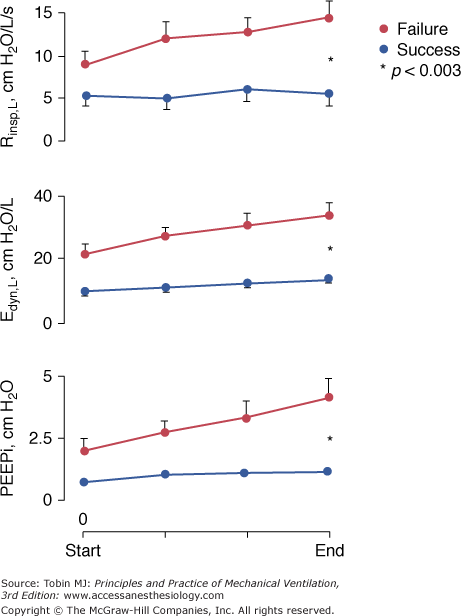
Inspiratory resistance of the lung (Rinsp,L), dynamic lung elastance (Edyn,L), and intrinsic positive end-expiratory pressure (PEEPi) in seventeen weaning-failure patients and fourteen weaning-success patients. Data displayed were obtained during the second and last minute of a T-tube trial, and at one-third and two-thirds of the trial duration. Between the onset and end of the trial, the failure group developed increases in Rinsp,L (p <0.009), Edyn,L (p <0.0001), and PEEPi (p <0.0001) and the success group developed increases in Edyn,L (p <0.006) and PEEPi (p <0.02). Over the course of the trial, the failure group had higher values of Rinsp,L (p <0.003), Edyn,L (p <0.006), and PEEPi (p <0.009) than the success group. (Used, with permission, from Jubran and Tobin.17)
Dynamic lung elastance was higher in weaning-failure patients than in weaning-success patients at the start of the trial: 21.2 ± 3.4 versus 9.9 ± 1.7 cm H2O/L (see Fig. 58-3).17 At the end of the trial, elastance increased to 34.1 ± 4.0 cm H2O/L in the failure patients and to 14.0 ± 2.0 cm H2O/L in the success patients. The elevated elastance at the start of the trial was probably secondary to frequency dependence of elastance. Three factors may account for the increase in elastance over the course of the trial: (a) dynamic hyperinflation (this possibility is supported by a twofold increase in intrinsic PEEP [PEEPi] by the end of the trial); (b) development of subclinical pulmonary edema secondary to increased left ventricular afterload; and (c) microatelectasis (a possibility supported by the marked decrease in VT).
PEEPi, an indirect measure of gas trapping, was higher in the failure patients than in the success patients at the onset of the trial: 2.0 ± 0.5 versus 0.7 ± 0.1 cm H2O. By the end of the trial, PEEPi increased to 4.1 ± 0.8 cm H2O in the failure patients and to 1.1 ± 0.2 cm H2O in the success patients (see Fig. 58-3).17
Jubran and Tobin did not partition total PEEPi into the component resulting from expiratory muscle contraction and that resulting from an increase in end-expiratory lung volume. This information was subsequently obtained by the same group of investigators,18 who partitioned total PEEPi into that resulting from expiratory muscle contraction (abdominal muscles, expiratory rib cage muscles, or both) by calculating the rise in gastric pressure (Pga) between the onset of expiratory flow and the point of rapid decline in esophageal pressure (Pes), and the remaining portion, suggesting an increase in end-expiratory lung volume. After correcting for expiratory-muscle contribution, the remaining portion of total PEEPi increased between the start and end of the weaning trial in seven of the ten patients.18 These data suggest that many weaning-failure patients develop dynamic hyperinflation. Expiratory flow limitation19 and tachypnea, through a decrease in time available of exhalation,10 are the most likely determinants of dynamic hyperinflation. It should be recognized that it has not been possible to obtain direct measurements of end-expiratory lung volume in patients experiencing acute respiratory failure, and the use of esophageal pressure to estimate this entity is based on many assumptions.20
Other investigators have also reported a worsening of lung mechanics in weaning-failure patients. An innovative approach was employed by Vassilakopoulos et al.16 They first studied patients at the end of a T-tube trial. Then they reinstituted ventilation in the assist-control mode, sedated the patients, and hyperventilated them to abolish spontaneous respiratory muscle activity. Next they adjusted the ventilator settings to simulate a patient’s pattern of spontaneous breathing, and measured lung mechanics under passive conditions. The investigators studied the patients at two points in time: shortly after they first failed a T-tube trial, and approximately 9 days later, shortly before they were successfully extubated. Between the time of weaning failure and weaning success, airway resistance decreased from 9.6 ± 3.4 to 7.9 ± 3.3 cm H2O/L/s, static PEEPi decreased from 6.1 ± 2.5 to 3.8 ± 2.7 cm H2O, and static respiratory compliance did not change. The investigators also disconnected the patients from the ventilator (after first delivering some breaths simulating spontaneous breathing), and allowed them to exhale freely until zero expiratory flow was reached. This point was taken as the elastic equilibrium volume of the respiratory system, and the increase in functional residual capacity secondary to gas trapping (PEEPi) was taken as the difference between inspired and expired volume. This volume was 327 ± 180 mL during weaning failure, and it fell to 213 ± 175 at the time of weaning success.
The observation that weaning-failure patients display more severely deranged lung mechanics than do weaning-success patients raises the question of whether the derangements might be detectable ever before patients reattempt spontaneous breathing (i.e., while patients are still receiving full ventilator support). Jubran and Tobin21 studied lung and chest wall mechanics of patients before the onset of a weaning trial. Inspiratory resistance was about fourteen times higher than that in healthy subjects but it was equivalent in the failure and success patients: 13.9 and 13.0 cm H2O/L/s, respectively. Static elastance of the lung and the chest wall were similar in the two groups.21 Dynamic elastance of the lung was higher in the failure patients than in the success patients, 28 ± 3 versus 17.8 ± 2 cm H2O/L, and this was the only measurement of passive mechanics that differentiated the two groups. Dynamic PEEPi during passive ventilation was equivalent in the groups. This picture contrasts with the more severely deranged mechanics in failure patients than in success patients during a weaning trial.17 The difference indicates that something in the act of spontaneous breathing, rather than an intrinsic abnormality in respiratory mechanics, is responsible for the marked difference between failure and success patients during a weaning trial.
The deterioration in lung mechanics during a failed weaning trial leads to increased work of breathing. The increased respiratory work is made manifest by greater swings in esophageal pressure (Fig. 58-4). In the study of Jubran and Tobin, pressure-time product was not different in the weaning-failure and weaning-success patients at the onset of a spontaneous breathing trial: 255 ± 59 and 158 ± 23 cm H2O*s/min (normal: 94 ± 12).17 At the end of the trial, pressure-time product increased more in the failure patients than in the success patients: 388 ± 68 versus 205 ± 25 cm H2O*s/min. The increase in effort in the failure patients resulted from worsening of all elements of respiratory mechanics. Partitioning of the increase in pressure-time product at end of the trial revealed that the fraction caused by PEEPi increased by 111%, that caused by the non-PEEPi elastic component increased by 33%, and the fraction caused by the resistive component increased by 42%.17
Figure 58-4

Ensemble average plots of flow and esophageal pressure (Pes) at the start and end of a T-tube trial in seventeen weaning-failure patients and fourteen weaning-success patients. At the start of the trial, the inspiratory excursion in Pes was greater in the failure patients, and it increased further by the end of the trial. To generate these plots, flow and Pes tracings were divided into twenty-five equal time intervals over a single respiratory cycle for each of the 5 breaths for each patient in the two groups. For a given patient, the 5 breaths from the start of the trial were then superimposed and aligned with respect to time, and the average at each time point was calculated. The group mean tracings were then generated by ensemble averaging of the individual mean from each patient. The same procedure was performed for breaths at the end of the trial. (Used, with permission, from Jubran and Tobin.17)
In sixty patients being weaned from mechanical ventilation, Jubran et al22 characterized the changes in esophageal-pressure swings over the course of a trial of spontaneous breathing (Fig. 58-5). The median time to reach ±10% of the average value of esophageal pressure during the last minute of the trial was 7.5 (interquartile range [IQR]: 4.2 to 14.8) minutes in the weaning-failure patients and 5 (IQR: 2 to 8.5) minutes in the weaning-success patients (Fig. 58-6). In contrast, f/VT, a measure of rapid shallow breathing, reached ±10% of its final average value at 2 (IQR: 1 to 2) minutes in both the weaning-success and weaning-failure patients. The more gradual and progressive increase in esophageal pressure over time may have resulted from a slow increase in partial pressure of carbon dioxide (PCO2), as commonly occurs in weaning-failure patients.10,17 The relative constancy in f/VT may be related to the increases in both inspiratory resistive and inspiratory elastic loads that occur in weaning-failure patients. These loads have opposing effects on breathing pattern. A resistive load slows respiratory frequency while preserving tidal volume, thereby producing a decrease in f/VT.23,24 In contrast, an elastic load increases respiratory frequency accompanied by a decrease in tidal volume, both of which will produce an increase in f/VT.25,26
Figure 58-5
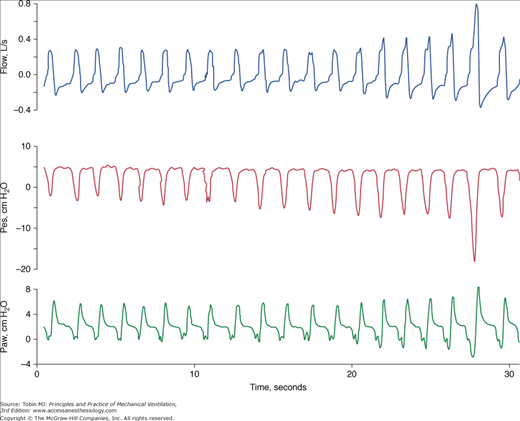
Progressive increase in inspiratory effort in a weaning-failure patient. Flow (top panel), esophageal pressure (Pes, middle panel), and airway pressure (Paw, bottom panel) in a patient who developed severe respiratory distress while receiving continuous positive airway pressure of 5 cm H2O. The patient had developed respiratory failure (requiring mechanical ventilation) after developing a pulmonary embolus subsequent to undergoing lobectomy for lung cancer. The swings in esophageal pressure became progressively more negative over the first 30 seconds of the trial.
Figure 58-6
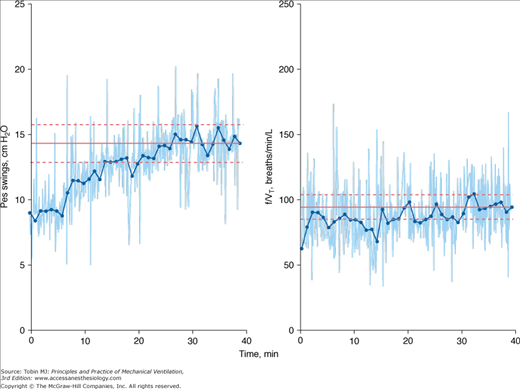
Time-series plot of swings in esophageal pressure (Pes; left panel) and frequency-to-tidal-volume ratio (f/VT; right panel) during a trial of spontaneous breathing in a weaning-failure patient. Dots represent 1-minute averages. The solid horizontal line indicates the average value of Pes swings and f/VT during the final minute of the trial. The dashed lines indicate ±10% of the final minute values for Pes swings and f/VT. The time taken to reach ±10% of the final value was 14 minutes for Pes swings and 2 minutes for f/VT. (Used, with permission, from Jubran et al.22)
Research into the mechanisms whereby abnormalities of the respiratory muscles might contribute to weaning failure has focused on inspiratory muscle strength and respiratory muscle fatigue. Muscle strength has been assessed by measuring the pressure generated during a maximal inspiratory effort against an occluded airway.27 Early investigators reported that maximal inspiratory pressure (PImax) was lower in weaning-failure patients than in weaning-success patients, but later investigators reported no difference between the two groups.14,28–31 The pattern of reporting suggests the possibility of test-referral bias, whereby patients with the lowest values of PImax were deliberately excluded from the subsequently conducted studies.32 Another consideration is the well-recognized difficulty of ensuring reliable measurements of PImax, given its total dependence on patient motivation and cooperation—an even greater challenge in critically ill patients.27 Studies using phrenic nerve stimulation, and specifically the technique of twitch interpolation, revealed that patients being weaned from mechanical ventilation typically make submaximal efforts when PImax is being measured. Moreover, Laghi et al29 found that six of nine weaning-failure patients had twitch transdiaphragmatic pressure (Pdi) values below 10 cm H2O. Healthy subjects have twitch Pdi values of 35 to 39 cm H2O, and stable patients with COPD have values of 17 to 20 cm H2O. Contrary to previous thinking, these data indicate that weaning-failure patients may have considerable muscle weakness.
For years, researchers and clinicians have believed that most if not all weaning-failure patients develop respiratory muscle fatigue by the time a failed weaning trial is stopped. This belief has been largely based on observations made by Cohen et al.33 These investigators studied twelve patients who exhibited difficulties during weaning. Seven patients developed a shift in the power spectrum of the EMG signal recorded from the diaphragm, a finding judged to signify muscle fatigue. Six of the seven patients also exhibited paradoxical motion of the abdomen (inward displacement of the abdomen during inspiration) and four exhibited respiratory alternans (phasic alternation between the contribution of the rib cage and abdominal compartments to VT). The changes in rib cage–abdominal motion were not observed in the five patients who did not develop EMG changes. The investigators concluded that respiratory muscle fatigue was a common cause of weaning failure, and that its presence could be detected by finding paradoxical motion of the abdomen.
Subsequent detailed recordings of rib cage–abdominal motion revealed that when paradoxical motion of the abdomen occurs in weaning-failure patients, it occurs immediately upon discontinuation of the ventilator and displays no progression over time.34 When quantified objectively, the extent of abdominal paradox was no greater in weaning- failure patients than in weaning-success patients. In studies of healthy volunteers, fatigue was found to be neither necessary nor sufficient to induce abnormal rib cage–abdominal motion.35 These data indicated that rib cage–abdominal motion could not be used for detecting respiratory muscle fatigue. The studies, however, did not exclude the possibility that fatigue is common in weaning-failure patients.
Investigators also evaluated a more complex measure of fatigability, tension–time index. Tension–time index is the product of two fractions:
(mean pressure per breath/PImax) × (TI/TTOT)
Studies in healthy volunteers show that respiratory muscle fatigue becomes inevitable when subjects breathe against an inspiratory load that causes tension–time index to rise above a threshold of 0.15. In a number of studies,16,17,36 many more weaning-failure patients than weaning-success patients were found to exhibit tension–time index values above 0.15. As such, weaning-failure patients experience workloads that are sufficient to induce respiratory muscle fatigue.
The EMG power spectrum and tension–time index provide only indirect evidence of fatigue, and do not provide direct proof of its occurrence. In neurophysiologic terms, fatigue means that a muscle is generating less force in response to a given neural stimulus than it had generated in the past. The most direct method for detecting fatigue in patients is to stimulate the phrenic nerves in the neck and measure the resulting change in Pdi. The challenge with use of phrenic nerve stimulation in critically ill patients is to ensure that successive twitches are all generated at the same end-expiratory lung volume, a constant degree of neural depolarization is achieved by the stimulator, and twitch potentiation (the increase in pressure that occurs with a recent forceful contraction) is avoided. Laghi et al29 measured twitch Pdi using phrenic stimulation in eleven weaning-failure patients and eight weaning-success patients before and after a T-tube trial. Twitch Pdi was 8.9 ± 2.2 cm H2O before the trial and 9.4 ± 2.4 cm H2O after the trial in the weaning-failure patients (Fig. 58-7). The respective values in the weaning-success patients were 10.3 ± 1.5 and 11.2 ± 1.8 cm H2O. No patient in either group exhibited a fall in twitch Pdi. The failure to develop fatigue was surprising because seven of the eight weaning-failure patients had a tension–time index above 0.15.
Figure 58-7
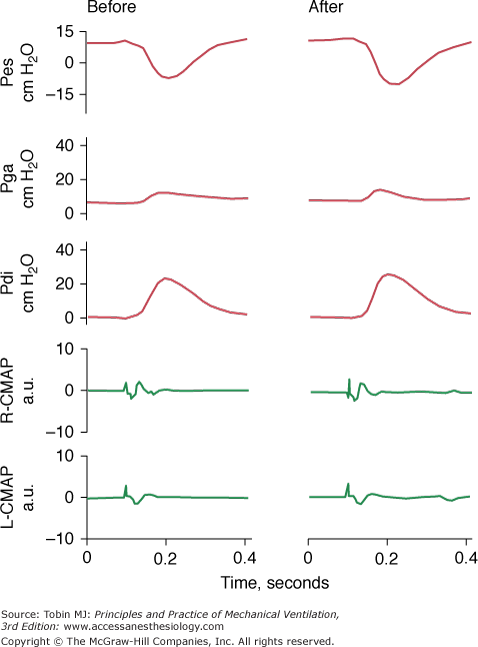
Esophageal pressure (Pes), gastric pressure (Pga), transdiaphragmatic pressure (Pdi), and compound motor action potentials (CAMP) of the right and left hemidiaphragms after phrenic nerve stimulation before (left) and after (right) a T-tube trial in a weaning-failure patient. The end-expiratory value of Pes and the amplitude of the right and left CAMPs were the same before and after the trial, indicating that the stimulations were delivered at the same lung volume and that the stimulations achieved the same extent of diaphragmatic recruitment. The amplitude of twitch Pdi elicited by phrenic nerve stimulation was the same before and after weaning. (Used, with permission, from Laghi et al.29)
The most likely reason that patients did not develop fatigue is because physicians reinstituted mechanical ventilation before there was enough time for its development. The relationship between tension–time index and the length of time that a load can be sustained until task failure follows an inverse-power function. Bellemare and Grassino37 expressed the relationship as: time to task failure = 0.1 (tension–time index).−3.6 Figure 58-8 shows the increase in tension–time index over the course of the weaning trial29 and predicted time to task failure.37 At the point that the physician reinstituted mechanical ventilation, patients were predicted to be able to sustain an additional 13 minutes of spontaneous breathing before developing task failure. In other words, clinical manifestations of severe respiratory distress were evident for a substantial time before the patients were predicted to develop fatigue. In an intensive care setting, these clinical signs will lead attendants to reinstitute mechanical ventilation before fatigue has time to develop.
Figure 58-8
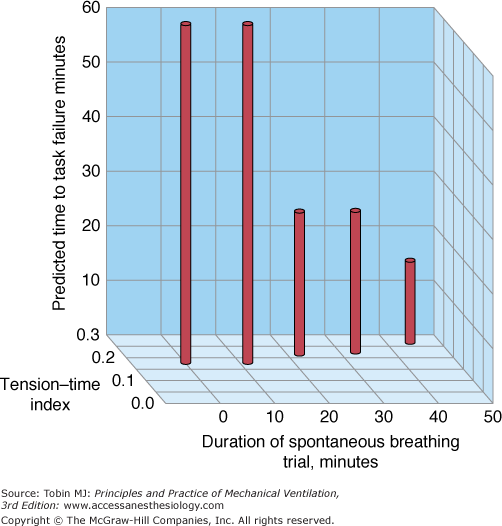
Interrelationship between the duration of a spontaneous breathing trial, tension–time index of the diaphragm, and predicted time to task failure in nine patients who failed a trial of weaning from mechanical ventilation. The patients breathed spontaneously for an average of 44 minutes before a physician terminated the trial. At the start of the trial, the tension–time index was 0.17, and the formula of Bellemare and Grassino37 (see text for details) predicted that patients could sustain spontaneous breathing for another 59 minutes before developing task failure. As the trial progressed, the tension–time index increased and the predicted time to development of task failure decreased. At the end of the trial, the tension–time index reached 0.26. That patients were predicted to sustain spontaneous breathing for another 13 minutes before developing task failure clarifies why patients did not develop a decrease in diaphragmatic twitch pressure. In other words, physicians interrupted the trial on the basis of clinical manifestations of respiratory distress, before patients had sufficient time to develop contractile fatigue. (Used, with permission, from Laghi and Tobin.27).
In a study of nineteen patients being weaned from mechanical ventilation,18 all but one of the eleven weaning-failure patients exhibited expiratory muscle activity (the exception being a patient with paraplegia). Expiratory muscle activity—as quantified by the expiratory rise in Pga—was absent in all but three of eight weaning-success patients, and its magnitude was trivial in the remainder (Fig. 58-9). At the onset of the trial, the expiratory rise in Pga was equivalent in the failure and success groups, 0.9 ± 0.5 and 0.1 ± 0.1 cm H2O, respectively. At the end of the trial, the expiratory rise in Pga increased to 4.4 ± 1.1 cm H2O in the failure group (p = 0.0005), whereas it did not change, 0.1 ± 0.1 cm H2O, in the success group. Compared with the success group, the failure group exhibited larger increases in expiratory rise in Pga (p = 0.004). In the failure group, expiratory muscle activity accounted for 53 ± 4% of total PEEPi throughout the weaning trial.
Figure 58-9
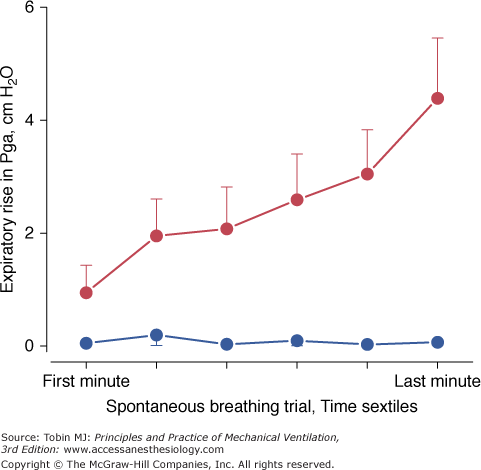
Expiratory rise in gastric pressure (Pga) during the course of a weaning trial in failure (•) and success patients (•). Between the onset and the end of the trial, failure patients developed an increase in the expiratory rise in Pga (p = 0.0005) whereas success patients did not. Over the course of the trial, failure patients had higher values of expiratory rise in Pga (p = 0.004) than did success patients. Bars represent ± standard error (SE). (Modified, with permission, from Parthasarathy et al.18)
In the study of Parthasarathy et al,18 sternomastoid EMG activity, measured with fine-wire electrodes, was evident in 83 ± 9% of all the breaths in the weaning-failure group and in 19 ± 10% of all breaths in the weaning-success group (p = 0.002) (Fig. 58-10). Sternomastoid activity became evident within the first minute of the trial in eight of the eleven failure patients and in one of the eight success patients. By the end of the trial, sternomastoid activity was noted in all failure patients but in only three of the success patients, and this activity was modest. The immediate increase in sternomastoid activity in the failure patients probably results from increased respiratory motor output in response to a combination of decreased capacity of the respiratory muscles to generate pressure29 and an increase in mechanical load that occurs early during the weaning trial. In addition to increased sternomastoid activity, weaning-failure patients displayed greater inspiratory rib cage muscle contribution to tidal breathing throughout the trial than did the success patients (Fig. 58-11).
Figure 58-10
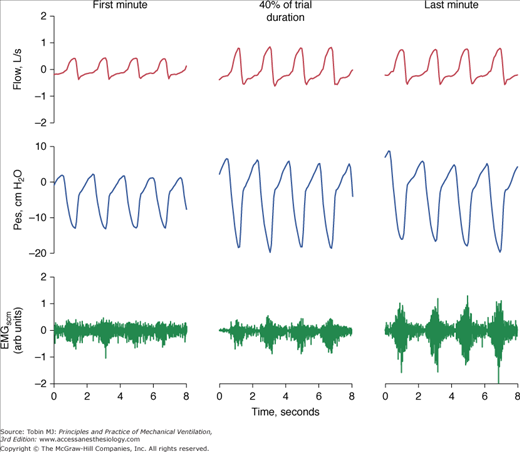
Representative tracings of flow, esophageal pressure (Pes), and electromyogram of the sternomastoids (EMGscm) in a weaning-failure patient. Recordings were obtained during the first minute of the weaning trial, 40% of trial duration, and last minute of the trial. Phasic inspiratory activity of the sternomastoid muscle was evident within the first minute of the trial, and it increased progressively over the course of the trial. Note that phasic activity of the sternomastoids persists into expiration. (Used, with permission, from Parthasarathy et al.18)
Figure 58-11
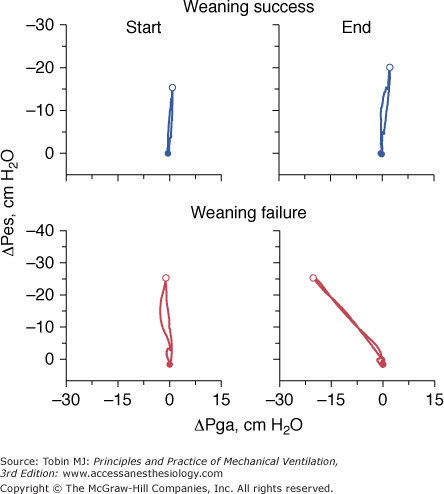
Plots of tidal changes in esophageal pressure (ΔPes) against tidal changes in gastric pressure (ΔPga) in a weaning-success patient and a weaning-failure patient. At the start of a weaning trial, the success patient (top left panel) exhibited swings in esophageal pressure that became markedly more negative between the onset (closed symbol) and the end of inspiration (open symbol); in contrast, gastric pressure increased only slightly. Therefore, the slope of the Pes–Pga plot at the onset of weaning (top left panel) was much greater than the slope recorded in healthy subjects during resting breathing, where the tidal change in gastric pressure is often greater than the tidal change in esophageal pressure. The steep Pes–Pga plot (top left panel) indicates a greater-than-usual contribution of the rib cage muscles to tidal breathing than that of the diaphragm. Between the onset (top left panel) and the end of weaning (top right panel), the slope of the Pes–Pga plot changed very little, indicating a constant contribution of the diaphragm and rib cage muscles to tidal breathing over the course of the weaning trial. In the case of the weaning-failure patient, the inspiratory swings in esophageal pressure and gastric pressure had a similar pattern at the start of the trial to that in the success patient (bottom left panel). At the end of the trial, the failure patient exhibited a markedly negative slope in the Pes–Pga plot, signifying a further increase in inspiratory rib cage muscle recruitment that was out of proportion to diaphragmatic recruitment.
A striking feature of the weaning-failure patients is the timing at which different muscle groups become active.18 The sequence begins with activity of the diaphragm and with greater activity of inspiratory rib cage muscles than is the case in the success patients; recruitment of sternomastoids and rib cage muscles is near maximum within 4 minutes of trial commencement, whereas the expiratory muscles are not recruited until quite late in the trial (at 17 to 20 minutes).18 The existence of a hierarchy of respiratory muscle activation is supported by the known delayed activation of the sternomastoid muscles38 and expiratory muscles in healthy volunteers39,40 and in ambulatory patients with COPD.41
Although the respiratory muscles do not develop fatigue, they perform a huge workload. Thus, they depend on an efficient transport of oxygen by the cardiovascular system. Aware of this fact, several researchers have examined cardiovascular performance during weaning. Lemaire et al42 studied fifteen patients with COPD, seven of whom had documented ischemic heart disease. After 10 minutes of breathing (through the ventilator without PEEP), the patients developed increases in transmural pulmonary artery occlusion pressure (PAOP) (8 to 25 mm Hg), cardiac index (3.2 to 4.3 L/min/m2), left ventricular end-diastolic volume index (65 to 83 mL/m2), and right ventricular end-diastolic volume index (83 to 103 mL/m2). The investigators attributed the increase in left ventricular end-diastolic volume to augmentation of venous return (secondary to low pleural pressure during spontaneous breathing and central translocation of blood volume secondary to peripheral vasoconstriction) and increased left ventricular afterload (secondary to markedly negative pleural pressure swings and increased catecholamine release). Nine of the fifteen patients were weaned after 10 days of diuretic therapy, at which time PAOP had fallen to 9 mm Hg.
Although a particular PAOP has not been rigorously linked with the inevitable onset of cardiogenic pulmonary edema, an increase in PAOP above 18 mm Hg during a weaning trial is widely considered to indicate the onset of weaning-induced pulmonary edema.43,44 Several research groups have reported increases in PAOP in patients as they failed a weaning trial, although these researchers did not detect a concomitant decrease in cardiac output.42,45–47 As such, the cardiorespiratory stress posed by the resumption of spontaneous breathing after a period of mechanical ventilation resembles the challenges posed by whole-body exercise, which also results in increases in cardiac output and work of breathing.48 Increases in adrenergic tone that accompany increased cardiorespiratory stress can produce increases in venous return, left-ventricular afterload, cardiac work, and myocardial oxygen demand—all of which may precipitate myocardial ischemia in predisposed patients.42,43
Richard et al49 studied a group of twelve patients with COPD who did not have documented coronary artery disease. All of the patients tolerated at least two 30-minute T-tube trials. (This finding suggests that they were weaning-success patients, although it is not stated that they tolerated extubation.) Ejection fraction, measured by technetium99m radionuclide angiography, was 54.5 ± 12.4% during mechanical ventilation. Spontaneous breathing resulted in a fall in ejection fraction to 47 ± 13%. The fall was homogenous and not accompanied by regional wall abnormalities that occur with myocardial ischemia. Moreover, thallium imaging performed 15 minutes after the weaning trial revealed normal myocardial perfusion. The investigators attributed the decrease in ejection fraction to increased left ventricular afterload.
The increases in oxygen consumption during a weaning trial means that patients who are unable to achieve sufficient increases in cardiac output are at risk of experiencing a decrease in oxygen transport. To investigate these considerations, Jubran et al39 continuously recorded mixed venous oxygen saturation ( ) in eight weaning-failure and eleven weaning-success patients over the course of T-tube trials that lasted about 40 minutes. Immediately before the trial,
  was equivalent in the two groups. On discontinuation of the ventilator,
  fell progressively in the failure patients (to 51.5 ± 7.9% at the end of the trial), whereas it did not change in the success patients (Fig. 58-12). Oxygen demand (
 ) was similar in the two groups during the weaning trial, although it differed in the manner with which it was met.
Figure 58-12
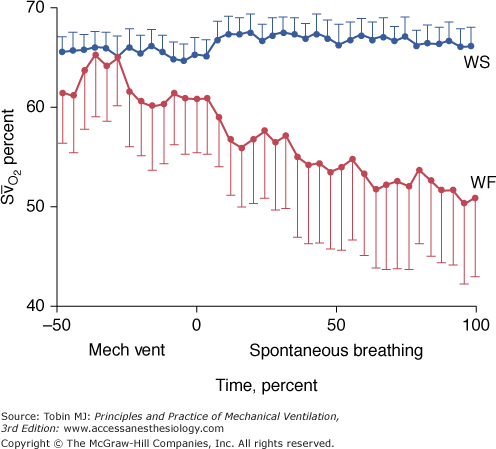
Ensemble averages of the interpolated values of mixed venous oxygen saturation ( ) during mechanical ventilation (Mech Vent) and a trial of spontaneous breathing in weaning-success patients (blue symbols) and weaning-failure patients (red symbols). During mechanical ventilation,
  was similar in the two groups (p = 0.28). Between the onset and the end of the trial,
  decreased in the failure patients (p <0.01), whereas it did not change in the success patients (p = 0.48). Over the course of the trial,
  was lower in the failure patients than in the success patients (p <0.02). (Bars represent standard error [SE].) (Used, with permission, from Jubran et al.45)
The success patients demonstrated an increase in cardiac index between mechanical ventilation and the end of the trial, 3.07 to 3.51 L/m/m2, which was accompanied by an increase in oxygen transport (Fig. 58-13). The failure group did not experience an increase in oxygen transport (partly because of elevations in right and left ventricular afterload); instead, they experienced an increase in oxygen extraction ratio, which, in turn, contributed to the fall in  . The failure patients also had more impaired pulmonary gas exchange (
 was 0.32 at the start of the trial). The combination of greater venous admixture and low
  led to rapid arterial desaturation and a relative decrease in oxygen being supplied to the tissues.
Figure 58-13
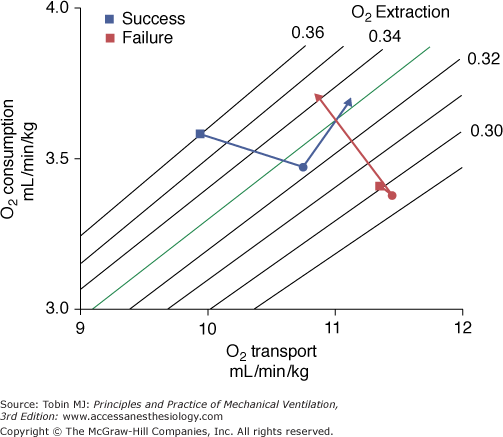
Oxygen transport, oxygen consumption, and isopleths of oxygen extraction ratio in weaning-success (blue symbols) and weaning-failure patients (red symbols) during mechanical ventilation (squares) and at the onset (circles) and end (triangles) of a T-tube trial. (Used, with permission, from Jubran et al.45)
Mean pulmonary artery pressure was higher in the failure patients than in the success patients during mechanical ventilation (Fig. 58-14). The pressure increased further over the course of the trial in the failure patients, whereas the success patients showed no change. Several factors account for the increase in pulmonary artery pressure. Hypoxemia and acidosis are potent vasoconstrictors. Pulmonary artery pressure can also be increased by alveolar vessel compression secondary to the increase in alveolar pressure that accompanies the dynamic hyperinflation and deterioration in pulmonary mechanics in weaning failure. During mechanical ventilation, the two groups had an equivalent mean arterial pressure, which increased in the failure patients by the end of the trial. The increase in mean arterial pressure combined with no change in cardiac index indicates an increase in left ventricular afterload.
Figure 58-14
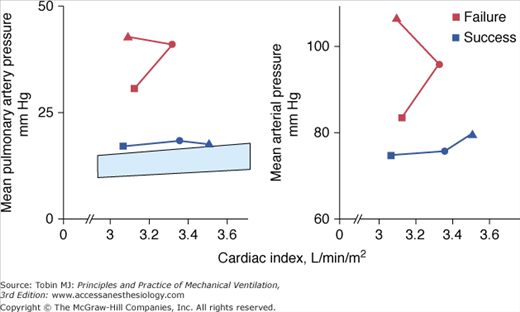
Mean pulmonary artery pressure and mean arterial pressure versus cardiac index during mechanical ventilation (squares) and at the onset (circles) and end (triangles) of a T-tube trial in weaning success (blue symbols) and weaning-failure patients (red symbols). The blue shaded area represents the normal range of increase in mean pulmonary artery pressure with cardiac index. In the success patients, cardiac index increased between mechanical ventilation and the end of the trial, mean pulmonary artery pressure remained slightly above the normal range, and mean arterial pressure did not change. Conversely, in the failure patients, cardiac index was similar during mechanical ventilation and at the end of the T-tube trial, but both mean pulmonary artery pressure and mean arterial pressure were higher by the end of the trial (p <0.025 and p <0.05, respectively). The increases in these vascular pressures, together with the lack of change in cardiac index, indicate increases in right and left ventricular afterload in the failure patients. (Used, with permission, from Jubran et al.45)
In an investigation of similar design, Zakynthinos et al31 studied twelve weaning-success and eighteen weaning-failure patients during a spontaneous breathing trial. Half of the failure patients increased their oxygen consumption and this increase was met mainly by an increase in oxygen extraction. The remaining half of the failure patients did not exhibit an increase in oxygen consumption; instead, increase in oxygen delivery was accompanied by a decrease in oxygen extraction. These studies31,42,45 demonstrate variability in circulatory and global tissue oxygenation responses during weaning failure.
A primary goal of mechanical ventilation is to improve gas exchange, and accordingly one expects some deterioration in gas exchange with the resumption of spontaneous breathing. The most detailed study of gas exchange during weaning is that conducted by Beydon et al.50 They studied eight patients with COPD who were considered ventilator dependent (although the patients were able to sustain at least 1- to 3-hour periods of spontaneous breathing). When switched from controlled ventilation, patients developed an increase in frequency, fall in VT (without change in  ), and an increase in PCO2 (41 to 49 mm Hg). Using the multiple inert gas technique, the investigators found that the distribution of ventilation to regions of ventilation–perfusion (
 ) relationships above 100 (i.e., VD/VT) increased from 39 ± 8% during controlled ventilation to 46 ± 7% during spontaneous breathing. Perfusion of low
  regions was higher during spontaneous breathing than during controlled ventilation (15 ± 11 vs. 6 ± 8%). The investigators also performed isotope scans, which revealed a decrease in
  ratios between the apex and the base of the lungs. This observation indicated that the low
  units identified by the inert gas technique were located at the lung bases. The major determinant of the
  abnormalities was the size of VT: It correlated with perfusion in the low
  range, the decrease of
  ratios in the bases, and widening of the isotopic craniocaudal gradient. The maldistribution
  of ratios during spontaneous breathing were improved by controlled ventilation but not by pressure support of 10 cm H2O.
Torres et al51 used the multiple inert gas technique to study eight patients with COPD who were apparently successfully weaned. Measurements were first obtained during assist-control ventilation (VT 700 mL, rate 12 breaths/min, and FIO2 ≤0.40). On discontinuation of the ventilator, the patients developed rapid shallow breathing (relative to ventilator settings) and acute respiratory acidosis (increase in PCO2 from 49 to 59 mm Hg, decrease in pH from 7.42 to 7.36). Spontaneous breathing caused an overall worsening of ventilation–perfusion inequality: The fraction of cardiac output distributed to low  (<0.1) areas increased from 9.4% to 19.6%, and the dispersion of ventilation distribution increased. Despite the deterioration in PCO2relationships, the expected fall in partial pressure of oxygen (PO2) was prevented by an increase in cardiac output (4.7 to 6.7 L/min) and increase in mixed venous PO2 (37 to 42 mm Hg). A largely similar pattern of gas exchange was reported by Ferrer et al,52 who studied seven patients with COPD who were not yet ready to tolerate complete discontinuation of mechanical ventilation.
Predicting Outcomes
When talking about weaning indices or weaning predictors, many clinicians overlook the fact that these measurements constitute a form of diagnostic testing. Accordingly, evaluation of the reliability of weaning-predictor tests must comply with the canons developed for evaluating diagnostic tests.53–55 To understand the literature on medical diagnostic testing, the reader has to cope with a huge number of specialized terms, many of which have meanings that contradict the meaning of the same words in everyday speech. Specificity, for example, measures the fraction of patients who are correctly identified as not having the disease under consideration. In regular everyday speech, specificity means that something that “possesses properties that characterize a species” or that is “clearly defined and definite.” These ideas are the opposite of the absence of a property (disease). The terms are also duplicative. Specificity is also known as true-negative rate and as 1 minus false-positive rate. All of the specialized expressions are simply different ways of combining true-positive, true-negative, false-positive, and false-negative results. Life would be easier if research on weaning predictors were solely communicated using these four test characteristics, and terms such as specificity were avoided. The reader, however, cannot adopt this minimalist approach and must instead grapple with the many terms because of their widespread use.
A second problem arises when a reader desires a more fundamental understanding and consults a textbook on medical decision analysis. Diagnostic test results are called “positive” (or abnormal) when they diagnose a “disease” (or undesirable condition), and “negative” when they indicate a normal or desirable condition.45 When applying these concepts to weaning, the reader must think of “disease” as “weaning success” and a positive or abnormal test result as one that predicts weaning success. This orientation may seem counterintuitive. But too large a body of research already exists to make a fundamental change.
A third problem for the reader of a textbook on decision analysis is that the discussion is usually in generic terms, covering all possible disease states and all forms of diagnostic testing. This generic or abstract approach makes the discussion long-winded. The reader has to relate abstract concepts to the particular clinical situation that the reader is interested in. To ease discussion, we discuss the fundamental principles of decision analysis in terms of a single diagnostic test. We select a test used for predicting weaning outcome, the f/VT, because it has been subjected to the most investigation. And we focus on a single outcome: a patient’s ability to tolerate a 30-minute T-tube trial without distress that is followed by extubation. This outcome is weaning success. Thus, a positive diagnostic test result is a recording that predicts actual successful weaning outcome without the need for reintubation. The development of distress during a T-tube trial that leads to the reinstitution of mechanical ventilation is weaning failure; extubation followed by reintubation is not a necessary requirement to satisfy the definition of weaning failure. Thus, a negative diagnostic test result is a reading that predicts either the development of distress during a T-tube trial (leading to the reinstitution of mechanical ventilation) or the need for reintubation after extubation. The reader can apply the same framework to other diagnostic tests (such as maximum inspiratory pressure) and to other outcomes (such as the prediction of reintubation in a patient who is extubated after a successful weaning trial).
The data generated by most diagnostic tests, including f/VT, are reported as continuous variables. It is common, however, to focus on a threshold and view the data in dichotomous terms: An f/VT value equal to or less than 100 (breaths/min/L) is referred to as a positive result (indicating a high likelihood of weaning success). All tests are inaccurate to varying degrees: No diagnostic test has a one-to-one correspondence with a disease state. The degree of error is assessed by comparing a test’s performance against a reference test. For weaning predictors, the reference standard is a patient’s ability to tolerate a weaning trial that leads to extubation. This reference standard gives rise to significant difficulties in interpreting research findings (see below). Its lack of concreteness (necessary if a disorder is to fit an ontologic model of disease) contrasts with more rigorous reference standards available for other diagnostic tests (histologic findings for evaluating a cancer marker).
The characteristics of test results are most easily displayed by a fourfold table, often referred to as a “2 × 2” table (Fig. 58-15). For f/VT, a true-positive result is a reading of equal to or less than 100 (the test predicts weaning success) in a patient who actually tolerates a T-tube trial that leads to extubation (weaning success). A true-negative result is an f/VT reading greater than 100 (the test predicts weaning failure) in a patient who actually develops distress during a T-tube trial and requires the reinstitution of mechanical ventilation (weaning failure). A false-positive result is an f/VT reading equal to or less than 100 (the test predicts weaning success) in a patient who actually fails a weaning trial. A false-negative result is an f/VT reading equal to or less than 100 (the test predicts weaning failure) in a patient who actually tolerates a weaning trial and is extubated.
Figure 58-15
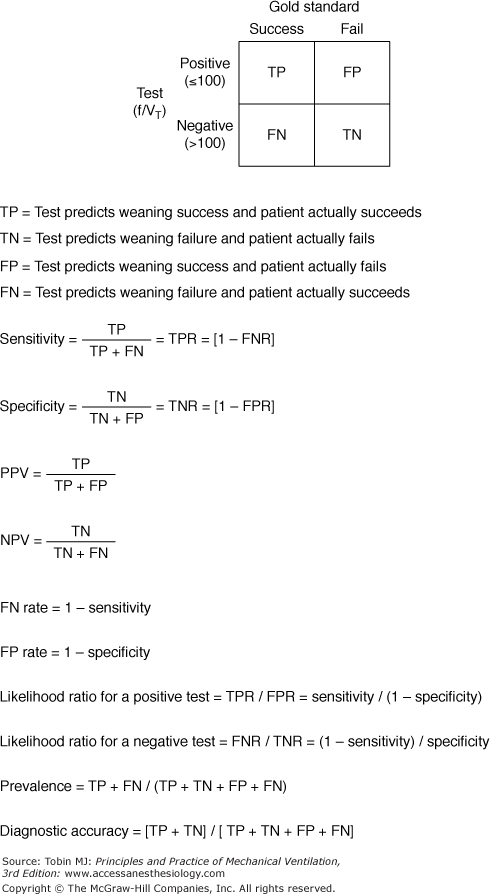
A 2 × 2 tabular display of the characteristics of diagnostic tests. The vertical columns represent the results of the reference standard test. The horizontal rows represent the results of the index test. Readings of f/VT equal to or less than 100 are classified as positive test results and readings greater than 100 are classified as negative test results. The relationship of these binary results to the outcome of a T-tube weaning trial forms a decision matrix that has four possible combinations.
Each cell in Figure 58-15 represents one of the four unique characteristics of a test (true-positive, true-negative, false-positive, and false-negative results). When developing a new weaning predictor, researchers need to undertake the initial evaluation in roughly equal numbers of weaning-success and weaning-failure patients if the predictor is to prove reliable under future testing.46 Once the four test characteristics have been determined in a broad spectrum of weaning-success and weaning-failure patients, the test characteristics are considered constant and the test can be applied to the evaluation of any given patient. There is, however, one major assumption, which is all too often ignored. The formulae assume that the prevalence of weaning success and weaning failure in the new groups in which the test is being applied is the same as in the sample from which the four test characteristics were originally developed.53,56,57 If researchers are mindful of this fundamental requirement, much confusion can be avoided.
Sensitivity (also known by the more intuitive term, true-positive rate) answers the question: “In a weaning-success patient, what is the likelihood that the predictor test will be positive (f/VT ≤100)?” Thus, sensitivity measures the proportion of weaning-success patients in whom the predictive test is positive (f/VT ≤100). When clinicians are primarily interested in screening, they employ diagnostic tests that have a high sensitivity.53 The purpose of a screening test is to pick up as many cases of a disease as possible out of the population being tested; screening can also be viewed as an exercise in ruling out disease, and a test for this purpose should have a low number of false-negative results (thus, a high sensitivity).58 (Mnemonics have been proposed to remember these relationships. SnNout: If a test has a sufficiently high Sensitivity, a Negative result rules out the target disorder.) In the weaning context, this step is equivalent to using a predictor that will identify as many patients as possible who will actually pass a T-tube trial. Screening tests are typically performed in situations in which the pretest probability of the disease in question is low.55 Because results are most often negative, the test should be easy to perform. As such, a test that takes 30 minutes or more to conduct, such as a T-tube trial, is not a satisfactory screening test.
Specificity (also known as true-negative rate) answers: “In a weaning-failure patient, what is the likelihood that the predictor test will be negative (f/VT 100)?” Thus, specificity measures the proportion of weaning-failure patients in whom the predictive test is negative (f/VT >100). When clinicians are primarily interested in confirming (or ruling in) the presence of a disease, they employ diagnostic tests that have a low number of false-positive results and, thus, a high specificity.53,58 (A mnemonic to remember this relationship is SpPin: If a test has a sufficiently high Specificity, a Positive result rules in the target disorder.) Because f/VT has a relatively low specificity (0.64 in the original study,59 it alone is not sufficient to confirm the presence of weaning failure. Instead, clinicians should undertake additional diagnostic testing, such as with a T-tube trial.
What are the characteristics of an ideal weaning-predictor test? Consider the following three diagnostic tests which differ in sensitivity and specificity. Test A has a sensitivity of 0.96 and specificity of 0.70; test B has a sensitivity of 0.70 and specificity of 0.96; and test C has a sensitivity of 0.83 and specificity of 0.83. Which test is best? The question cannot be answered until you are informed for what purpose the diagnostic test will be used. Many clinicians look on diagnostic testing from a monolithic perspective—a test is a test is a test. In reality, diagnostic testing is expected to fulfill two very different demands.53–55 The first is screening, that is, to pick up cases of a condition at the earliest possible time. This demand requires a test with high sensitivity.53–55 The second is confirmation of a condition for which there is already a strong suspicion. This demand requires a test with high specificity.53–55 “A single test can seldom be excellent for the goals of both discovery [screening] and confirmation,” Alvan Feinstein emphasized. “With rare exceptions, the same procedure cannot be sensitive enough to find all cases of the disease while simultaneously being specific enough to avoid false-positive identifications.”54 For example, chest radiography is reasonably sensitive (but nonspecific) in detecting lung cancer. Almost all patients with lung cancer will have an abnormal chest radiograph. (A normal chest radiograph is good in ruling out lung cancer.) But not everyone with an abnormal chest radiograph has lung cancer (high false-positive rate). Conversely, a positive histology result on bronchoscopic biopsy is a reasonably specific diagnostic method (false-positive results are uncommon). But it is insensitive (often failing to capture cancers at inaccessible sites). For these reasons, clinicians commonly use diagnostic tests in combination.
A weaning-predictor test is used to spot the earliest point in time that a patient might tolerate a weaning trial. It serves solely as a screening test. On its own a positive predictor-test result is not used as justification for extubation. Before that step, a confirmatory test, such as with a T-tube trial, is undertaken. The ideal time to undertake a screening test is when the pretest probability of weaning success is 20% or less.53 In contrast, weaning trials are commonly performed when the pretest probability of success is 75% or more.
The development of a reliable screening test hinges on avoiding false-negative results (a test predicting failure, but the patient actually succeeds).53,54 Simultaneously the test needs to pick up every possible true-positive result—the mindset is to miss no patient who can breathe without the ventilator. To capture the maximum meaningful number of true-positive results, the threshold for defining a positive screening test may be set deliberately high.53,54 This necessarily increases the number of false-positive results, producing a proportional decrease in specificity. Sensitivity captures exactly the components that define the reliability of a screening test because it contains only true-positive and false-negative rate. Likewise, specificity captures exactly the constituents of a reliable confirmatory test: avoidance of false-positive results (a test predicting success, but the patient actually fails) and maximizing true-negative rate.53,54
Sensitivity and specificity are often regarded as constant properties of a diagnostic test. The characteristics, however, for any diagnostic test are derived from data collected in a selected group of patients. Consequently, sensitivity and specificity of diagnostic tests vary across different parts of the clinical spectrum of the disease they are attempting to identify or exclude.57,60 Both sensitivity and specificity also perform differently in populations with different distributions of disease severity. For example, the sensitivity and specificity of electrocardiographic stress testing differs between patients with triple-vessel coronary artery disease and patients with mild single-vessel disease.61
False-positive rate answers: “What is the likelihood that a weaning-failure patient will have a positive test result (f/VT ≤100)?” Thus, the false-positive rate measures the proportion of positive test results (f/VT ≤100) in all weaning-failure patients. In a weaning-failure patient, test results are only true-negatives or false-positives. Thus, false-positive rate is the complement of true-negative rate (false-positive rate = 1 minus true-negative rate).
False-negative rate answers: “What is the likelihood that a weaning-success patient will have a negative test result (f/VT >100)?” Thus, false-negative rate measures the proportion of negative test results (f/VT >100) in all weaning-success patients. In a weaning-success patient, test results are only true-positives or false-negatives. Thus, false-negative rate is the complement of true-positive rate (false-negative rate = 1 minus true-positive rate).
Sensitivity and specificity are calculated in patients in whom a diagnosis is already known. Clinicians, however, are faced with positive and negative results in patients whose diagnosis is not yet established. When contemplating a diagnosis, a clinician is not oriented down the vertical columns of the 2 × 2 table, but across the horizontal rows (see Fig. 58-15). Thus, clinicians think more in terms of positive-predictive and negative-predictive values than in terms of sensitivity and specificity.52 Positive-predictive value answers: “What is the likelihood of weaning success in a patient who has an f/VT equal to or less than 100?” Thus, positive-predictive value measures the fraction of patients with positive test results (f/VT ≤100) who are successfully weaned. Negative-predictive value answers: “What is the likelihood of weaning failure in a patient who has an f/VT greater than 100?” Thus, negative-predictive value measures the fraction of patients with negative test results (f/VT >100) who fail a weaning trial. The positive-and negative-predictive values of a diagnostic test are particularly susceptible to variation in the prevalence of the condition under consideration (see below).
Likelihood ratio combines sensitivity and specificity into a single number. The likelihood ratio for a positive test relates the likelihood that a weaning-success patient will have a positive test result (f/VT ≤100) to the likelihood that a weaning-failure patient will have a positive test result. In other words, it is the probability of a positive test result (f/VT ≤100) in weaning-success patients divided by probability of the same test result in weaning-failure patients. It is calculated as true-positive rate/false-positive rate (or: sensitivity/[1 minus specificity]). The likelihood ratio for a negative test relates the likelihood that a weaning-success patient will have a negative test result (f/VT >100) to the likelihood that a weaning-failure patient will have a negative test result. In other words, it is the probability of a negative test result (f/VT >100) in weaning-success patients divided by probability of the same test result in weaning-failure patients. It is calculated as false-negative rate/true-negative rate (or: [1 minus sensitivity]/specificity).
An Evidence-Based Medicine (EBM) Task Force of the American College of Chest Physicians62,63 evaluated the usefulness of weaning-predictor tests. Employing a meta-analysis, the Task Force calculated pooled likelihood ratios for several predictors. They concluded that all weaning-predictor tests have low power, and recommended that clinicians should start the weaning process with a spontaneous breathing trial (a confirmatory test), and use the initial few minutes of the trial as a screening test.62 This reverses the logic axiomatic to diagnostic testing. It is analogous to saying that when you suspect diabetes, start with a glucose-tolerance test and then, as the test gets underway, ask the patient for a urine sample in order to do a dipstick.8
The Task Force’s meta-analysis contained more than fifteen methodologic errors, including several examples of the three main types of systematic error—selection bias (test-referral bias, spectrum bias), misclassification bias (categorizing reintubation as weaning failure), and confounding (considering pressure support to represent a form of unassisted breathing)—as well as several errors of interpretation.64,65 Any one of the systematic errors would be sufficient to scupper the conclusions of the meta-analysis; yet when these flaws were subsequently identified and reported, the EBM Task Force did not contend a single one of them.65–68 Instead, the Task Force viewed the errors as side issues that did not detract from their recommendations.65,67 To ignore test-referral bias in the evaluation of a diagnostic test is analogous to a physiologist who claims that a partial pressure of arterial oxygen (PaO2) of 80 mm Hg is always better than a PaO2 of 60 mm Hg, and the fact that the measurements were made at inspired oxygen concentrations of 50% and 21%, respectively, is an academic distraction best ignored.
Physicians recognize that writing an order for a T-tube trial constitutes a clinical decision. A corollary might be proffered that not writing an order means that no decision has been made. That interpretation would be wrong. Whenever a physician looks at a ventilated patient and does not order a T-tube trial (or weaning-predictor test), the physician is deciding that the patient is not weanable at this time (stage 2 of weaning; see Seven Stages of Weaning). This subtle distinction is missed by the recommendation of the EBM Task Force to dispense with screening and commence the weaning process with a confirmatory test (a spontaneous breathing trial). They are thus encouraging physicians not to test for weanability until a patient looks ready for a T-tube trial. Their recommendation betrays a failure to comprehend the very purpose of weaning predictors. The sole purpose of a screening test (weaning predictors) is to alert a physician to consider doing a T-tube trial sooner than is the physician’s custom—for the trial to occur earlier than would otherwise happen.8 A positive result on a weaning-predictor test acts as a “physician alert,” and aids in the cognitive process known as diagnostic triggering.69
Before clinicians perform a diagnostic test, they formulate a pretest (or prior) probability of disease. In the context of weaning, clinicians form an initial gestalt of a patient’s likelihood of passing a T-tube trial based on their previous experience of patients with similar clinical characteristics. After measuring a weaning predictor test, and knowing its test characteristics (sensitivity and specificity), the clinician formulates a new probability statement (of whether the patient is likely to pass the T-tube trial). The new statement is the posttest (or posterior) probability. The Bayes’ theorem is an equation that describes the relationship between pretest probability and posttest probability. It is used to estimate how much the uncertainty of weaning outcome changes from before measurement of a predictor test (the pretest probability) to after obtaining the new information (the conditional probability). In particular, the Bayes’ theorem is used to transform the information contained in sensitivity and specificity into a format that can be employed in diagnostic testing (calculation of posttest probability, in the format of positive-predictive and negative-predictive value).54
Conditional probability refers to the probability that a particular event will occur given that some other condition has been met.57 In the weaning context, it addresses, “What is the probability of a positive f/VT result (<100) conditional upon the patient’s passing (or failing) a weaning trial?” A clinician can calculate the posttest probability of weaning success if the clinician has three pieces of information: (a) the pretest probability of weaning success (typically, the prevalence); (b) the probability of a positive f/VT result (≤100) conditional upon the patient’s passing a weaning trial (true-positive rate, or sensitivity); and (c) the probability of a positive f/VT result (≤100) conditional upon the patient’s failing a weaning trial (false-positive rate, or 1 minus specificity). A useful weaning predictor test has a high conditional probability (a high likelihood ratio), and thus markedly alters the posttest probability of weaning success. The Bayes’ theorem is employed to convert the vertical indices in the 2 × 2 table (sensitivity and specificity) into the desired horizontal indices of disease prediction, which indicate posttest probability.54 The posttest probability of weaning success after obtaining a positive test result (f/VT ≤100) is the positive-predictive value. The posttest probability of weaning failure after obtaining a negative test result (f/VT >100) is the negative-predictive value.
The Bayes’ theorem operates on the assumption that the sensitivity and specificity of a test are constant irrespective of the pretest probability of disease. But “[i]n the few instances in which this assumption has been checked,” notes Feinstein,54 “it was found to be erroneous.” In a study of exercise electrocardiography for the diagnosis of coronary artery disease, Hlatky et al70 found sensitivity was 0.80 in patients with typical angina and 0.53 in patients with atypical chest pain; sensitivity was 0.85 in patients with triple-vessel disease and 0.48 in patients with single-vessel disease. Specificity was 0.85 when left-ventricular ejection fraction was equal to or greater than 50% and 0.73 when ejection fraction was 30% to 49%. In a study of patients being evaluated for urinary tract infection, Lachs et al60 found that sensitivity of the dipstick test was 0.92 in patients with a high (>0.50) pretest probability of infection (patients with dysuria, urgency, and hematuria), and sensitivity was 0.56 in patients with a low pretest probability (≤0.50). Conversely, specificity was 0.42 in patients with a high pretest probability for infection, and 0.78 in patients with a low pretest probability. Indeed, for any condition, history and physical examination is likely to be more abnormal when a disease is extensive, and thus, the clinician will assign a high pretest probability.71 In many studies of weaning predictors, researchers have assumed that reported values for sensitivity and specificity apply in all circumstances. This assumption can give rise to errors when Bayes’ theorem is applied.54,57,72
In evaluating the performance of weaning predictors, probably no aspect is ignored more often—and the source of greater confusion—than recognizing the fundamental importance of pretest probability (the anticipated prevalence of a disorder). The pretest probability is the fraction of weaning- success patients out of an entire weaning population (both success and failure patients). This pretest probability markedly affects the interpretation of new test information. In their book on medical decision analysis, Sox et al55 state, “Perhaps the most important idea in this book is the following: The interpretation of a test result depends on the pretest probability of disease.” That is, a clinician’s interpretation of new diagnostic information depends on what the clinician believed before doing the test. As a clinician’s estimate of pretest probability of weaning success increases, so also does the posttest probability of weaning success.
The pretest probability has an enormous influence over the ability of the results of any diagnostic test to alter the posttest probability of disease. When the pretest probability of weaning success is high, a positive test result (f/VT ≤100) has little effect. (The probability cannot increase much after a positive test because of a ceiling effect.) A negative test result (f/VT >100) will drop the probability considerably, but only into the large middle range of probability that is diagnostically inconclusive.72 Conversely, when the pretest probability of weaning success is low, a negative test result (f/VT >100) has little effect. (The probability does not have anywhere to drop after a negative test. A positive test result [f/VT ≤100] has a large effect, but it only brings the clinician into the large middle range of probability.) Thus, when the pretest probability is already close to diagnostic certainty (high or low), a test that does not confirm the diagnostic suspicion can produce substantial changes in posttest probability. The above description is not unique to weaning predictors, but applies to all diagnostic tests in medicine. The only exception to this relationship between pretest probability and postprobability is an imaginary test with 100% sensitivity and 100% specificity.
A clinician gains the maximum increase in posttest probability for a positive test when pretest probability is 40%, and gains the maximum increase for a negative test when the pretest probability is 60%.53 That is, physicians have most to gain from diagnostic testing when the pretest probability of a condition is close to 50%.53 For a weaning predictor test to influence decision making, it needs to be measured early in a patient’s course (expediting the transition between weaning stage 2 and stage 3). If a clinician observes that half or more of the clinician’s measurements of weaning predictors generate positive results (indicating that a patient is ready for a weaning trial), that clinician is not measuring the predictor test early enough in his or her patient’s course. A clinician who is measuring predictor tests early in a patient’s course will obtain negative test results (indicating that a patient is not ready for a weaning trial) at least as often as positive results. Measuring weaning predictors in patients who have already passed a weaning trial is a futile undertaking. Unfortunately, most studies of weaning predictors have been conducted in patients who had a pretest probability of weaning success of 75% or higher (Table 58-1). Such a high pretest probability markedly decreases the apparent reliability of a weaning-predictor test (Fig. 58-16).
| Author | No. Patients | Outcome End Point | Threshold | Sensitivity | Specificity | PPV | NPV | Positive Likelihood Ratio | Negative Likelihood Ratio | Pretest Prob of Success | Data Available to Primary | Location |
|---|---|---|---|---|---|---|---|---|---|---|---|---|
| 1. Yang & Tobin59 | 64 | WF or EF | ≤105 | 0.97 | 0.64 | 0.78 | 0.95 | 2.69 | 0.05 | 0.56 | No | MICU |
| 2. Gandia & Blanco13 | 40 | WF or EF | <96 | 0.89 | 0.83 | 0.93 | 0.77 | 5.24 | 0.13 | 0.7 | No | NS |
| 3. Sassoon & Mahutte14 | 45 | WF or EF | ≤100 | 0.97 | 0.40 | 0.85 | 0.80 | 1.62 | 0.08 | 0.78 | No | NS |
| 4. Yang128 | 31 | WF or EF | ≤100 | 0.94 | 0.73 | 0.79 | 0.92 | 3.48 | 0.08 | 0.1352 | No | MICU |
| 5. Mohsenifar117 | 29 | WF or EF | ≤105 (PS 7 to 8) | 1.00 | 0.27 | 0.69 | 1.00 | 1.37 | 0.00 | 0.62 | Not clear | RICU |
| 6. Lee133 | 52 | EF only | ≤105 (PS ?) | 0.72 | 0.11 | 0.79 | 0.08 | 0.81 | 2.55 | 0.83 | Yes | MICU |
| 7. Capdevila15 | 67 | EF only | 60 | 0.73 | 0.75 | 0.92 | 0.36 | 2.92 | 0.36 | 0.82 | Yes | Multidisc ICU |
| 8. Epstein1 | 94 | EF only | <100 | 0.92 | 0.22 | 0.83 | 0.40 | 1.18 | 0.36 | 0.81 | Yes | MICU |
| 9a. Chatila108 | 100 | WF or EF | ≤100 | 0.89 | 0.41 | 0.72 | 0.68 | 1.51 | 0.27 | 0.63 | Yes | MICU, CCU |
| 9b. Chatila108 | 100 | WF or EF | ≤100 | 0.98 | 0.59 | 0.83 | 0.94 | 2.39 | 0.03 | 0.63 | Yes | MICU, CCU |
| 10. Dojat129 | 38 | WF or EF | <100 | 0.94 | 0.81 | 0.80 | 0.94 | 4.95 | 0.07 |


