The Pulmonary System


The Pulmonary System


LUNG VOLUMES

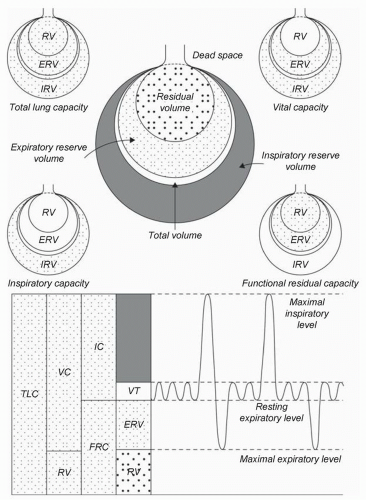
Figure 6.1 is a graphic representation of lung volume components that are meaningful for both negative pressure and positive pressure respiration (1). Tidal volume (VT) is the most frequent volume of air moved into and out of the lungs. Functional residual capacity (FRC), the amount of volume remaining in the lung after a normal expiration, is particularly relevant to upcoming discussions of respiratory failure and ventilator management. Critical closing volume (CCV, not shown in Fig. 6.1) is the lung volume at which small airways collapse, resulting in microat-electasis. Normally, CCV is less than FRC. However, with increasing age, chronic lung disease, and acute lung disease, CCV may become larger than FRC, resulting in significant atelectasis and an increase in physiologic shunt fraction (2).


Dead Space and Alveolar Ventilation

Dead space (VD) is the amount of VT (usually about 30%) that does not come in contact with pulmonary blood and cannot aid gas exchange. VD has two components: (1) anatomic— nose, mouth, trachea, bronchi, bronchioles; (2) physiologic—areas of lung parenchyma that are well ventilated but poorly perfused (i.e., V/Q approaches infinity) (Fig. 6.2). Alveolar ventilation (VA), the ventilation of perfused alveoli, is the difference between tidal volume (VT) and VD (3).


VA = VT − VD


Determinants of Arterial PCO2 and PO2

The determinants of arterial PCO2 and PO2 (PaCO2, PaO2) are listed in Table 6.1. PCO2 is directly proportional to the ratio of dead space to tidal volume, VD/VT. As VD ventilation approaches VT, carbon dioxide cannot be eliminated (VD/VT = 1). Methods used to reduce an elevated PCO2 include reduction of VD (i.e., tracheostomy to replace an endotracheal tube) or an increase in VT (i.e., relief of bronchospasm). Increasing rate of respiration to lower PCO2 will be successful only if there are areas of lung having a low VD/VT ratio. If the entire lung has a high VD/VT ratio, simply increasing respiratory rate will be ineffective (3).

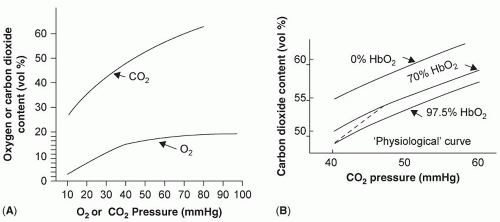
The carboxyhemoglobin dissociation curve is steep and almost linear, as compared to the oxyhemoglobin dissociation curve (Fig. 6.3). Increasing oxygen saturation reduces affinity and facilitates CO2 release in the lungs; lower oxygen saturation increases affinity and augments CO2 removal from the tissues. The nature of this curve allows a well ventilated and perfused area of lung to markedly reduce CO2 content and compensate for lung areas not engaged in gas exchange (1).

Carbon dioxide is the end product of the metabolism of carbohydrate, protein, and fat. Increased metabolic demands (e.g., exercise, infection) increase O2 use and CO2 production. The ratio of CO2 production to O2 use is respiratory quotient (RQ), which is 1.0 for carbohydrate and protein and 0.7 for fat. Hypermetabolic states that use primarily carbohydrate and protein (e.g., severe inflammation) result in more CO2 production than states that use primarily fat (starvation without inflammation).


Figure 6.1 A schematic and spirographic representation of static lung volumes important to pulmonary physiology. Abbreviations: RV, residual volume; ERV, expiratory reserve volume; IRV, inspiratory reserve volume; TLC, total lung capacity; VC, vital capacity; IC, inspiratory capacity; FRC, functional residual capacity; VT, tidal volume. Source: From Ref. 1.

The alveolar gas equation determines alveolar PO2 (PAO2) and, therefore, the highest possible PaO2.


PAO2 = (FiO2 × (Patmos − PH2O)) − (PACO2 × [FiO2 + (1 − FiO2)/RQ]

Where, FiO2 is the fraction of oxygen in inspired air, Patmos is the atmospheric pressure (760 mm Hg at sea level), PH2O is the partial pressure of water in the alveolus (47 mm Hg at 37°C), PACO2 is mean alveolar PCO2 (usually close to arterial PCO2) (1).

Increasing body temperature and the resultant increase in PH2O as well as elevated PACO2 can both lower PaO2, but the effect will be less as FiO2 increases. The alveolar gas equation is the clearest demonstration of the interaction between oxygen being added to the blood and CO2 being eliminated. Otherwise, the two processes are best thought of as separate.


Figure 6.2 Panel (A) is a schematic representation of lung units with ventilation and no perfusion (alveolar dead space). There is uniform ventilation to A and B, with no blood flow to A. Panel (B) represents lung units with perfusion to A and B, but no ventilation to A (physiological shunt). Panel (C) represents lung units with uniform ventilation and blood flow to A and B, but there is venous blood that bypasses alveoli (anatomical shunt). Source: From Ref. 1.


Table 6.1 Determinants of PaCO2 and PaO2


  1. PaCO2


    • Ratio of dead space to tidal volume VD/VT


    • Anatomic dead space


    • Physiologic dead space


    • Carboxyhemoglobin dissociation curve


    • CO2 production


  2. PaO2


    • Alveolar gas equation


    • FIO2


    • PCO2


    • Ventilation – perfusion inequality


    • Shunt


    • Decreased cardiac output


    • Diminished diffusion capacity


Ideally, the ventilation and perfusion of alveoli are perfectly matched (V/Q = 1). Areas that are ventilated but not perfused (V/Q = infinity) are physiologic VD units; areas that are perfused but not ventilated (V/Q = 0) are physiologic shunts. A shunt (Qs) represents venous blood that does not come in contact with ventilated alveoli (Fig. 6.2, middle and bottom). Similar to VD, there is a normal anatomic component of shunting [5-6% of cardiac output (Qt)] that consists principally of the blood supply to the bronchioles and heart, which then drains directly
into the pulmonary veins or the left ventricle, respectively. Areas of lung that simulate VD will affect PaO2 via the alveolar gas equation. Areas that simulate a shunt will diminish PaO2 by the admixture of venous blood with newly oxygenated blood.


Figure 6.3 Carbon dioxide dissociation curves illustrating (A) the almost linear relationship between the pressure of carbon dioxide and the content, and (B) increasing oxygen saturation reducing affinity and facilitating CO2 release in the lungs. Source: From Ref. 1.

With minimal shunting, mixed venous oxygen content will have little effect on PaO2. Increasing the shunt increases this influence. Under these circumstances, variables that decrease mixed venous oxygen saturation (decreased cardiac output, increased oxygen utilization) can significantly diminish PaO2 and may lead to therapy directed at improving lung function (4). Similarly, increasing cardiac output may improve PaO2 and lead to a false interpretation that the lung is better. Measurement of cardiac output and calculation of the shunt percentage as well as oxygen delivery and consumption, can help sort out the influence of cardiac output and oxygen consumption on arterial oxygen concentration.

Shunt equation (percent of cardiac output engaged in the shunt effect):


Qs/Qt = [(PAO2 − PaO2) × 0.0031]/[(CaO2 − CvO2) + (PAO2 − PaO2) × 0.0031]

where CaO2 is arterial oxygen content and CvO2 is mixed venous oxygen content (3).


Oxygen content = 1.34 × hemoglobin (g/dL) × oxygen saturation + 0.0031 × PO2

The average V/Q relationship of a normal lung is close to unity, but gravity is a determinant of the relative ratio of ventilation to perfusion in different areas of the lung. For instance, pulmonary blood flow is several times greater at the bases as compared to the apex in an upright man (5). Proportionally, however, ventilation is greatest at the apex. West has divided the lung into three zones that describe the ratio of intra-alveolar pressure (PAV) to pulmonary arterial (PA) and venous (PV) pressure: Zone I, PAV > PA > PV; Zone II, PA > PAV > PV; Zone III, PA > PV > PAV (Fig. 6.4) (6). Pulmonary artery occlusion pressure equals pulmonary venous pressure and, therefore, measures left atrial pressure most reliably in Zone III, where the catheter tip is vertically below the left atrium. Fortunately, since the catheter is flow directed, most often the tip does locate in Zone III.

More recent investigation has demonstrated that this vertical, gravity-dependent influence on ventilation and perfusion is accompanied by equal, if not greater, differences in the horizontal (isogravitational) planes of the lung. It is possible for high-perfusion regions to persist regardless of posture and blood flow is greater in the central regions of the lung as compared to the periphery. Similar findings have been noted with ventilation (5).

Diminished diffusion capacity is generally of little clinical significance in surgical critical care and likely to cause hypoxemia only when FiO2 is low (high altitude), with thickened alveolar capillary membranes (interstitial fibrosis), or with shortened exchange time (very high cardiac output).


Figure 6.4 Schematic illustration of the relationship between alveolar pressure (PA), pulmonary arterial pressure (Pa), and pulmonary venous pressure (Pv) in different zones of the lung. In zone 1, PA is greater than both Pa and Pv. In zone 2, Pa is greater then PA and Pv. In zone 3, Pa is greater than Pv, which is greater than PA. Source: From Ref. 6.


Table 6.2 Major Components of Pulmonary Mechanics


  • Inspiratory pressure


  • Expiratory pressure


  • Compliance/elastance


  • Resistance


  • Airway pressures


  • Work of breathing


Pulmonary Mechanics

The mechanics of respiration (Table 6.2) are important determinants of the need for respirator support. The following text and accompanying tables provide a brief description of the fundamentals that can be applied commonly in clinical practice.


Muscles of Respiration

The diaphragm is the major muscle of respiration. During quiet respiration, the costal and crural fibers that insert on the central tendon push the abdominal viscera down and produce negative intrathoracic pressure. The intercostal muscles are much less important, unless diaphragmatic weakness or paralysis is present, in which case there is inward displacement of the abdominal wall during inspiration. Other muscles assisting inspiration are the scalene and the sternocleidomastoid. Maximal contraction of inspiratory muscles can generate a negative intrapleural pressure of 60-100 mm Hg (1).

Expiration is usually passive. Active expiration incorporates all the muscles of respiration, with the abdominal muscles most important. Pressures up to positive 119 mm Hg have been documented (1).


Compliance/Elastance

Expansion of a lung can be likened to the expansion of a balloon. In a comparison of two balloons subjected to the same increment in transmural pressure, if balloon 1 expands to a larger
volume than balloon 2, then balloon 1 has more compliance but less elastance. Compliance is the ratio of the change in pressure to the change in volume. Elastance is the opposite of compliance and represents the intrinsic elastic component that resists deformation by stress. The relationship between transmural inspiratory and expiratory pressures and lung volumes is determined by the compliance of the chest wall and lungs (total compliance, Table 6.3). Without disease, total compliance (CT) is determined mostly by the elastic recoil properties of the lung (CL) and thorax (CW). With negative pressure, the inspiration CT equals approximately 0.1 L/cm H2O. Under conditions of mechanical ventilation CT in patients with normal lungs and chest walls, CT is approximately 0.05 L/cm H2O. Certain diseases (e.g., circumferential thoracic burns) diminish primarily chest wall compliance, while others (e.g., pulmonary edema) diminish primarily lung compliance. Critically ill patients commonly develop alterations in both components of total compliance.


Table 6.3 Formulae for Pulmonary Mechanics


  • Compliance (C) = ΔV/ΔP


  • Total Compliance (CT): 1/CT = 1/CCW + 1/CL


    where CCW = chest wall compliance, and CL = lung compliance.


  • Resistance (R) image


  • Airway Resistance (RAW) image


    where, PM = pressure at mouth, PALV = alveolar pressure and resistance is described in units cm H2O/L/sec (normal 2-3 in the spontaneously breathing adult).


  • Pressure drop during laminar flow:


    PB-PE = K1 × L × 1/r4


    where, K1 = constant related to flow rate and viscosity, L = length of tube, and r = radius of the tube.


  • Pressure drop during turbulent flow:


    PB-PE = K2 × (flow rate)2


    where K2 = constant related to length and radius of tube along with viscosity and density of the gas.


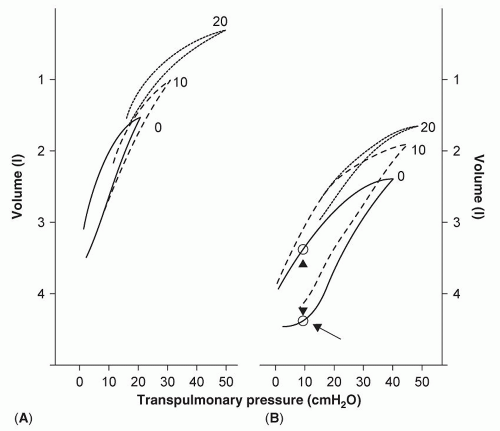
The compliance described above is measured as a given inflation volume is held constant (static compliance). The relationship between volume and pressure can be plotted (pressure-volume curve, P-V curve, Fig. 6.5) and the slope of this curve represents compliance. As seen in the figure, a normal lung exhibits a similar relationship between pressure and volume as pressure is gradually increased and then decreased (left part of the figure). With certain diseases [acute respiratory distress syndrome (ARDS) in this case, right part of the figure], the pressure volume curve exhibits significant hysteresis, indicating that compliance changes as lung volume units open when pressure is increased and then close as pressure is decreased. The changes in static compliance with different inflation volumes can be plotted (Fig. 6.6) to produce a characteristically sigmoidal curve. An increase in compliance is greatest in the mid-volume range (where VTs usually occur) and is the least at total lung capacity (top right of the curve) and low lung volumes (bottom left of the curve) near FRC or RV.


Resistance

Any fluid (air is considered a fluid) moving through a tube meets resistance to flow. Because of this resistance the pressure measured at the end of the tube will be less than the pressure measured at the beginning of the tube. This difference in pressure is related to both the resistance and the flow rate of the fluid (Table 6.3). Flow in tubes can be described as linear and turbulent. Variables that influence the pressure drop (and thereby resistance) across a tube during linear flow are the viscosity of the fluid and the length and radius of the tube. The influence of radius on resistance during laminar flow is profound. With a sufficient increase in flow rate in a tube (the critical flow rate), turbulent flow develops. With turbulent flow, all variables that influence the pressure drop during linear flow are in effect but, in addition, the density of the gas and square of the flow rate are important variables (Table 6.3) (1).


Figure 6.5 Static pressure-volume curve as an indication of compliance. The slope of the curve represents compliance. (A) Shows compliance of a normal lung, and (B) shows the compliance of a lung from a patient with acute respiratory distress syndrome. Both a and b show the change or lack of change in compliance with the addition of positive end-expiratory pressure (PEEP). The diseased lung (B) exhibits a more normal volume-pressure relationship following the application of PEEP. Source: Marcy TW, Marcini JJ. Inverse ratio ventilation in ARDS: rationale and implementation. Chest 1991; 100:494-504.


Figure 6.6 Effective compliance versus lung volume. Compliance is greatest in the mid-volume range, where tidal volumes (VT) usually occur. The increase in volume of a sigh normally remains in the range where compliance can still increase. Source: Rochon RB, Mozingo DW, Weigelt JA. New modes of mechanical ventilation. Surg Clinics N Am 1991; 71:843-57.


Airway Pressures

During negative pressure ventilation, the lung is subjected to little potential damage from pressure effects. Positive pressure ventilation, however, results in several airway pressure alterations that may yield beneficial effects (improved oxygenation and carbon dioxide removal) and detrimental effects (decreased cardiac output and lung damage). The airway
pressures that have received the most attention in surgical critical care are as follows: mean airway pressure ([P with bar above]aw), peak inspiratory pressure (PIP), the pressure at end inspiration (plateau pressure, Pplat), alveolar pressure (Palv), transpleural pressure (Ptrans), and positive pressure at the end of expiration (PEEP).


Figure 6.7 Pressures of the respiratory cycle during controlled mechanical ventilation. Source: Depuis YG. Ventilators: Theory and Clinical Application. St. Louis: Mosby Year Book, 1992.

[P with bar above]aw is the mean pressure monitored in the airway during the entire respiratory cycle. [P with bar above]aw is influenced by mean alveolar pressure, but is not a direct measurement, being influenced by such variables as inspiratory resistance as well as the inspiratory/expiratory time cycle. Despite this, [P with bar above]aw is a variable that can be linked to the oxygenation and cardiovascular effects of positive pressure mechanical ventilation. On average, as [P with bar above]aw increases, oxygenation improves and venous return decreases (7).

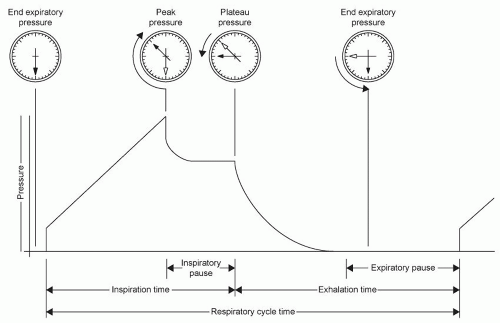
PIP is the maximum pressure generated in the airway during gas flow (Fig. 6.7). PIP can be influenced by compliance, airway resistance, VT, and the rate of flow of gas. Pplat is the pressure in the airway at the end of inspiration during a positive pressure VT, but before exhalation begins (inspiratory pause). Pplat (Fig. 6.7) is a measure of peak alveolar pressure. During the inspiratory pause, there is a drop from PIP as gas distributes from the upper to the lower airways. Pplat is mostly affected by total thoracic compliance (8).

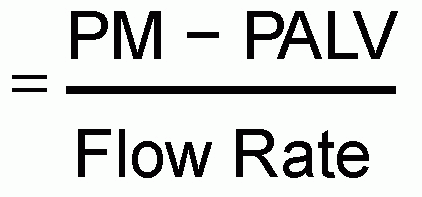
Palv is the pressure in the alveolus during the entire respiratory cycle. Palv is closely approximated by [P with bar above]aw in many clinical circumstances, especially when inspiratory and expiratory resistances are nearly equal and airway flow rates are low. At zero flow, [P with bar above]aw does equal Palv. However, during flow and especially when expiratory resistance is higher than inspiratory resistance, [P with bar above]aw will underestimate Palv, especially when minute ventilation is high. That is, when air meets more resistance leaving the alveolus than when air is brought to the alveolus, alveolar pressure will increase in proportion to the amount of air brought to the alveolus each minute (9).

The change of Palv during the respiratory cycle has a direct influence on pleural pressure (Ppl), which is also influenced by the compliance of the lung (CL) and chest wall (CW) (7).


Δ Ppl = Δ Palv × (CL/(CL + CW))

Ppl is inversely related to alterations in venous return. That is, an increase in Ppl will result in a decrease in venous return. Therefore, an increase in Palv in compliant lungs will
have a more significant effect on Ppl and venous return than an increase in Palv in non-compliant lungs (7). On the other hand, non-compliant lungs will develop less of an increase in pleural pressure and more of an increase in transpulmonary pressure (Ptrans) as Palv increases.

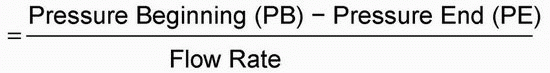
Ptrans is the pressure difference between the alveolus and the pleural space, as described by the following formula:


Ptrans = Palv − Ppl

As discussed in the section on “Ventilator-Induced Lung Injury,” Ptrans is an important feature of the risk of ventilator-induced lung injury (VILI) (10).

PEEP is pressure present in the airway at the end of expiration. PEEP is often applied to the ventilator circuit as part of ventilator management (external PEEP). In addition, disease states that result in a failure to return to passive FRC before the onset of the next inspiration (high expiratory resistance − dynamic hyperinflation), and ventilator settings that result in a similar phenomenon (increased inspiratory time to expiratory time ratio – I:E ratio) can result in increased alveolar pressure at the end of expiration (auto-PEEP). For patients on a ventilator, auto-PEEP may be present whenever the flow tracing shows flow at the end of exhalation. Total PEEP is the sum of externally applied PEEP and auto-PEEP. Measurement of end-expiratory occlusion pressure (the airway pressure at end-expiration with the expiratory port occluded) provides total PEEP. The difference between this and externally applied PEEP is auto-PEEP. Auto-PEEP can increase Paw and Palv in the same fashion as external PEEP and, therefore, has the same potential to influence hemodynamics and transalveolar pressure (8).


Work of Breathing

The work of breathing is performed to overcome airway resistance and the recoil of the lungs and chest wall (Table 6.4). Change in volume multiplied by the pressure difference forcing the change in volume equals work (1).

The work performed to stretch the lungs and chest wall becomes potential energy for expiratory work. Since the airway narrows during expiration, resistance increases, but normally not enough to inhibit expiration. With increasing resistance (i.e., bronchospasm), more work must be performed during expiration to raise the intrathoracic pressure above atmospheric pressure, which in turn compresses the airway.

The work of breathing may be measured in mechanical units or by oxygen consumed by the respiratory apparatus. Normally, the respiratory muscles consume <5% of total body oxygen. As expected, with increasing work, respiratory muscle oxygen demand increases (1).


Pulmonary Fluid

The physiology of the movement of intravascular fluid and protein into and out of the pulmonary interstitium has been well studied and is described by Starling’s equation:


Jv = Lp × A × [(Pc − Pt) – σ(πc − πt)]

Where Jv is the magnitude of fluid migration per unit of time; Lp is hydraulic conductance or the speed at which fluid can pass through the microvascular exchange barrier; A is the
surface area available for exchange; σ is the reflection coefficient, or the relative permeability of the microvascular membrane to plasma proteins; Pc is the plasma hydrostatic pressure; Pt is the interstitial hydrostatic pressure; πc is the plasma colloid oncotic pressure; πt is the interstitial colloid oncotic pressure (11, 12).


Table 6.4 Work of Breathing Variables


  • Airway resistance


  • Lung and chest wall compliance


  • O2 consumption and production


  • V/Q coordination


  • Hyperventilation


In the lung, as in other organs, the migration of fluid and protein, especially albumin, into the interstitial space is normal at the high pressure end of capillaries, is partially returned to the circulation as the hydrostatic pressure falls, but also returns to the circulation via the lymphatics. Interstitial and subsequent alveolar edema does not occur until the lymphatics are overwhelmed. Pulmonary lymphatics may be capable of removing several times the usual amount of interstitial fluid before edema develops. Pulmonary lymphatics appear to be more capable of this function than those that drain the systemic circulation (13, 14, 15).

Starling’s equation and the physiology of lymphatic drainage allow for several etiologies of pulmonary edema (Table 6.5) (12). The “true” hydrostatic pressure in the pulmonary capillary (Pcap) is determined by mean PA pressure and LAP or PAOP, as well as pulmonary arterial and venous resistance (see chap. 3) (16). While normal conditions allow an estimate of Pcap from a published formula, disease alters the listed variables sufficiently to preclude accuracy (Table 6.6). Measurement of Pcap is possible using the pulmonary artery tracing available through a pulmonary artery catheter. Disease will usually result in an increase in Pcap compared to PAOP (16), but the increase is not typically large, (i.e., <5 mm Hg).

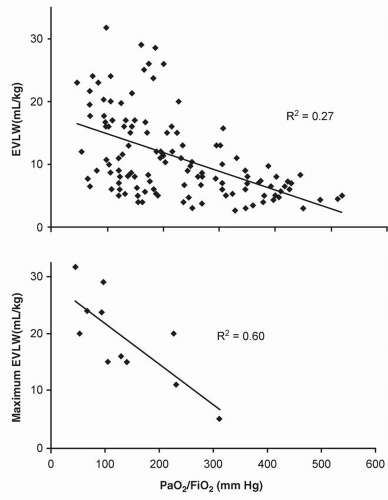
The most common etiology of an increase in Pc is left heart failure. When Pc is elevated, a good correlation between radiographic indices of increased lung water and hydrostatic pressure has been documented (Table 6.7). In addition, an increase in hydrostatic pressure (typically >20 mm Hg) can result in increased extravascular lung water (EVLW) that correlates well with deficits in oxygenation (Fig. 6.8) (16, 17, 18).


Table 6.5 Possible Etiologies of Pulmonary Edema


  • Increased pulmonary microvascular pressure


  • Decreased oncotic pressure


  • Increased capillary permeability


  • Obstructed lymphatics


Table 6.6 Common Etiologies of Pulmonary Arteriolar Constriction


  • Hypoxia


  • Hypercapnia


  • Bronchospasm


  • Pulmonary edema (any etiology)


  • Severe inflammation


  • Pulmonary embolism


Table 6.7 Radiographic Correlation Hydrostatic Pressure Increase in Normal Lungs


PCW


Radiographic Finding


<16-18


Normal


18-22


Cephalization


22-25


Perihilar haze


25-30


Periacinar rosette


>30


Dense alveolar infiltrates


Figure 6.8 The correlation between the change in extravascular lung water (EVLW) and the corresponding change in physiologic shunt (Qs/Qt). Source: From Ref. 17.

More controversial is the effect of low plasma oncotic pressure (πc) with normal hydrostatic pressure and normal pulmonary capillary permeability. Experimental data are conflicting, but human data do not support this as a principal etiology of lung water accumulation (12, 15, 16, 19, 20).

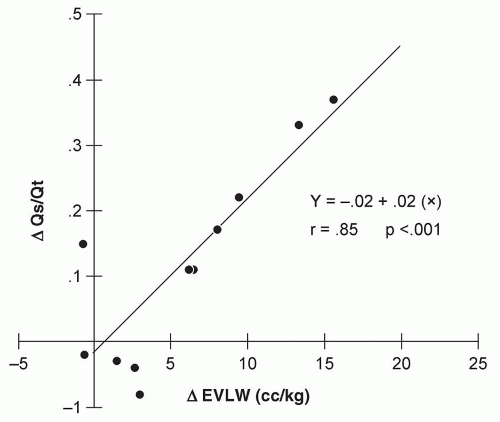
An increase in pulmonary capillary permeability as a mechanism of interstitial and alveolar fluid accumulation has been extensively investigated in both experimental and human models. In contrast to an increase in Pc, an increase in permeability (σ) does not result in a good correlation between EVLW and either radiographic or oxygenation alterations (Fig. 6.9) (21, 22, 23, 24, 25, 26, 27, 28, 29). As further discussed in the section “Effects of Systemic Inflammation on the Lung” EVLW contributes, but does not completely explain the pathophysiological alterations characteristic of permeability pulmonary edema. Therefore, management strategies differ from that employed when hydrostatic edema is the principal alteration.

The most common diseases obstructing lymphatics are malignancies that either invade the mediastinal lymphatics (lymphoma, metastatic lung cancer) or spread in the interstitium of the lung (breast cancer, leukemia). This form of pulmonary edema is usually unresponsive to common treatment but may improve if the malignancy is treated.


LUNG DYSFUNCTION

Surgical patients can suffer many threats to pulmonary function (Table 6.9). These threats can be cataloged into alterations that principally disturb chest wall mechanics (mechanical threats) and those that disturb alveolar gas exchange directly (alveolar threats). The alterations that are most problematic during surgical critical illness are emphasized in this section.


Effect of Hypoperfusion on the Lung

The main effect of hypoperfusion either to the entire lung or regions of the lung is an increase in physiologic VD. During systemic hypoperfusion, little alteration in oxygenation occurs. Once hypoperfusion has been reversed, the effect of the initiating insult (hemorrhage, abdominal sepsis) can become manifest, depending on the degree of the resultant systemic inflammation.


Effects of Systemic Inflammation on the Lung (Indirect ALI and Indirect ARDS)

Decreased alveolar lung function is characteristic of severe systemic inflammation. A marked increase in physiologic shunting and physiologic VD as well as a variable increase
in EVLW frequently result in the institution of mechanical ventilation for the conditions most often designated as ALI and/or ARDS. In 1994, publications the American-European Consensus Conference (AECC) on ARDS provided definitions for ALI and ARDS, in keeping with the recognition of the spectrum of lung malfunction that can accompany these insults (Table 6.10) (32).


Table 6.9 Etiologies of Diminished Lung Function During Surgical Critical Illness


  1. Atelectasis


    • Secretions


    • Hypoventilation


    • Airway obstruction


  2. Hypoventilation


    • Anesthesia


    • Narcotics


    • Supine position


    • Splinting-thoracic > upper abdominal > lower abdominal


    • Chest wall trauma


    • Obesity


  3. Lung Injury


    • Direct—local inflammation


      Contusion


      Aspiration


      Inhalation


      Near Drowning


    • Indirect—systemic inflammation


      Abdominal sepsis


      Pancreatitis


      Ischemia/reperfusion


      Multiple trauma


      Fat embolism


      Transfusion


      Urinary sepsis


      Extremity sepsis


      Cardiopulmonary bypass


  4. Lung Infection—local inflammation


    • Community-acquired pneumonia


    • Nosocomial pneumonia


  5. Thromboembolism


The etiologic mechanisms for ALI and ARDS were separated into direct and indirect (systemic) processes (Table 6.9), with lung infection included in the direct category. This separation has diagnostic, anatomic, and physiologic distinctions that can influence clinical activities such as the quest for a specific diagnosis; the administration of a specific therapy; the expected natural history. For instance, bilateral pulmonary contusions typically cause oxygenation deficits that begin to abate about 72 hours after injury. In contrast, the lung injury consequent to severe pancreatitis will usually parallel the severity and duration of the abdominal inflammation, features that are much less predictable.

The distinction of direct versus indirect lung injury has been shown to be associated with different lung pathology and physiology. For example, the “classic” pathological finding in ARDS is diffuse alveolar damage (DAD), but the magnitude and timing of DAD may be influenced by the injury pathway (33, 34). In addition, physiologic alterations such as an increase in static elastance (reciprocal of compliance) may have different lung and chest wall components depending upon the injury mechanism (34).

The indirect (systemic) mechanisms of ALI and ARDS result in migration of inflammatory cells to the lung as well as cell activation and tissue sequestration that is associated with alterations in endothelial cells, platelets, and pneumocytes. Many inflammatory mediators
have been linked to this process, gaining access to the pulmonary circulation in an endocrine fashion from the site of mediator stimulation and release (Table 6.11) (27, 35, 36, 37, 38). Of note, while PMN sequestration and activation appear to be a common pathological feature of DAD, the pathology and physiology of ARDS can be seen in neutropenic patients who do not show PMN accumulation (39). Such findings infer a redundancy to inflammatory stimulation and activation that diminishes the probability that attention to one aspect of the inflammatory response (e.g., TNF α antagonism) will result in a desired outcome.


Table 6.10 AECC Definitions of Acute Lung Injury and Acute Respiratory Distress Syndrome


  1. ALI


    • Acute onset


    • PaO2/FiO2 ≤300 mm Hg (regardless of PEEP)


    • Bilateral infiltrates on chest radiograph


    • PAOP ≤18 mm Hg when measured, or no clinical evidence of left atrial hypertension


  2. ARDS


    • Acute onset


    • PaO2/FiO2 ≤200 mm Hg (regardless of PEEP)


    • Bilateral infiltrates on chest radiograph


    • PAOP ≤18 mm Hg when measured, or no clinical evidence of left atrial hypertension


Table 6.11 Systemic Mediators of Acute Lung Injury and Acute Respiratory Distress Syndrome


  1. Cytokines


    TNF-α


    IL-1β


    IL-6


    IL-8


  2. Innate immunity components


    Complement activation


    Platelet activation


    PMN migration and sequestration


  3. Reactive oxygen species


    Ischemia/reperfusion


    Generation at local inflammation sites


DAD proceeds through a temporal sequence: exudative phase (days 1-7), proliferative phase (days 7-21), and fibrotic phase (after day 21). Each of these phases may overlap with others, even within a lung region, and are not strictly limited to these time frames.

The exudative phase is characterized by interstitial and intra-alveolar edema, dense eosinophilic hyaline membranes, endothelial cell injury, and intracapillary aggregates of neutrophils. There is extensive necrosis of type 1 pneumocytes. The loss of alveolar epithelial barrier allows free escape of interstitial fluid into the alveolus. The pulmonary microvasculature can exhibit thrombi, either of embolic or in situ origin. Of note is the markedly different magnitude of pulmonary cellular alterations in ALI and ARDS as compared to hydrostatic edema formation (40).

The proliferative phase is associated with growth of type 2 pneumocytes, fibroblasts and myofibroblasts, and the formation of granulation tissue. This results in alveolar duct and alveolar space fibrosis.

The fibrotic phase is seen in patients who survive beyond three to four weeks, whereby the lung is remodeled by the deposition of collagen. This can also result in fibrous obliteration of the microcirculation and persistent pulmonary hypertension (33).

Patients who show little resolution of lung and systemic inflammation during the exudative phase demonstrate a poor prognosis for lung improvement (27). Presumably, then, management strategies directed at limiting the magnitude and duration of the exudative phase of
ALI and ARDS can limit lung-related morbidity and mortality (see section on “Management of ALI and ARDS”).


Table 6.12 The Differentiation of Acute Respiratory Distress Syndrome from Hydrostatic Edema


  1. Clinical circumstances


    1. Systemic inflammation


    2. Known heart disease


  2. Physical examination


  3. Oxygenation impairment


  4. Chest CT


  5. Invasive hemodynamic monitoring


Diagnosis of ALI and ARDS

The potential etiologies of respiratory distress in surgical critical illness are numerous (Table 6.9). For surgical critical illness, the diagnostic evaluation for respiratory distress is incomplete if both direct and indirect ALI and ARDS are not included in the initial differential. While published diagnostic criteria for ALI and ARDS are important for clinical and experimental investigation, patients may not always meet these specifics at the onset of respiratory distress. Certainly, patients with direct causes of ALI and ARDS are more likely to exhibit early radiographic changes, but these may be delayed for patients with indirect injury. Therefore, it is important to consider indirect ALI and ARDS as a possibility, especially when the initial diagnostic steps (physical examination, chest x-ray, arterial blood gas data) are inconclusive.

When the diagnostic criteria are met, the most common diagnostic error is to misclassify the lung disturbance as secondary to hydrostatic pulmonary edema (the mechanism that accompanies congestive heart failure) and/or total body fluid sequestration (commonly termed “fluid overload”). Clinical and laboratory information that help distinguish a diagnosis are listed in Table 6.12.

Only gold members can continue reading. Log In or Register to continue

Stay updated, free articles. Join our Telegram channel

Jul 5, 2016 | Posted by in CRITICAL CARE | Comments Off on The Pulmonary System

Full access? Get Clinical Tree

Get Clinical Tree app for offline access