The Circulation


The Circulation


OXYGEN DELIVERY

Oxygen delivery to cells is vital for cell metabolic activity and constitutes the principle function of the cardiopulmonary organ system. Before discussing the cardiovascular component of oxygen delivery, a description of oxygen concentrations at the arteriolar, capillary, and cellular level as well as oxygen affinity for hemoglobin will be presented.


Blood Flow and Diffusion

Oxygen enters the arterioles at pO2 and hemoglobin saturation close to arterial levels, and the concentration thereafter usually diminishes as the distance along the arteriolar system and capillaries lengthens. The drop in pO2 and saturation is dependent upon the rate of oxygen extraction by the cells supplied by the arterioles and capillaries, but hemoglobin normally delivers oxygen to transcapillary tissues at a partial pressure of 5-30 mm Hg (1, 2, 3).

The diffusion of oxygen from the arterioles and capillaries to the cells is indirectly proportional to the distance of cells from capillaries. Therefore, an increase in the interstitial space may diminish oxygen concentration at the cellular level. Normal mitochondrial pO2 falls in the range of 4-20 mm Hg. However, mitochondria can function with a pO2 in excess of only 1 mm Hg (1). Thus, mitochondrial hypoxia is more likely a function of less oxygen reaching the arterioles and capillaries (diminished perfusion, decreased oxygen delivery to the capillaries) rather than diminished diffusion from the capillary to the cell (4).

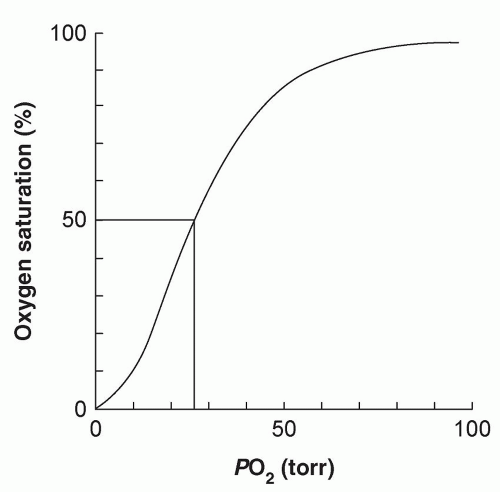
At the capillary level, oxygen release from hemoglobin is an important aspect of oxygen transfer to the interstitium and, subsequently, to cells. The relationship between hemoglobin saturation and oxygen tension is described by the oxyhemoglobin saturation curve (Fig. 3.1). The position of the oxyhemoglobin dissociation curve along the horizontal axis is described by the P50 value, the oxygen tension necessary to saturate 50% of the hemoglobin (normal, 26.3 mm Hg; adults at sea level) (5). The shape of the curve illustrates that less oxygen is released when pO2 drops at the higher level (60-100 mm Hg), but more oxygen is released at levels that develop in the capillary circulation (30-50 mm Hg). A shift of the oxyhemoglobin curve to the right (an increase in P50) results in more oxygen release (less oxygen affinity), whereas a shift to the left results in less oxygen release.

Several factors that cause right and left shifts are listed in Table 3.1 (5). 2, 3-Diphosphoglycerate (DPG), a product of erythrocyte glycolysis, is a major determinant and indirectly proportional to hemoglobin-oxygen affinity. DPG is diminished in stored red blood cells and the transfused blood takes more than 24 hours to regain its normal level. Low serum inorganic phosphate levels also result in DPG depletion. Importantly, hypothermia and metabolic alkalosis, commonly seen in critically ill surgical patients, increase hemoglobin oxygen affinity. Therefore, the use of fresh red cells, providing inorganic phosphate intravenously, reversing hypothermia, and correcting metabolic alkalosis, may improve oxygen delivery to the cells.


CARDIOVASCULAR SYSTEM

The major function of the cardiovascular system is to deliver oxygen to the tissues and remove byproducts of metabolism to their sites of elimination (lungs, kidneys, liver). The determinants of total body oxygen delivery are listed with other commonly measured or calculated hemodynamic variables in Table 3.2 (6). As can be seen from this formula, the pulmonary component is limited to providing adequate arterial oxygen saturation (≥90% at a PaO2 of >60 mm Hg). This is usually readily achieved with modern respiratory therapy. Hemoglobin frequently increases with transfusion, but during a critical illness, concerns about the adverse effects of blood transfusion have been associated with the commonplace acceptance of hemoglobin concentrations in the range of 7-8 gm/dL. Such a reduction in oxygen content (nearly 50% of normal for some patients) is usually well tolerated, indicating that for most surgical critical illness, the delivery
of oxygen to tissues is principally linked to blood flow, that is, cardiac output, rather than blood oxygen content (6, 7, 8, 9).


Figure 3.1 Characteristic oxyhemoglobin saturation curve.


Table 3.1 Factors Altering Hemoglobin-Oxygen Affinity


Decreased Affinity


Increased Affinity


  • Decreased pH


  • Increased temperature


  • Increased pCO2


  • Increased DPG


  • Increased pH


  • Decreased temperature


  • Decreased pCO2


  • Decreased DPG


  • Carboxyhemoglobin


Source: Adapted from Ref. 1.


The determinants of cardiac output can be organized both by the variables that affect ventricular function and those that affect venous return. Depending on clinical circumstances, the logical application of one such physiology (physio-logic) may be more suitable than the other, as described below.


Ventricular Physiology

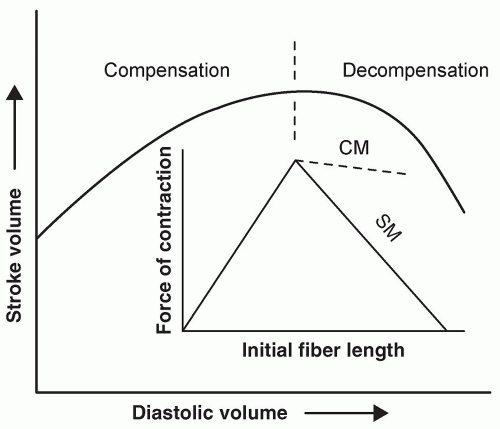
The major determinants of ventricular performance are listed in Table 3.3. Preload represents the magnitude of myocardial muscle stretch before contraction, the stimulus described by the Frank-Starling mechanism (Fig. 3.2), whereby increased stretch leads to increased contraction until the muscle is overstretched. Preload is most appropriately measured as end-diastolic volume (EDV) (10, 11). Since volume is not easily measured clinically, the direct proportion between ventricular volume and ventricular end-diastolic pressure (EDP) allows pressure measurement to estimate volume. As described in the section on “Confounding Variables,” the pressure-volume relationship (compliance) may change and make pressure measurements difficult to interpret.

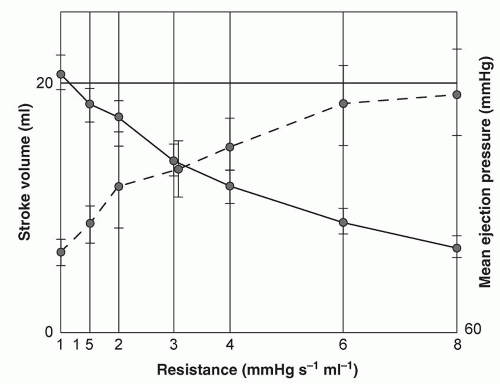
Ventricular afterload is determined primarily by the resistance to ventricular ejection present in either the pulmonary [pulmonary vascular resistance (PVR)] or systemic arterial tree [systemic vascular resistance (SVR)]. With constant preload, the increased afterload diminishes ventricular ejection, and decreased afterload augments ejection (Fig. 3.3).

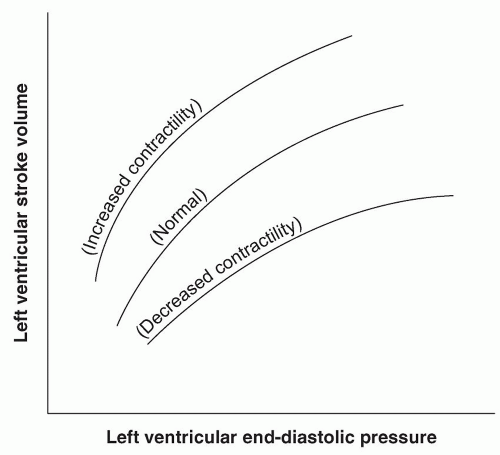
Contractility represents the force of contraction under conditions of a predetermined preload and/or afterload. Factors that can increase and decrease contractility are listed in Table 3.4. A change in contractility, like a change in afterload, will result in a different cardiac function curve (Fig. 3.4).


Table 3.2 Hemodynamic and Oxygen Delivery Variables (2)


Item


Definition


Normal


Central venous pressure (CVP)


CVP = RAP; in the absence of tricuspid valve disease, CVP = RVEDP


5-15 mm Hg


Left atrial pressure (LAP)


Left atrial pressure; in the absence of mitral valve disease, LAP = LVEDP


5-15 mm Hg


Pulmonary artery occlusion pressure (PAOP)


PAOP = LAP, except sometimes with high PEEP levels


5-15 mm Hg


Mean arterial pressure (MAP)


MAP = DP + 1/3 (SP – DP)


80-90 mm Hg


CI Cardiac index


CI = CO/m2 BSA


2.5-3.5 L/min/m2 BSA


SI Stroke index


SI = SV/m2 BSA


35-40 mL/beat/m2


SVR Systemic vascular resistance


SVR = (MAP – CVP) × 80/CO


1000-1500 dyne-sec/cm5


PVR Pulmonary vascular resistance


PVR = (MAP – PAOP) × 80/CO


100-400 dyne-sec/cm5


CaO2 Arterial oxygen content (vol%)


CaO2 = 1.39 × Hgb × SaO2 + (PaO2 × 0.0031)


20 vol%


C[V with bar above]O2 Mixed venous oxygen content (vol%)


C[V with bar above]O2 = 1.39 × Hgb × S[V with bar above]O2 + (P[V with bar above]O2 × 0.0031)


15 vol%


C(a – v)O2 Arterial venous O2 content difference


C(a – v)O2 = CaO2 C[V with bar above]O2 (vol%)


3.5-4.5 vol%


Oxygen delivery (O2D or DO2)


O2D = CO × CaO2 × 10; 10 = factor to convert mL O2/100 mL blood to mL O2/L blood


900-1200 mL/min


Oxygen consumption (O2C or VO2)


O2C = (CaO2 − C[V with bar above]O2) × CO × 10


250 mL/min 130-160 mL/min/m2


Abbreviations: BSA, body surface area (m2); CO, cardiac output; DP, diastolic pressure; LVEDP, left ventricular end-diastolic pressure; PaO2, partial pressure of oxygen, arterial; PAOP, pulmonary artery occlusion pressure; PEEP, positive end-expiratory pressure; P[V with bar above]O2, partial pressure of oxygen, mixed venous; RAP, right atrial pressure; RVEDP, right ventricular end-diastolic pressure; SaO2, arterial oxygen saturation; S[V with bar above]O2, mixed venous oxygen saturation; SP, systolic pressure; SV, stroke volume.


Table 3.3 Determinants of Ventricular Function


  • Preload


  • Afterload


  • Contractility


  • Heart rate


Figure 3.2 Schematic diagram of Starling’s law of the heart. The inset demonstrates the difference between cardiac and skeletal muscle, where cardiac muscle does not decompensate as rapidly with increasing stretch.


Figure 3.3 The decrease in stroke volume (black line), which develops secondary to an increase in resistance (dotted line).


Table 3.4 Factors Affecting Myocardial Contractility


Increased


Decreased


Catecholamines


Catecholamine depletion/receptor malfunction


Inotropic drugs


Alpha and beta blockers


Calcium channel blockers


Increased preload


Decreased preload


Overstretching of myocardium


Decreased afterload


Increased afterload


Severe systemic inflammation


Figure 3.4 Schematic representation of the cardiac function curve with different contractility states.


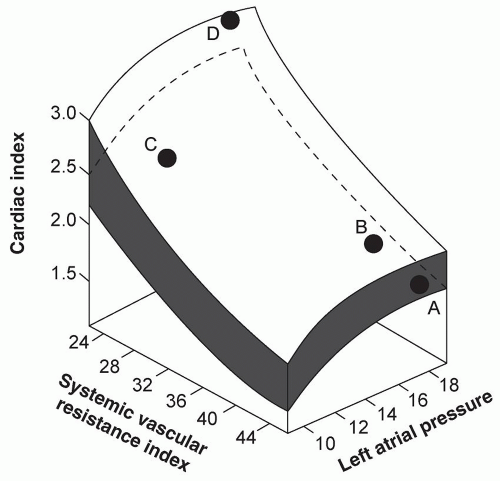
Figure 3.5 Schematic representation of the effects of inotrope (dopamine) administration and afterload reduction (nitroprusside) on cardiac index. Note that afterload reduction also reduced preload and augmentation of preload further increased cardiac index. A, control; B, dopamine; C, dopamine and nitroprusside; D, dopamine and nitroprusside and preload restoration.

The combined influence of increasing contractility and decreasing afterload to improve ventricular function is illustrated in Figure 3.5.

Heart rate is directly proportional to cardiac output (not cardiac muscle mechanics per se) until rapid rates diminish ventricular filling during diastole.


Right and Left Ventricular Differences

The differences in the structure and position of the right and left ventricles can influence the relative importance of each of the determinants of ventricular function listed above. The right ventricle’s initial response to increased afterload is an increase in contractility, called homeometric autoregulation. As afterload increases further, the RV can respond to endogenous catecholamines. Subsequently, the RV begins to dilate and augment function via the Frank-Starling mechanism. If this continues, the right ventricle eventually fails (output decreases as preload increases) and the left ventricle may consequently suffer from two mechanisms: diminished preload from poor right ventricular output, and diminished volume from leftward shift of the interventricular septum. Such a failure can be catastrophic (12, 13).


Vascular Resistance

The relationship between cardiac output and circulatory pressure is described by the formulae for systemic and pulmonary vascular resistance shown in Table 3.2. Resistance to flow in the systemic and pulmonary artery systems resides mostly in the arteriolar region. This is distinctly different from the venous system where resistance is primarily located in the large veins of the thorax and abdomen.

Arterial vascular resistance is the most common afterload against which the right and left ventricles must eject. Calculation and manipulation of vascular resistance are practical tools for hemodynamic assessment and management of critically ill surgical patients. Table 3.5 lists the common conditions that alter systemic and pulmonary vascular resistance. Note that disease may have variable effects upon the systemic circulation, but almost always increases pulmonary vascular resistance.


Table 3.5 Factors Affecting Vascular Resistance


Systemic


Increased


Decreased


Hypovolemia


Inflammation


CHF


Spinal cord injury


Cardiogenic shock


Very severe inflammation


Anaphylaxis


Hypocapnia


Hypercapnia


Vasoconstrictors


Vasodilators


Pulmonary


Increased


Decreased


Hypoxia


Vasodilators


Hypercapnia


COPD


Bronchospasm


Pulmonary edema


Inflammation


Pulmonary embolism


Pulmonary contusion


Pneumonia


Pneumothorax


PEEP


Venous Return

While the term venous return is used commonly, the determinants of venous return are rarely considered in clinical practice. As will be emphasized, in surgical patients, the physiol-logic of augmenting venous return can be more practical as a method of improving the circulation than the logic applied to ventricular function.

Venous return is linked to another important function of the venous system, that is, blood volume capacitance. About 70% of the blood volume is contained in the veins, with the splanchnic and cutaneous veins the largest reservoir regions. The splanchnic reservoir is the principle resource for acute mobilization of blood volume.

Total venous capacitance is the sum of the capacity of individual veins. Capacity is the volume contained in a vein at a specific distending pressure. Venous compliance is the change in volume (ΔV) of a vein secondary to a change in distending pressure (ΔP). Distending pressure (DP) is not the pressure within the lumen of the vein, but the difference between intraluminal and extraluminal pressure, such that DP is greater than zero if the pressure inside the lumen is greater than the pressure outside (14, 15).

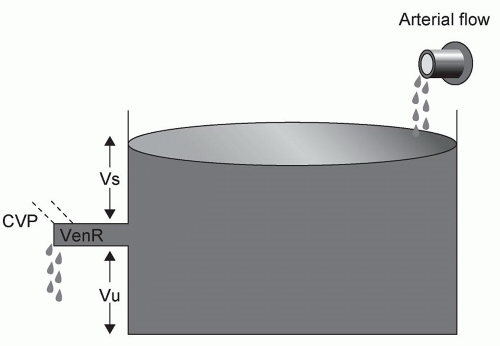
When DP is zero, the volume in a vein is designated as unstressed (Vu). When DP is greater than zero, the volume in a vein is called stressed (Vs). Under resting conditions, about 70% of the venous blood volume is in unstressed veins that serve the reservoir function, but the venous pressure that determines venous return is governed by Vs. The relationship between Vs and Vu and venous return is illustrated in Figure 3.6 (14).

Venous return (VR) is also described by the following formula: (15)


Where, MCFP = mean circulatory filling pressure, CVP = central venous pressure [right atrial pressure (RAP)], RV = venous resistance, and RA = arterial resistance.


Figure 3.6 Venous return stressed and unstressed volumes—the tub analogy. The water in the tub represents total venous volume and a hole in the tub divides the total volume into stressed (Vs) and unstressed (Vu) volumes. The water leaves the tub depending upon the diameter of the hole (representing venous resistance) and the height of the water above the hole (Vs). An increase in Vs results in an increase in flow. Vu does not affect flow. Moving the hole down (a relative increase in Vs compared with Vu) increases flow. This represents the effect of venoconstriction. CVP is the pressure at the end of the opening that inhibits flow through the tube. Source: From Ref. 14.

MCFP is the pressure in small veins and venules, which must be higher in the periphery than CVP so that blood can flow from the periphery to the thorax. RV is located primarily in the large veins in the abdomen and chest. RA is located mostly in the arterioles.

The principal factor determining MCFP is Vs, a variable directly influenced by blood volume (14, 15). Additional factors that alter venous return variables are listed in Table 3.6. This list shows that surgical patients frequently have diseases or therapeutic interventions that may inhibit venous return.


Physical Exam of the Circulation

For the surgeon, examination of the cardiovascular system (observing or measuring the parameters listed in Table 3.7) is used primarily to assess total body and regional perfusion. When perfusion is inadequate, then physical exam can provide an assessment of the likely etiology.


Total Body Perfusion

Measurement of the vital signs (systolic and diastolic blood pressure, pulse, respiration, temperature) is the first step of the physical examination. As evident in the calculations in Table 3.2, blood pressure is determined by both cardiac output (flow) and resistance. Frequently, a decrease in blood pressure indicates a decrease in cardiac output (hypoperfusion), especially when the neuroendocrine response to decreased flow causes increased vascular resistance. However, blood pressure may be in the normal range or elevated in the face of hypoperfusion, with conditions such as congestive heart failure (CHF), hypothermia, and in patients with underlying hypertension with a baseline pressure above the normal range. In addition, hypotension may be present during normal or augmented perfusion, such as that occuring in severe inflammation or spinal cord injury, when the reason for a lower pressure is a lower resistance rather than lower flow. Orthostatic hypotension (>20 mm Hg drop in systolic, >10 mm Hg drop in diastolic pressure) is more specific for intravascular volume depletion, but often difficult to obtain in surgical critical care settings.

Tachycardia is a more sensitive indicator of hypoperfusion and orthostatic stress but is less specific and can be a result of various other causes (i.e., anxiety, pain, temperature elevation, delirium). Respiratory rate and depth can be increased as a response to the acidosis of decreased oxygen delivery, but is also subject to other stimuli. Core temperature can be increased in hyperdynamic circulatory states and decreased with severe hypoperfusion (see below).


Table 3.6 Factors Altering Venous Return Variables


  1. Increased venous return


    1. Increased MCFP


      1. Increased vascular volume


      2. Decreased venous capacitance


      3. External compression


      4. Trendelenburg position


      (increased MSP in lower extremities and abdomen)


    2. Decreased CVP


      1. Hypovolemia


      2. Negative pressure respiration


    3. Decreased venous resistance


      1. Decreased venous compression


      2. Negative pressure respiration


  2. Diminished venous return


    1. Decreased MCFP


      1. Hypovolemia


      2. Vasodilation


    2. Increased CVP


      1. Intracardiac


        1. CHF


        2. Cardiogenic shock


        3. Tricuspid regurgitation


        4. Right heart failure


      2. Extracardiac


        1. Positive pressure respiration


        2. PEEP


        3. Tension pneumothorax


        4. Cardiac tamponade


        5. Increased abdominal pressure


    3. Increased venous resistance


      1. Increased thoracic pressure


        1. Positive pressure respiration


        2. PEEP


        3. Increased abdominal pressure


        4. Tension pneumothorax


      2. Increased abdominal pressure


        1. Ascites


        2. Bowel distention


        3. Tension pneumoperitoneum


        4. Intra-abdominal hemorrhage


        5. Retroperitoneal hemorrhage


        6. Edema from an abdominal inflammatory illness


        7. Edema from severe systemic inflammation


With mild-to-moderate hypoperfusion, patients often become restless and agitated, pulling at restraints, intravenous lines, and nasogastric tubes. Severe hypoperfusion can result in obtundation and coma.

Most commonly, hypoperfusion stimulates a neuroendocrine response that results in peripheral vasoconstriction and, consequently, pale to cyanotic and cool to cold extremities. Skin covering the patella is particularly sensitive to hypoperfusion and vasoconstriction here, resulting in “purple knee caps” that may be an early clinical sign of hypoperfusion. Skin temperature (cool vs. warm) may be particularly useful for identifying patients with a hyperdynamic circulation (warm extremities) (16).

Distended neck veins are consistent with impairment of cardiac function, but not always with CHF or cardiogenic shock (17). CVP elevation and neck vein distention may be secondary
to a force exerted outside the lumen of the right atrium (tension pneumothorax, pericardial tamponade, positive end-expiratory pressure (PEEP), prolonged expiration in chronic obstructive pulmonary disease (COPD)].


Table 3.7 Cardiovascular Physical Exam


Assessment of total body perfusion


  1. Blood pressure


  2. Pulse


  3. Respiration


  4. Core temperature


  5. Mentation


  6. Skin color and temperature


  7. Neck veins


  8. Heart examination


  9. Urine output


Assessment of regional (extremity) perfusion


  1. Pulse


  2. Color


  3. Temperature


  4. Pain


  5. Movement


Examination of the heart focuses on the quality of heart sounds (diminished sounds may represent pericardial fluid or shift of the mediastinum) and the presence or absence of murmurs and/or a gallop. Distinguishing an S3 gallop from an S4 may be difficult, especially with tachycardia. The distinction is important, however, since an S4 is common in patients aged 50 years and above and an S3 is quite specific but not very sensitive for a failing left ventricle (17, 18).

Urine output at least 0.5 cm3/kg/hr is usually considered an indication of adequate total body perfusion. Unfortunately, as described in the section on “Confounding Variables,” even this clinical tool must be evaluated with caution. Importantly, examination of the lungs and extremities for evidence of edema is not specific for cardiac dysfunction. As will be emphasized later, in surgical critical illness total body salt and water excess is commonly associated with, at best, a normal, but still too frequently, a decreased intravascular volume. Under these circumstances, relying on the lung or the periphery to draw conclusions about cardiac filling and function can be dangerously misleading.


Regional Perfusion

Physical examination evidence of regional hypoperfusion is limited primarily to the extremities. A painful, pale, pulseless, paralyzed, and cold extremity with paresthesia is diagnostic of acute arterial insufficiency. Chronic arterial insufficiency demonstrates loss of pulse, hair loss, dependent rubor, and sometimes loss of muscle mass. Acute venous obstruction, particularly in the iliofemoral region, may also cause decreased extremity perfusion. The lower extremity may be edematous and white (phlegmasia alba dolens) with little arterial compromise, or edematous and blue (phlegmasia cerulea dolens) with increased muscular pressure sufficient to diminish arterial circulation and cause tissue necrosis, often resulting in skin with fluid-filled bullae.

Physical examination alone is rarely sufficient to evaluate precisely other types of regional hypoperfusion (cerebral, gastrointestinal), but can contribute greatly to the overall clinical evaluation. For instance, evidence of sudden neurologic deficit consistent with middle cerebral artery occlusion or an unremarkable abdominal exam coexistent with severe abdominal pain may lead to the diagnosis of cerebral and intestinal infarction, respectively.

CONFOUNDING VARIABLES

Each of the hemodynamic monitors described above can provide misleading information because of improper technique, inadequate experience with the device, or because of physiologic changes that make the information difficult to interpret. This section will cover the common confounding variables in hemodynamic monitoring and suggest methods to diminish confusion.


Venous Pressure Monitoring (Table 3.10)

In contrast to arterial pressure monitoring, venous pressure monitoring (central venous, pulmonary venous, right atrial, left atrial) is subject to many confounding variables, including the lack of recognition of proper wave form, disregard for unphysiologic relationship between monitored variables, diminished ventricular compliance, and increased intrathoracic pressure.


Lack of Recognition of Proper Wave Form

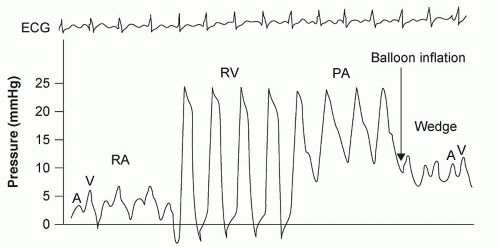
A normal right and LAP tracing demonstrates an increase in pressure corresponding to atrial contraction (A wave) followed by a second increase secondary to ventricular contraction (V wave) (Fig. 3.9). Catheters placed in the large thoracic veins and the occluded pulmonary artery should also demonstrate this picture, although commonly with some damping as compared to atrial placement. CVP, LAP, and PAOP should not be flat lines. With the loss of atrial contraction (atrial fibrillation, junctional rhythm), only the V wave, timed with ventricular contraction, will be recognized.

Only gold members can continue reading. Log In or Register to continue

Stay updated, free articles. Join our Telegram channel

Jul 5, 2016 | Posted by in CRITICAL CARE | Comments Off on The Circulation

Full access? Get Clinical Tree

Get Clinical Tree app for offline access