Sleep in the Ventilator-Supported Patient: Introduction
It is well recognized that sleep is abnormal in mechanically ventilated patients in the intensive care unit (ICU). Although this has been described for decades, there is still no consensus on the underlying pathogenesis and the best way to manage it. Moreover, the assumption that abnormal sleep is not good for patients who are critically ill is based primarily on extrapolation from models of sleep loss and sleep disruption in other patient populations and not on evidence that abnormal sleep affects the clinical outcomes of patients in the ICU. Nevertheless, there is growing interest in this topic as the technology to measure sleep evolves and new ways are sought to improve patients’ ability to recover from their critical illness. This chapter outlines the current understanding of the causes and potential consequences of sleep disruption in ventilator-supported patients and how this may be further researched and treated.
Normal Sleep
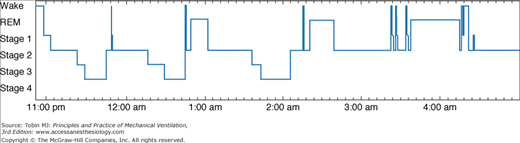
Sleep is objectively assessed by means of polysomnography, the simultaneous recording of several electroencephalographic and physiologic parameters.1 Sleep periods are classified as non–rapid eye movement (NREM) and rapid eye movement (REM) sleep. NREM sleep is further subdivided into four stages, with stages 3 and 4 also referred to as slow-wave sleep (SWS). Each sleep stage is recognized by characteristic changes on the electroencephalogram and, in addition, REM sleep has distinctive, intermittent rapid eye movements. During normal sleep, periods of NREM and REM alternate throughout the night in a recognizable pattern, so that most SWS occurs during the first half of the night and most REM sleep occurs during the second half (Fig. 57-1). The “normal” duration of sleep required and the proportion of time spent in each stage of sleep depends on many factors including age and genotype.2 In healthy, middle-aged individuals, however, nocturnal sleep lasts 7 to 8 hours, and 5% to 10% of that time is spent in stage 1 NREM sleep, 50% in stage 2 NREM sleep, 15% to 20% in SWS, and 25% in REM sleep.1 There are also standardized electroencephalographic criteria for identifying arousals and awakenings on the polysomnograph;3,4 up to 10 arousals per hour of sleep is considered to be within normal limits.5 The term sleep architecture refers to the amount of time spent in each sleep stage and sleep disruption is reflected by an increased frequency of arousals and awakenings.
Sleep in the Intensive Care Unit
When questioned after discharge from the ICU, patients consistently report sleep disruption during their stay.6–11 In one study,10 200 patients from four different ICUs received questionnaires that evaluated the quality of their sleep at home and in the ICU and the effect of noise and a variety of activities (such as nursing interventions, phlebotomy, and diagnostic procedures) on their sleep quality. Sleep quality in the ICU was perceived as significantly poorer than sleep quality at home. In addition, sleep quality did not change significantly over the course of the ICU admission, and no differences were reported between ICUs or between ventilated and nonventilated patients. Ventilated patients, however, reported greater daytime sleepiness, perhaps because of the greater administration of sedatives or more severe illness. Patients selected the recording of vital signs and phlebotomy as the most sleep-disrupting environmental factors. Noise was not rated as the primary cause of sleep disruption; of the many forms of environmental noise stimuli, however, communication between staff members and telemetry alarms were perceived as the most disruptive. Although very thorough in design and statistical analysis, the study was limited by potential recall bias, lack of objective sleep assessment by polysomnography, and the absence of a control group.
Since the mid-1970s, numerous polysomnographic studies in ICU patients have consistently revealed both sleep fragmentation and sleep loss.6,12–19 Hilton6 studied nonventilated patients by 24-hour polysomnography and found a decreased total sleep time, an increase in stage 1 NREM sleep, and a concomitant decrease in SWS and REM sleep. Hilton also observed an apparent uncoupling of sleep from the day–night circadian pattern: Only 50% to 60% of sleep occurred at night.6 These characteristic sleep patterns have also been observed in subsequent 24-hour polysomnography studies.12,16,20
Cooper et al investigated sleep in ventilated patients in the ICU and categorized patients into three groups based on polysomnographic findings: disrupted sleep, atypical sleep, and coma.12 As seen in other ICU cohorts, patients in the disrupted sleep group (Fig. 57-2) showed the abnormal temporal distribution of sleep described earlier as well as reduced amounts of SWS and REM sleep and an increased frequency of arousals and awakenings. Patients in the atypical sleep group had electroencephalogram (EEG) features intermediate between sleep and coma, characterized by a virtual absence of stage 2 NREM sleep and REM sleep (Fig. 57-3). In addition, patients displayed “pathologic wakefulness,” where behavioral correlates of wakefulness (such as saccadic eye movements and sustained chin muscle activity) coincided with EEG features of SWS (Fig. 57-4). The coma group was characterized by EEG features of coma according to the classification of Young et al.21 The authors concluded that sleep could not be identified by polysomnography in all critically ill patients. They proposed the following criteria to select ICU patients in whom sleep can be reliably measured by polysomnography: acute physiology score less than 13, Glasgow Coma Scale score greater than 10, and sedative doses of lorazepam equivalents and morphine equivalents less than 10 mcg/kg per hour. These cutoffs approximated the point estimate of the atypical sleep group. Subsequent data suggest that sleep disruption can be measured by polysomnography in approximately 50% of patients in a general ICU.22
Figure 57-2

Disrupted sleep in the ICU (24-hour hypnograms in eight patients). Vertical axis: REM, rapid eye movement sleep; NREM, non–rapid eye movement sleep stages 1, 2, 3, and 4. Horizontal axis: Time in hours. Note (1) sleep was distributed throughout the 24-hour period in all patients except patient 8, in whom sleep was predominantly nocturnal; (2) frequent awakenings; and (3) prolonged wakefulness, especially patients 4, 5, and 6. (Reproduced, with permission, from the American College of Chest Physicians, from Cooper AB, Thornley KS, Young GB, et al. Sleep in critically ill patients requiring mechanical ventilation. Chest. 2000;117:809–818.)
Figure 57-3

Atypical sleep in the ICU (24-hour hypnograms in five patients). Vertical axis: REM, rapid eye movement sleep; NREM, non–rapid eye movement sleep stages 1, 2, 3, and 4; sleep delta (SD); pathologic delta (PD); and pathologic wakefulness (PW). Horizontal axis: Time in hours. (Reproduced, with permission, from the American College of Chest Physicians, from Cooper AB, Thornley KS, Young GB, et al. Sleep in critically ill patients requiring mechanical ventilation. Chest. 2000;117:809–818.)
Figure 57-4
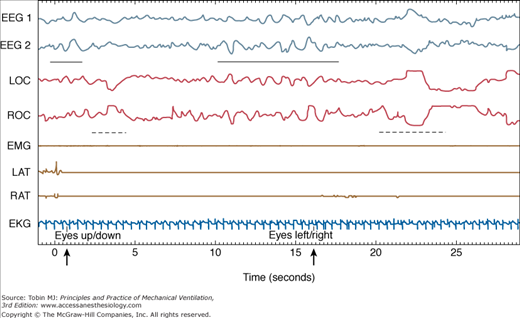
Pathologic wakefulness during atypical sleep (30-second epoch). Vertical axis: EEG, electroencephalogram; EKG, electrocardiogram; EMG, submental electromyogram; LAT, left anterior tibialis EMG; LOC, left oculogram; RAT, right anterior tibialis EMG; ROC, right oculogram. Horizontal axis: Time in seconds. Note the slow-wave EEG activity (indicated by the solid horizontal bar) during the patient’s responses (eye movements, indicated by broken horizontal lines) to biocalibration (indicated by a bold arrow). (Reproduced, with permission, from the American College of Chest Physicians. Cooper AB, Thornley KS, Young GB, et al. Sleep in critically ill patients requiring mechanical ventilation. Chest. 2000;117:809–818.)
Once polysomnography has been performed, what is the most reliable way to score sleep in the ventilator-supported patient? Sleep is conventionally assessed by manual scoring of the EEG according to the criteria of Rechtschaffen and Kales.4 The reliability, however, of this methodology to score sleep in the critically ill patient has been questioned.23 Ambrogio et al compared manual scoring of sleep in fourteen ventilator-supported patients in the ICU and seventeen age-matched ambulatory patients in the sleep laboratory and reported that interobserver and intraobserver reliability was weaker for critically ill patients (k = 0.52 ± 0.23) than for those in the sleep laboratory (k = 0.89 ± 0.13; P = 0.03). Furthermore, they suggested that computer-based spectral analysis of the EEG with fast Fourier transformation is a better way to monitor sleep in this patient population. It appears that improved and innovative analysis of the EEG holds the best promise for further progress, particularly because less-invasive methodologies to monitor sleep such as assessment by the bedside nurse and actigraphy, are unreliable (Fig. 57-5).24–26
Figure 57-5

Total sleep time (total duration of sleep during the recording period), sleep efficiency (total sleep time expressed as a percentage of total recording time), and the number of awakenings during the recording period estimated by actigraphy (customized setting shown) and nurse assessment compared with polysomnographic findings. (Used, with permission, from Beecroft et al.26)
Causes of Sleep Disruption in the Intensive Care Unit
Patients may enter the ICU with preexisting medical or sleep disorders, such as asthma or sleep apnea, which cause disruption of sleep if inadequately controlled. More importantly, the acute illness that precipitated the ICU admission, such as major surgery, can disrupt sleep. A very consistent finding in surgical patients is the reduction or absence of both SWS and REM sleep in the immediate postoperative period. This is characteristically followed by “REM rebound,” an increase in both the number of phasic eye movements and the overall amount of REM sleep.13,15,18,19 REM rebound may result from the withdrawal of REM-suppressing medications, such as narcotics,18 analgesics, and benzodiazepines,27 and/or a decrease in illness-related sleep disruptors such as pain.
Several medications can alter sleep. A comprehensive review of this topic has been published.27–29 Table 57-1 summarizes the effects of some medications that are commonly used in the ICU. Although benzodiazepines can increase total sleep time, they are known to reduce both SWS and REM sleep and are associated with rebound insomnia once they are stopped.30 Opiates also decrease SWS and REM sleep, increase the amount of wakefulness after sleep onset, and are associated with withdrawal hypersomnolence.27,30,31 Glucocorticoids are often associated with insomnia29 and many selective serotonin reuptake inhibitors increase alertness and restlessness, in addition to exacerbating sleep disorders such as restless leg syndrome and periodic limb movement disorder.32
| Medication | Clinical Effects | Changes on Polysomnography |
|---|---|---|
| CNS medications | ||
| Narcotics | Varies with agent; withdrawal hypersomnolence | Acute: ↑WASO, ↓SWS, ↓REM |
| Benzodiazepines | Sedation, withdrawal insomnia | ↑TST, ↓SL, ↓W, ↓SWS, ↓REM |
| Tricyclic antidepressants | Improve sleep; may be sedating | Generally ↑TST, ↓W, ↓REM |
| Selective serotonin reuptake inhibitors | May worsen sleep; few daytime complaints | Generally ↓TST, ↑W, ↓REM |
| Barbiturates | Sedation, withdrawal insomnia | ↑TST, ↓W, ↑ ↓SWS, ↓REM |
| Phenytoin | Sedation | ↓SL |
| Carbamazepine | Sedation | ↓SL and ↑TST |
| Cardiac medications | ||
| β-antagonists | Insomnia, nightmares | ↑W, ↓REM |
| α2-agonists (clonidine, methyldopa) | Insomnia, nightmares, sedation | ↑TST, ↑↓REM |
| αβ-antagonists | Insomnia, fatigue, somnolence | No studies |
| Diltiazem | Insomnia, abnormal dreams, sleepiness | No studies |
| Amiodarone | Insomnia, nightmares | No studies |
| Other medications | ||
| Aspirin | — | Acute: ↓SWS |
| Glucocorticoids | Insomnia | ↑W, ↓REM |
| Theophylline | Insomnia | ↑W, ↓TST |
Almost all biologic functions have a circadian rhythm, which synchronizes interactions both among themselves and with the external environment. Alteration of the circadian rhythm that regulates sleep and wakefulness is a recognized cause of insomnia in patients who are not critically ill33 and may contribute to sleep disruption in the ICU. The circadian clock has been evaluated in critically ill patients by measuring either core body temperature or melatonin levels in the blood or urine. Two retrospective studies, which measured core body temperature, found that circadian rhythm was absent in 20% to 80% of patients.34,35 Gazendam et al36 recorded core body temperature in twenty-one patients and reported that a 24-hour rhythm was detectable in all patients. The rhythm, however, was advanced or delayed by several hours compared with control subjects, and the degree of displacement was correlated with the severity of illness, reflected by Acute Physiology and Chronic Health Evaluation (APACHE) III scores. Several studies have measured melatonin levels in ICU patients.37–41 Melatonin is secreted by the pineal gland and its release is closely synchronized with sleep in healthy individuals;42 it starts to rise between 9 and 11 PM, peaks between 1 and 3 AM, and falls to low baseline values between 7 and 9 AM. The characteristic nocturnal rise in melatonin is absent in critically ill patients, and this has been correlated with the use of mechanical ventilation,40,41 sepsis,39 and the postoperative period.38 Although altered circadian rhythm may contribute to sleep disruption in the ICU, this has yet to be proven. Moreover, the extent of its role is likely to vary among individual patients depending on factors such as the ICU environment, illness severity, the length of stay, and the impact of competing sources of sleep disruption.
Several studies have examined the role of light, patient-care activities, and noise in causing sleep disruption in the ICU.43–49 Meyer et al47 found that circadian light levels were maintained in the ICU, and modern ICUs minimize light intensity at nighttime. Consequently, light does not appear to be a significant source of sleep disruption. Nursing interventions occur at least hourly in the ICU47 (Fig. 57-6), and have been associated with arousals.13 The presence of excessive noise in the ICU has been thoroughly documented.43,46–49 Aaron et al observed a strong correlation between the number of sound peaks of greater than 80 A-weighted decibels and arousals from sleep in a group of ICU patients.48 Balogh et al reported that alarms were the most irritating noise, and observed that even during the night, the longest “quiet” interval was only 22 minutes.46
Figure 57-6

Patient interruptions by staff over 24 hours in four areas: a three-bed medical ICU, a three-bed respiratory care unit (BRCU), a single respiratory care unit room (SRCU), and a private room (PR) on a general medical floor. The dark areas represent interruptions and the clear areas represent time available for sleep. (Reproduced, with permission, from the American College of Chest Physicians. Meyer TJ, Eveloff SE, Bauer MS, et al. Adverse environmental conditions in the respiratory and medical ICU settings. Chest. 1994;105:1211–1216.)
Another investigative approach has been to simulate the noisy ICU environment in a controlled setting such as a sleep laboratory. Exposure of healthy subjects in a sleep laboratory to recorded ICU noise–induced sleep disruption similar to that observed in patients in the ICU.44,45,49 These studies in the ICU and sleep research laboratory led to the assumption that sleep disruption in the ICU was predominantly caused by noise and patient-care activities. The ICU studies, however, did not include simultaneous monitoring of noise and arousals. Consequently, the association was, at best, indirect. Furthermore, the simulated ICU environment is limited by the fact that it evaluates the impact of noise in isolation without the interaction of other competing sleep disruptors that are found in the ICU. Consequently, the role of the ICU environment, specifically noise and patient-care activities, were reassessed. Freedman et al,50 using polysomnography and time-synchronized recording of environmental noise, directly linked noise to arousals. They determined that noise was responsible for only 15% of all arousals and awakenings. Although it was the first study to demonstrate that common noise elevations directly cause arousals in ICU patients, other environmental factors such as patient-care activities were not assessed.
Gabor et al subsequently evaluated the contribution of the ICU environment to sleep disruption in both ventilated patients and healthy subjects, and also evaluated the effectiveness of a noise-reduction strategy (moving the subject from the open ICU to a single room).51 They performed comprehensive, synchronized monitoring of sleep by polysomnography, noise (calibrated sound meter), and all patient-care activities (audiovisual recording) for 24 hours. Although loud noise and frequent patient-care activities were prevalent in the ICU environment, they were responsible for less than 30% of the observed sleep disruption (Fig. 57-7). Healthy individuals slept relatively well in this potentially disruptive environment. Although noise accounted for a significant proportion of sleep disruption in this group, its extent was not pathologic. A quantitative improvement in sleep quality was observed as a result of noise reduction; however, there was no change in sleep architecture. The cause of 68% of arousals and awakenings in these mechanically ventilated patients could not be attributed to noise or any patient-care activity (Table 57-2).
Figure 57-7

Polysomnographic example of a noise-induced arousal. Vertical axis: EEG, electroencephalogram; EMG, electromyogram; LOC, left oculogram; ROC, right oculogram. Horizontal axis: Time in seconds. Arrow
Related posts:


Stay updated, free articles. Join our Telegram channel

Full access? Get Clinical Tree


