CHAPTER 5 Role of the Cardiovascular System in Coupling the External Environment to Cellular Respiration
Cardiovascular Function and Pulmonary Gas Exchange
Cardiac function is important to O2 exchange in the lungs in many ways. First, total pulmonary blood flow, which is normally equal to cardiac output, affects PO2 of venous blood entering the lungs. Although in health this is of little significance, it is of major importance in disease. Second, the relationship between total pulmonary blood flow and the volume of blood in the pulmonary capillaries determines red blood cell exposure (or transit) time in the lungs. In resting normal humans, transit time is much greater than what is needed; this may not be the case during exercise or in disease. Third, the distribution of pulmonary blood flow among the 300 million alveoli cannot be perfectly matched to the ventilation of the alveoli. This causes ventilation-perfusion ( ) mismatch, which interferes with arterial oxygenation. This
  mismatch is of little consequence in health, but is of major importance in disease of the cardiopulmonary system. Fourth, any dysfunction of the left ventricle that increases diastolic filling pressure has the potential for causing pulmonary edema, especially if pulmonary capillaries have been damaged by disease. Pressures are sufficiently low in health that edema does not occur at rest. With heavy exercise, mild interstitial edema can occur, but the effects are subtle. The importance of left ventricular dysfunction increases dramatically when filling pressures exceed 20 to 25 mm Hg.1 Pulmonary microvessels may undergo a degree of physical disruption at very high vascular pressures.2 Fifth, right ventricular hypertrophy from pulmonary diseases can impair left ventricular function, effectively decreasing left ventricular compliance through mechanical interdependence of the heart chambers. These five concepts are now discussed.
Total Pulmonary Blood Flow and Oxygen Exchange
Pulmonary O2 exchange under steady-state conditions obeys mass balance principles. Corresponding equations can be written to describe O2 uptake from respired air and into the pulmonary circulation.3 These equations are:
where  , an unimportant difference.
In healthy lungs, alveolar PO2, which is proportional to FAO2 in Equation 1, is tightly related to CaO2 in Equation 2 by the O2-hemoglobin (Hb) dissociation curve. CaO2 can be directly computed using alveolar PO2 and the O2-Hb dissociation curve.4 This is not true in lung disease, where for Equation 1, FAO2 is mean alveolar [O2] averaged over the 300 million alveoli, weighted by the ventilation of each, and CaO2 is arterial [O2], similarly averaged but weighted by blood flow to each of the alveoli. When ventilation or blood flow is distributed in a nonhomogeneous manner in lung disease, the PO2 corresponding to mean alveolar gas is often much higher than that of arterial blood corresponding to CaO2. CaO2 cannot be accurately calculated from FAO2 and the O2-Hb dissociation curve.
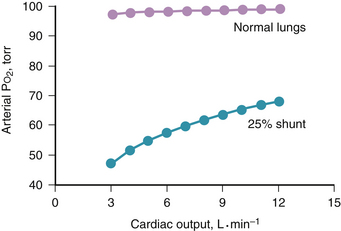
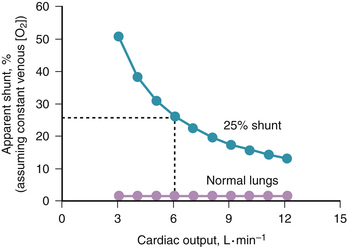
The contribution of such regions to arterial blood, being tightly coupled to mixed venous [O2], is closely dependent on cardiac output. The end result is more severe arterial hypoxemia as cardiac output decreases, and less severe hypoxemia as cardiac output increases. This situation is illustrated in Figure 5-1, in which a normal lung and a lung containing as an example of disease a 25% right-to-left shunt are compared as cardiac output changes. Arterial O2 saturation, a better reflection of the O2 concentration of the blood, follows changes in PO2 (Fig. 5-2). Mixed venous PO2 (Fig. 5-3) changes similarly in both cases according to Equation 2, but arterial PO2 and O2 saturation vary with cardiac output only in the abnormal lung. The clinical message is clear—the degree of arterial hypoxemia in a given patient depends not only on how much shunt or  mismatch is present, but also on cardiac output. If arterial PO2 were to decrease in such a patient, changes in cardiac output should be excluded if the arterial PO2 change is to be interpreted as a change in health of the lung. Application of the classic shunt or venous admixture equation5,6 illustrates this principle dramatically:
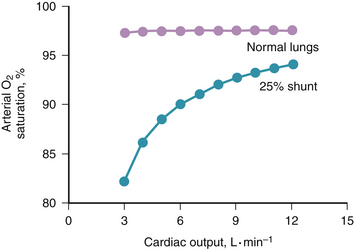
Figure 5-2 Effect of cardiac output on arterial oxygen saturation, from the same calculations as used in Figure 5-1. Saturation varies considerably with cardiac output in diseased, but not in normal, lungs.
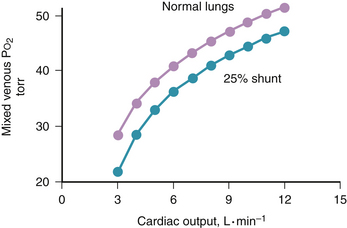
Figure 5-3 Change in mixed venous PO2 with cardiac output for the conditions of Figures 5-1 and 5-2. Mixed venous PO2 changes similarly with cardiac output in health and disease. Absolute PO2 is slightly higher in health at a given cardiac output.
When  ) would be about twice the actual value when cardiac output is reduced by 50%, and half the real value when cardiac output is doubled if venous [O2] is assumed to be at normal levels.
Pulmonary Transit Time
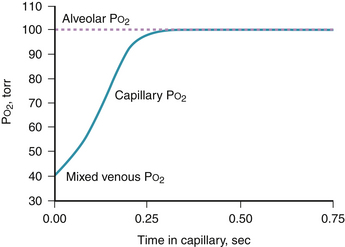
The preceding section assumes sufficient time for O2 to equilibrate fully across the blood gas barrier; that is, PO2 in the capillary blood has increased from mixed venous levels all the way to alveolar PO2 within the available red blood cell contact time. Average red blood cell contact time normally appears to be about 0.75 second. This estimate is the ratio of resting capillary blood volume (75 mL, measured by the carbon monoxide technique7) to the corresponding cardiac output (6 L • min−1). Figure 5-5 indicates the normal PO2 profile calculated along the pulmonary capillary and shows full equilibration in about 0.25 second, leaving 0.5 second in reserve.8 Although transit times in different alveoli are not uniform,9 the variance in such times is still small enough that full equilibration occurs at rest, even in channels with the shortest transit and even during moderate exercise. Only during heavy exercise does failure of equilibration occur in healthy individuals.10 At high altitudes, diffusion limitation is seen with even light to moderate exercise and becomes a major factor reducing arterial [O2] under such conditions.11
In cardiopulmonary diseases, diffusion limitation in the lung rarely occurs, even when patients are well enough to exercise. The exception is interstitial pulmonary fibrosis. Here, diffusion limitation is usually seen during exercise, which aggravates hypoxemia.12 Diffusion limitation can also occur at rest in such patients.13 Pulmonary diffusing capacity must be less than about 60% of normal, however, before diffusion limitation is seen because of previously described reserves in red blood cell transit time.13 Hypoxemia in cirrhosis of the liver seems to have a small component of diffusion limitation as well.
In severe cardiopulmonary diseases, such as acute pulmonary edema from left ventricular failure or acute respiratory distress syndrome, conditions develop that reduce O2 diffusing capacity. In particular, the normally thin (0.5-μm) blood-gas barrier separating alveolar gas from capillary blood can become edematous; however, it is thought that this does not produce measurable O2 diffusion limitation. In more advanced disease, there is alveolar filling with edema fluid, cellular debris, or both, which abolishes all ventilation of affected alveoli and produces what is more commonly termed shunt (i.e., perfusion of unventilated alveoli). It could be argued that such alveoli are completely diffusion-limited because no O2 exchange occurs at all. This becomes a semantic issue and should not detract from the more important problem of understanding the pathologic and physiologic changes that occur with these diseases.
Distribution of Blood Flow within the Lungs
In normal lungs, output from the right ventricle is not equally distributed among the 300 million alveoli. Gravity affects blood flow distribution; more blood flows through dependent than nondependent alveoli because of the weight of the blood.14 There are nongravitational influences on blood flow distribution as well. The fractal branching nature of the vascular tree produces nonuniform distribution,15 and the lack of perfect anatomic symmetry perturbs flow patterns further.16 There may also be greater perfusion of central (proximal) than peripheral (distal) lung regions,17 although this has not been resolved. As a result of all of these independent sources of nonuniformity, a substantial degree of nonhomogeneous blood flow distribution exists. It seems, however, that the distribution of ventilation is largely matched to that of blood flow, so that ventilation and blood flow are each greatest and least in the same areas.18 This matching is imperfect, but interferes only trivially with O2 transport in the normal lung. If the ideal lung produces an arterial PO2 of 100 mm Hg, the real lung in young healthy subjects produces an arterial PO2 of 90 to 95 mm Hg. Because of the flat O2-Hb dissociation curve at this PO2, the effect on arterial [O2] of this 5- to 10-mm Hg decrease is negligible.
or
where CC′O2 is the standard term for end-capillary [O2] in a local lung region.
In cardiopulmonary disease, areas of low or zero  ratio of nonembolized alveoli and is a primary reason for hypoxemia when it occurs in such patients.24
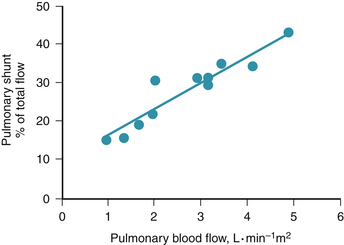
Of particular relevance to cardiovascular state in the context of pulmonary gas exchange is a curious, poorly understood, but reproducible phenomenon whereby, as total blood flow through the lung (usually cardiac output) increases or decreases, so too does fractional shunt or venous admixture.25 Figure 5-7 is a dramatic example of this phenomenon in a patient with lung disease on variable right heart bypass.26 As pulmonary blood was mechanically varied from 1 to 5 L/(min • m2), percentage of shunt increased from 15% to 40% of the cardiac output. To underline the magnitude of this effect, absolute shunt perfusion increased from 0.15 L/(min • m2) to greater than 2 L/(min • m2), a more than 10-fold increase. Because these changes are rapidly reversible within minutes, it seems unlikely that the greater blood flow is actually causing more damage and shunt on this basis.
There is probably some systematic change in blood flow distribution between ventilated, normal regions and the unventilated alveoli causing the shunt to change with total blood flow.27 This change generally occurs regardless of the anatomic distribution of disease and seems to be unrelated to lung structure in any systematic way. Numerous animal studies done under many circumstances mirror the human experience, regardless of whether the cardiac output is manipulated mechanically or pharmacologically.28
Stay updated, free articles. Join our Telegram channel

Full access? Get Clinical Tree


 , F
, F regions decrease because such pathways essentially fail to oxygenate flowing blood above mixed venous levels.

 regions of the lung.
 at this level and setting Equations 1 and 2 equal to one another yields a new relation:

 ratio and the so-called boundary conditions (i.e., the inspired and mixed venous O2 levels). A third factor implicit to Equation 4 is the P
 ratios are major factors in gas exchange and in arterial oxygenation.
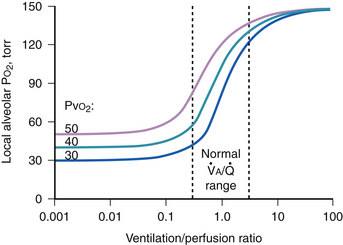
 ratio is reduced below normal, alveolar P