Proportional-Assist Ventilation: Introduction
Proportional-assist ventilation (PAV) is a form of synchronized ventilator support in which the ventilator generates pressure in proportion to instantaneous patient effort (Fig. 12-1).1 The ventilator simply amplifies inspiratory efforts. Unlike other modes of partial support, there is no target flow, tidal volume, or ventilation or airway pressure. Rather, PAV’s objective is to allow the patient to comfortably attain whatever ventilation and breathing pattern his or her control system desires.1 The main operational advantages of PAV are automatic synchrony with inspiratory efforts and adaptability of the assist to changes in ventilatory demand (Fig. 12-1).
Basic Principles and Algorithms: How Can a Ventilator Deliver Pressure in Proportion to Patient Effort Without Directly Measuring Effort?
A simple PAV delivery system illustrates how this happens (Fig. 12-2).2 Alveoli and chest wall are represented as an elastic compartment that opposes expansion. Elastic recoil pressure (Pel; hatched arrow in Fig. 12-2) is a function of how much lung volume deviates from passive functional residual capacity (FRC) and the stiffness of the system: Pel = V × E, where V is volume above FRC and E is respiratory system elastance. In a passive system, Pel increases alveolar pressure as the lung is artificially inflated. During assisted ventilation, inspiratory muscles are active. These muscles decrease alveolar pressure by an amount corresponding to their pressure output (Pmus) (Fig. 12-2). At any instant, alveolar pressure (Palv) is the difference between Pel (V × E), which tends to increase it, and Pmus, which tends to decrease it:
Figure 12-2
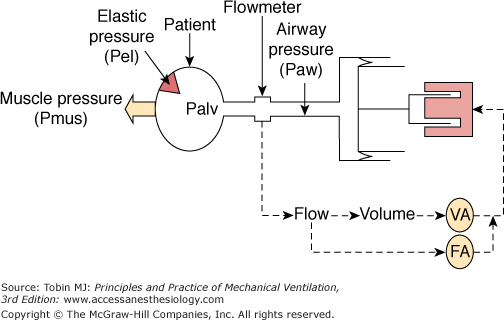
Diagram illustrating how a PAV delivery system generates pressure in proportion to effort. The gas-delivery system consists of a freely moving piston pressurized by a fast-acting motor. Force exerted by motor is a function of flow and volume leaving the ventilator. A stronger effort results in greater reduction in alveolar pressure (Palv), drawing more gas from the piston and resulting in more assist. If the volume-assist (VA) and flow-assist (FA) components are set to the same fraction of elastance and resistance, respectively, the pressure generated becomes proportional to effort (Pmus). See text.
The elastic compartment is connected to the external tubing via airways and the endotracheal tube. The ventilator controls pressure at the external airway (Paw). Air flows into the lungs when Paw exceeds Palv. Flow is a function of the difference between Paw and Palv (resistive pressure) and the resistance of the intervening tubing (R). Thus
This equation simply states that the distending force is the sum of patient-generated (Pmus) and ventilator-generated (Paw) pressures and that this distending force is opposed by the sum of resistive pressure drop (resistive pressure, or flow × R) and elastic recoil pressure (Pel, or V × E).
The gas-delivery system in Figure 12-2 is a freely moving piston pressurized by a fast-responding linear motor. This arrangement emphasizes that PAV gas-delivery systems must allow rapid and free flow of gas in response to changes in alveolar pressure. Flow and volume leaving the ventilator are measured. The gains of the flow and volume signals are adjustable by separate amplifiers: flow assist (FA) and volume assist (VA). The summed output of the two amplifiers is the input to the motor. Thus, the ventilator’s pressure output is a function of instantaneous flow and volume that left the ventilator since triggering.
With this arrangement (see Fig. 12-2), a greater effort (more reduction in alveolar pressure) will draw more gas from the ventilator. This, in turn, results in more assist. This provides a positive relation between effort and assist but does not per se cause the assist to be proportional to instantaneous effort. Proportionality is achieved through customized adjustment of the FA and VA gains. The basis for these adjustments is as follows:
FA is the assist pressure per unit flow (in cm H2O/L/s). These are resistance (R) units. If FA is 50% of R, the ventilator provides 50% of the resistive pressure (i.e., 50% of flow × R, Eq. 3). At 80% R, the ventilator assumes 80% of resistive work, and so on. Likewise, setting VA gain to 50% of E causes the ventilator to assume 50% of elastic pressure (i.e., 50% of V × E, Eq. 3), and so on. The total assist (Paw) is the sum of the flow and volume assists:
During the inspiratory phase, volume rises progressively, peaking at end inspiration. By contrast, flow peaks in early to middle inspiration and falls later. Thus, the relative contributions of resistive and elastic pressures vary considerably during the inspiratory phase. If the same percent is used for both components, total assist (Paw) represents the same percent of total pressure regardless of the relative contribution of each. Percent assist then is constant throughout. If different percent values are used for FA and VA, however, total assist (Paw) will represent a different percent of total applied pressure at different times. When percent assist (ventilator’s contribution) is constant throughout inspiration, patient’s percent contribution (i.e., 100 – percent assist) is also constant throughout and the relationship between Paw and Pmus (i.e., proportionality becomes constant) as given by
Thus, at 50% assist, proportionality is 1.0; Paw equals Pmus throughout. At 80% assist, proportionality is 4, and so on. Under these conditions, the shapes of the Pmus and Paw waveforms are identical, and the decline in Pmus at end inspiration is associated with a decline in Paw, ensuring synchrony (Fig. 12-3A). By contrast, if percent assist varies through inspiration (such as by using different percent values for FA and VA), proportionality between Paw and Pmus is no longer constant, and the shapes of the two waveforms differ (Fig. 12-3B).
Figure 12-3
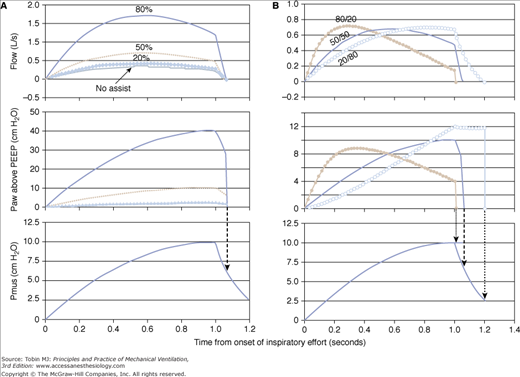
Model simulation showing the impact of using equal (A) versus unequal (B) percent assist for the flow and volume components. A. Three assist levels are shown: 20%, 50%, and 80%. When the same percent assist is applied to both components, the shape of the assist (airway pressure [Paw]) is identical to that of muscle pressure (Pmus), but the proportionality is different (Paw/Pmus = 0.25, 1.0, and 4.0, respectively). Note also that flow reaches zero (end of mechanical inspiration) at the same time during the declining phase of Pmus at all assist levels, including the no-assist situation (top panel). B. Flow assist is 80% of resistance, and volume assist is 20% of elastance (solid dots). Note that the assist (Paw) is more aggressive early in inspiration and terminates sooner relative to the balanced assist (50/50 line). A relatively greater volume assist (open circles) offers less assist early while cycling off is delayed.
Physiologic Effects
These principles are discussed first because they not only help to explain PAV’s reported effects, but also make it possible to gain useful insights from a patient’s responses to this mode; reference 3 provides more details. Responses to PAV may be mediated by changes in blood-gas tensions (chemical factors) or through modification of nonchemical sources of respiratory drive. Chemical responses are highly predictable, whereas the others are not. What happens, therefore, depends on what sources of respiratory drive are operative at the time of application.
During sleep and anesthesia, chemical factors are the sole source of respiratory drive; artificially reducing the partial pressure of carbon dioxide (PCO2) under these conditions abolishes respiratory efforts.4–6 Furthermore, in these states, respiratory muscle responses to changes in load are mediated exclusively via changes in blood-gas tensions.7 Conversely, in alert individuals, other sources of respiratory drive exist; it is very difficult to produce apnea by assisted ventilation despite marked hypocapnia.8–11 These drive inputs, collectively called the consciousness factor,4 presumably arise from behavioral centers and from respiratory mechanisms that operate only during consciousness (e.g., nonchemical load-compensatory mechanisms7). Patients who require mechanical ventilation cover a wide spectrum of levels of consciousness. Therefore, it is difficult to make general conclusions about their drive inputs. The next few sections describe what should happen in response to PAV if respiratory output were driven solely by chemical factors. Deviation from this expected behavior then might be attributed to nonchemical factors.
A steady state in PCO2 and minute ventilation ( ) can occur only if pulmonary carbon dioxide (CO2) removal (the product of alveolar ventilation [
 ] and alveolar CO2 concentration [FACO2]) equals the CO2 produced by the tissues (
 ). At a given
  , if ventilation is increased artificially, FACO2, and hence PaCO2, must decrease before a steady state is reached. Accordingly, at a given
  , there is an inverse relationship between
  and PaCO2 in the steady state—the metabolic hyperbola.12 The actual equation is PaCO2 = 0.86 [
 /
/ (1 – VD/VT)],12 where VD/VT is the dead-space-to-tidal-volume ratio. Figure 12-4A illustrates this relationship.
Figure 12-4
Effect of proportional assist on steady-state ventilation ( ) and PaCO2. A metabolic hyperbola is shown for a subject with CO2 production (
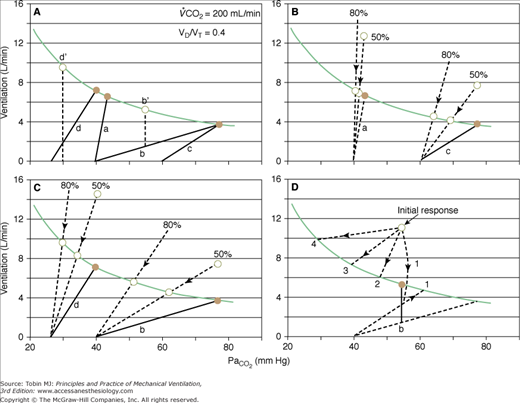
 ) of 200 mL/min and a dead-space-to-tidal-volume ratio (VD/VT) of 0.4. A. Unassisted breathing. The ventilatory responses to CO2 in four subjects are shown: (a) normal, (b) acute hypercapnic failure, (c) chronic hypercapnic failure, and (d) acute nonhypercapnic failure with metabolic acidosis. In each case, the x intercept of the ventilatory response is the apneic threshold. The apneic threshold is shifted up in subject c and down in subject d. The intersection of ventilatory response line and the hyperbola gives steady-state values for
  and PaCO2. Vertical dotted lines represent additional nonchemical inputs that cause ventilation to be higher and PaO2 to be lower than in their absence. B and C. Effect of 50% and 80% assist in the four subjects. In each case the ventilatory response slope doubles with 50% assist and increases fivefold at 80%. Open circles off the hyperbola are immediate responses not consistent with steady state. Open circles on the hyperbola are the steady-state values with assist. Note that the magnitude of change in
  and PaCO2 is a function of the difference between unassisted PaCO2 (solid circle) and the apneic threshold. D. Response to proportional assist in the presence of nonchemical input (vertical solid line). Note that the response is highly unpredictable (see text).
Ventilation increases progressively as a function of PCO2.13 The slope of the response depends on the sensitivity of chemoreceptors (the sensory arm) and the effectiveness of the motor arm in generating ventilation. Thus, for a given chemoreceptor response, ventilatory response is less if respiratory muscles are weaker or mechanics are abnormal. Without nonchemical drive sources, there is a PaCO2 below which apnea develops,4–6 the apneic threshold (AT; see Fig. 12-4).
Four subjects with different disorders are illustrated in Figure 12-4A. For each subject, there is only one possible steady state, namely, the point of intersection of the CO2 response line and the hyperbola.13 At this point, pulmonary CO2 elimination equals tissue CO2 production.
Line a represents a normal subject. Ventilatory response is normal (2.2 L/min/mm Hg), and AT is 40 mm Hg. The intersection point is at a PaCO2 of 43 mm Hg and a  of 6.6 L/min. The difference between unassisted (no assist [NA]) steady-state PCO2 and AT (i.e., Δ
 ) is very small (3 mm Hg). Line b represents a patient with severe acute hypercapnic respiratory failure. AT is the same, but the ventilatory response to CO2 is greatly depressed because of abnormal mechanics. The intersection point is 76 mm Hg at a
  of 3.8 L/min. Δ
 is very large (36 mm Hg). Line c describes a patient with chronic respiratory failure. Ventilatory response to CO2 is depressed because of abnormal mechanics and/or weak respiratory muscles. In this case, however, AT is higher. Δ
 is larger than normal (16 mm Hg), but for the same steady-state PaCO2, it is lower than in the patient represented by line b. Line d represents a patient with a reduced ventilatory response to CO2 (0.6 L/min/mm Hg) because of abnormal mechanics or weak muscles but in whom the apneic threshold is low, for example, because of concomitant metabolic acidosis.14 Steady-state PCO2 and
  are near normal, but Δ
 is large.
With PAV, respiratory motor output is amplified by an amount that is related to percent assist (see Fig. 12-3A). Within the linear range of the pressure-volume and pressure-flow relationships, the amplification of pressure results in a corresponding amplification of ventilation (see Fig. 12-3A). Thus, the net effect of PAV is to increase the slope of the ventilatory response to CO2 (as well as to the partial pressure of oxygen [PO2] and pH). For simplicity, we will assume that PCO2 is the only stimulus and that resistance and elastance are constant in the tidal volume range. Under these conditions, at 50% assist, delivered assist equals Pmus, and the combined pressure (patient + ventilator) is twice Pmus. Accordingly, the slope of the CO2 response is doubled. At 80% assist, Paw is four times Pmus (see Fig. 12-3A), and pressure output is amplified by a factor of five. The ventilatory response should increase nearly fivefold, and so on.
In the normal subject (line a), 50% assist doubles the CO2 response (see Fig. 12-4B).  immediately doubles (upper open circle). Pulmonary CO2 output now exceeds
  ·PaCO2 falls. Respiratory efforts decrease, and
  follows along the new CO2 response line until the metabolic hyperbola. A steady state is now possible. The same would happen at higher percent assist. Because steady-state values must be above the AT, and Δ
 is very small,
  and PaCO2 cannot change much. Furthermore, because
  hardly changes, virtually all the assist (Paw) is used to reduce respiratory motor output, and percent reduction in Pmus is similar to percent assist.
A similar analysis for the patient with chronic respiratory failure (line c in Fig. 12-4B) shows that at 50% assist, PaCO2 decreases by 7 mm Hg and  increases by 10%, whereas at 80% assist, PaCO2 decreases by 13 mm Hg and
  increases by 20%. Because
  increased significantly, the decrease in respiratory muscle output (Pmus) is less than percent assist. For example, at 50% assist, Pmus is contributing 50% to a higher
  (110%). The decrease in Pmus is 45% instead of 50%. Because the difference between PaCO2 at 80% assist and AT is now very small, increasing assist beyond 80% would have little further effect even though PaCO2 is still high. Thus, when AT is high, it is not possible to acutely normalize PaCO2 using PAV (or any other strictly assist mode).
In the patient with severe acute hypercapnic failure (line b in Fig. 12-4C), the changes are even greater. At 50% and 80% assist, PaCO2 decreases by 14 and 25 mm Hg, respectively, and  increases by 23% and 50%. Even at 80% assist, the difference between PaCO2 and AT is still large, and further reduction in PaCO2 is possible. Because
  increases substantially, the decrease in Pmus is much less than percent assist (39% and 70%, for the 50% and 80% assist, respectively).
Finally, in the patient represented by line d in Figure 12-4C, increasing PAV assist results in progressive hypocapnia. By normalizing mechanics, the effect of the concomitant metabolic acidosis is now exposed.
In summary, in the absence of nonchemical drive sources, whether and by how much ventilation and PaCO2 change following institution of a given percent assist are determined by the unassisted ventilatory response to CO2, the apneic threshold, and the position of the metabolic hyperbola. These determine the difference between unassisted PaCO2 and AT. Because the more  increases, the less Pmus decreases, the same three factors determine the extent to which the assist is used to increase ventilation versus decrease muscle output.
The action of nonchemical drive inputs can be viewed as additive with chemical drive. They cause ventilation to be higher at a given PaCO2 than if chemical drive were the sole source (points b‘ and d‘ in Fig. 12-4A). Total drive is made up of a CO2-sensitive component and a component that reflects consciousness-related reflexes and unpredictable behavioral influences.
Figure 12-4D illustrates how these inputs may modify the response to PAV. Without nonchemical influences, would be 76 mm Hg. Because of the nonchemical input (solid vertical line), however, steady-state  is 5.5 L/min at a PaCO2 of 55 mm Hg. A 50% assist results in an immediate increase in
  to 11 L/min (both components are amplified). PaCO2 must fall. What happens then depends on the response of the nonchemical component. At one extreme, it may disappear (e.g., the patient may fall asleep when assisted).
  would fall to the new CO2 response line (diagonal dashed line). Should
  at this point be below the hyperbola, PaCO2 and
  will rise along the CO2 response line, reaching the hyperbola at point 1. Here the assist is followed by an increase in PaCO2, but the patient is working much less. If the nonchemical stimulus remains the same, PaCO2and
  will decrease along a path parallel to the CO2 response line, meeting the hyperbola at point 3. Here, there is no longer a CO2 stimulus, and ventilation is sustained by the twice-amplified nonchemical influence. An intermediate value (point 2) may result if the nonchemical influence partially decreases. Finally, at the other extreme, the patient may become agitated with the assist, increasing the nonchemical stimulus, and this, when amplified, may reduce PaCO2 to very low levels (point 4). It is clear that with nonchemical stimuli (alert individuals), the ventilatory response to PAV is theoretically unpredictable.
PAV resulted in significant reduction in muscle output in all studies where this was tested.15–30 Typically, Pmus decreased by 30% to 45% at 50% assist and by 55% to 70% at 80% assist. The less-than-expected reduction is caused by (a) differences between assumed and actual E and R (see “Accuracy and Stability of Respiratory Mechanics Values” below), (b) imperfect delivery by the ventilator (see “Ventilator Response Time” below), (c) dynamic hyperinflation (see “Dynamic Hyperinflation” below) or nonlinearity in the pressure–volume relationship (see “Nonlinearity in the Pressure–Volume Relationship within the Tidal Volume Range” below), and (d) an associated increase in  (see “Ventilation and Partial Pressure of Carbon Dioxide” below). As indicated earlier, when some of the assist is used to increase
  , less is used to reduce muscle output.
Application of PAV to normal sleeping subjects results in an immediate increase in tidal volume (VT) and  , which decrease over several breaths to near-baseline levels.17 Steady-state responses are minimal,6,17 and the decrease in end-tidal CO2 tension (PETCO2) is very modest (approximately 3 mm Hg6,17). These results are consistent with a small difference between unassisted PaCO2 and AT secondary to a normal ventilatory response to CO2 (subject represented by line a in Fig. 12-4B).
By contrast, in experienced, awake resting normal subjects, PAV results in an important increase in and a more pronounced reduction in PaCO2, and the decrease in respiratory muscle output is only modest.18 PaCO2 generally decreases below the apneic threshold (e.g., 30 ± 5 mm Hg18), reflecting the presence of nonchemical drive inputs that fail to be eliminated. PAV applied to inexperienced, awake subjects is followed by unpredictable responses extending to severe hyperventilation (personal observations), reflecting erratic behavioral responses.
When PAV is applied to normal subjects during steady exercise31 or during inhalation of CO2-enriched air,28 there is little change in ventilation. Thus, during ventilatory stimulation the assist is primarily utilized to reduce respiratory muscle output rather than to increase ventilation. Georgopoulos et al32 measured Pmus during CO2 rebreathing with and without PAV unloading. They found that Pmus was the same when measurements were compared at the same end-tidal PCO2. Thus, it appears that during exercise-induced or CO2-induced ventilatory stimulation the downregulation of Pmus, at the same exercise level or the same fraction of inspired carbon dioxide (FICO2), is mediated by small reductions in systemic PCO2.
There are numerous reports on the changes in  and PaCO2 with PAV in patients with respiratory failure.15,16,19–26,33–39 Responses ranged from virtually no change or even a decrease in
  as assist increased33–36 to large increases in
  and PaCO2 decreases in.16,19,25,37 These differences can be explained readily if one considers the experimental circumstances of the various studies or patients.
Intubated ventilator-dependent patients with normocapnia. It is clearly not possible to establish steady-state values of
 and PaCO2 during unassisted breathing in these patients as they rapidly develop distress. The effect of PAV is, accordingly, determined over a range of assist above a minimum value (e.g., 80% vs. 40%). Furthermore, in such patients, PaCO2 at the minimum tolerable assist is normal. All such studies demonstrated very little change or even a small decrease in
  as assist increased.33–36 PaCO2 decreased, but the change was small (2 to 4 mm Hg). These patients, therefore, behave like the subject represented by line a in Figure 12-4B, who has no nonchemical inputs and a small Δ
 . This state, however, is reached only at some finite assist. It therefore would appear that these patients become comfortable only when their PaCO2 is a few millimeters of mercury above AT. Under these conditions,
  cannot increase further by PAV application (Figure 12-4B, line a); the extra assist is used simply to decrease muscle output. The decrease in
  observed in some cases34,36 is caused by a reduction in VD/VT and/or
  (secondary to decreased respiratory muscle work) because in all such cases, PaCO2 was lower even though
  was lower.34,36
The preceding observations lead to an interesting conclusion: Ventilator-dependent patients who show little change in
 and PaCO2 over a relatively wide PAV assist do not tolerate a PaCO2 that is much above AT. This indicates a high degree of chemosensitivity that likely contributes to their ventilator dependence. Chemosensitivity, as used here, does not refer to ventilatory responses (which are affected by mechanics and muscle strength) but to central effects of PaCO2 on respiratory sensation and muscle activation.
Chronic hypercapnia with and without acute exacerbation. In virtually all reported studies,
 and PaCO2 on PAV were compared with values obtained during a period of unassisted breathing.16,19–21,23,25,26,40 Unlike the preceding group, there always was a significant increase in
  and PaCO2 a decrease in. The changes were modest, however (approximately 25% increase in
  and a 3- to 6-mm Hg decrease in PaCO2). Such a response is consistent with a somewhat larger difference between AT and unassisted PCO2 (subject represented by line c in Fig. 12-4B). PaCO2 remained abnormally high in all cases, consistent with a high AT. The changes in
  and PaCO2 likely would have been greater if the hypoxic stimulus did not change. In all but one study,19 PaO2 was quite low during unassisted breathing and improved with PAV. Because a higher PaO2 decreases the ventilatory response to CO2,13 an increase in PaO2 mitigates the increase in CO2 response produced by PAV, resulting in a smaller increase in ventilatory response. The assist provided in this case is used preferentially to decrease muscle output as opposed to increasing
  . In one study,19 the hypoxic drive was negligible at baseline (PaO2 = 99.5 mm Hg). Here, the increase in
  was much greater (38%19). Although the changes in PaCO2 and PaO2 undoubtedly contributed to the reduction in respiratory muscle output, most of these patients were alert, so a reduction in nonchemical inputs may have been partly responsible.
Acute hypercapnic failure. Gay et al38 reported an average 8 mm Hg decrease in PaCO2 (60 to 52 mm Hg) within a half hour of instituting noninvasive PAV. Likewise, in a study by Busterholtz et al on patients with acute cardiogenic pulmonary edema, PaCO2 decreased from 51 ± 25 to 41 ± 25 mm Hg and PaO2 increased from 66 ± 18 to 130 ± 30 mm Hg within 30 minutes of applying PAV.41 Considering that not all patients in these two studies were hypercapnic and that the nonhypercapnic patients likely did not contribute to the average decrease (see 4 below), the decrease in PaCO2 in the hypercapnic group must have been greater. In another study,37 there were four patients with acute hypercapnic failure not associated with central depression. In them, PaCO2 declined 17 mm Hg on average (66 to 49 mm Hg) within a half hour of instituting PAV. These observations suggest that patients with acute hypercapnia secondary to severe acute mechanical abnormalities do sustain large increases in
 and reductions in PaCO2 on institution of PAV (see line b, Fig. 12-4C). Interestingly, PaCO2 remained above normal (approximately 50 mm Hg) in some patients for a few hours.37 It is possible that the apneic threshold increased somewhat during the preceding period of severe hypercapnia.
Acute hypoxemic failure. Information about this group is scant. Although patients were included in three previous reports,37–39 only in one study were the results of the normocapnic group (four patients) separated from those of hypercapnic patients.37 In these four patients, PaCO2 did not change despite distress decreasing dramatically. The likely explanation for failure PaCO2 of to decrease is that respiratory muscle output to a large extent was related to nonchemical inputs, which decreased substantially on unloading (pathway 1 in Fig. 12-4D).
With one exception,16 when there was no clinical distress at the lowest level of assist, application of PAV or further increases in percent assist did not result in appreciable changes in ventilator rate (i.e., >2 to 3 breaths/min). This applied to normal sleeping subjects,6,17 intensive care unit (ICU) patients in whom percent assist was changed over a wide range above a comfortable level,33–36 and ambulatory patients with chronic respiratory failure in whom the lowest level was spontaneous breathing.19,20,24–26,40 In the only exception,16 respiratory rate (RR) deceased substantially when PAV was applied, but in this case there were clear signs of runaway (i.e., patient was no longer in the PAV mode).
In patients with acute exacerbation of chronic obstructive pulmonary disease (COPD), RR on PAV was lower than during spontaneous breathing (3 to 5 breaths/min21,23). The pH, however, was low at baseline, and some degree of distress may have been present then. When PAV is applied to patients with clear respiratory distress, RR decreases dramatically along with relief of distress.37–39
From these observations it is clear that PAV does not per se change RR. RR changes only when PAV relieves respiratory distress. In physiologic studies in which respiratory drive is deliberately increased, RR does not increase until moderate levels of stimulation.18,42 This applies whether stimulation is produced by hypercapnia, hypoxemia, acidosis, or an increase in metabolic rate.43 Thus, a change in RR with assist level indicates that respiratory drive is in a range where RR is sensitive to drive and hence probably excessive, whereas failure of RR to change over a range of PAV assist indicates that respiratory drive is only modest over this range. There are two important clinical implications to these observations on PAV:
Failure of RR to change over a range of PAV assist indicates that respiratory drive is only modest over this range and that the RR observed in this range is the undistressed value preferred by the patient’s control system. Importantly, undistressed RR, so defined, ranges from 12 to 46 breaths/min.33,34 That undistressed RR varies widely among patients is consistent with the wide range in normal subjects (8 to 25 breaths/min).44 The main difference between ICU patients and normal subjects is that the average undistressed rate is 10 breaths/min higher.33 A number of factors may contribute to this, including body temperature, irritation of tracheal receptors by the endotracheal tube, disease-related effects on pulmonary and other receptors, neuropathology, and drug effects.33
Because the undistressed RR can be quite low, a change in RR as assist level is changed is more important than absolute RR at the low assist. For example, an increase from 20 to 25 breaths/min may indicate distress, although 25 breaths/min is not usually considered a sign of distress. By contrast, RR in excess of the usual cutoff of 35 breaths/min need not reflect distress.
Tidal volume responses mirror the  responses and obviously share the same mechanisms (see “Ventilation and Partial Pressure of Carbon Dioxide” above). It is important to note that in normocapnic patients, once a distress-free assist level is reached, further increases have little effect on VT.33,34 Accordingly, every patient has a preferred or target VT that cannot be exceeded with more PAV assist. As with normal subjects,44 the preferred VT varies widely among patients (4 to 15 mL/kg33,34).
PAV has made it possible to determine the undistressed breathing pattern in ICU patients. This proved quite variable. Figure 12-5 shows two extremes. With this wide range, a one-size-fits-all strategy of mechanical ventilation (e.g., setting a target VT) is clearly not ideal (see “Physiologic Consequences of Operational Differences” below).
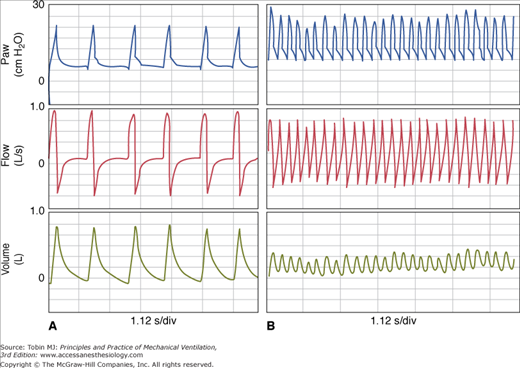
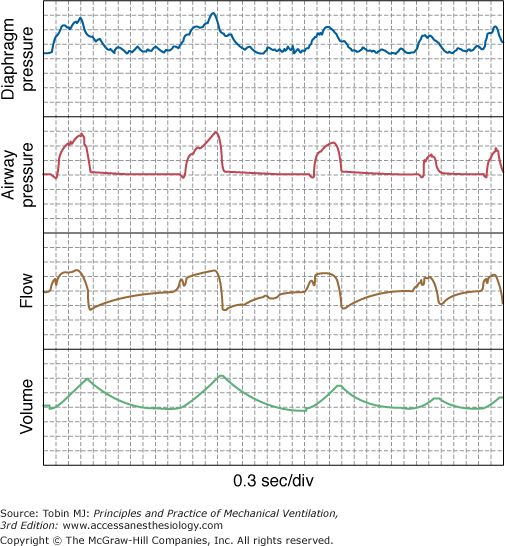
Large breath-by-breath variability in VT is characteristic of normal breathing, particularly in wakefulness.45,46 Variability decreases in patients with abnormal mechanics.47,48 Probably because PAV improves neuroventilatory coupling, breath-by-breath variability tends to be large in this mode (see, e.g., Fig. 12-1). Coefficients of variation of 25% or more are not unusual,23,25,35–37 and spontaneous sighs may be frequent. As with normal subjects,49 breathing variability on PAV is less in sleeping and obtunded patients (personal observations).
The tendency for the respiratory system to become unstable is described by the so-called loop gain.50–52 A value of 1 indicates that recurrent cycling will occur spontaneously (e.g., Cheyne-Stokes breathing). The lower the value, the more stable is the system. Ventilatory response to chemical stimuli is an important determinant of loop gain.50–52 Because PAV increases ventilatory responses, we were concerned initially that it might precipitate periodic breathing.1 This, however, did not materialize. Although PAV may aggravate preexisting Cheyne-Stokes breathing,53 there are no reports of PAV-induced Cheyne-Stokes breathing in the usual ICU patient, and we have observed only a few in whom breathing became periodic on high PAV support.
The resistance to Cheyne-Stokes breathing was explained recently. Normal subjects require threefold to fourfold amplification of ventilatory responses to develop periodic breathing.6,17,54 Thus, when respiratory muscles and mechanics are normal, native loop gain is less than 0.3. In the average ICU patient, respiratory muscle strength is 50% of normal,55 resistance is four times normal (14 vs. 3 to 4 cm H2O/L/s56), and elastance is two to three times normal (28 vs. 10 to 14 cm H2O/L57). Collectively, these abnormalities should decrease ventilatory responses to 20% of the normal value. For PAV to induce periodic breathing in the average patient, it first must normalize ventilatory responses (i.e., a fivefold increase in the average patient) and then three to four times more, a greater than 10-fold amplification. This is very difficult to achieve because of technical and physiologic limitations (see “Limitations” below). Accordingly, if periodic breathing develops on PAV, it suggests that (a) respiratory muscles and mechanics are near normal, and the patient likely does not need ventilator support, and/or (b) the chemical control system is inherently unstable, and one should suspect disorders that result in Cheyne-Stokes breathing, chiefly heart failure. A third condition that may precipitate periodic breathing is the runaway phenomenon (see below). Here, large tidal volumes may result, precipitating hypocapnia and recurrent central apneas. The pattern is unlike the crescendo–decrescendo Cheyne-Stokes breathing variety, however, and more like that produced by pressure support (several large breaths alternating with apnea6,58).
The ability of PAV to increase loop gain by measurable quantities is currently being used to study mechanisms of instability during sleep.52,59
Application of PAV during submaximal exercise in patients with severe COPD increased endurance time and reduced the rate of progression of dyspnea.29,60–62 Patients with very severe COPD who received PAV during exercise in a rehabilitation program demonstrated greater improvement in unassisted exercise tolerance relative to a control group.63 A beneficial effect of assist was not evident in mild COPD.64 Application of PAV during submaximal exercise also increased endurance time and reduced dyspnea in patients with idiopathic pulmonary fibrosis65 and in obese patients.66
Apart from its potential therapeutic role, PAV also has been used to examine the role of respiratory muscles in limiting exercise in normal subjects and in patients with COPD, with highly interesting results.31,67–74
Comparison with Other Modes
With PAV, the assist (i.e., Paw) varies directly with the intensity of patient effort (see Fig. 12-1). By contrast, with pressure-support ventilation (PSV), the assist is the same breath after breath regardless of intensity of effort. With volume-controlled ventilation (VCV), assist varies inversely with effort (Fig. 12-6). This is so because flow and volume are preset. If the patient’s contribution increases, the ventilator must deliver less assist (Paw), and vice versa. Otherwise, delivered flow and volume will deviate from set values. These different relations have been well documented.18,22,75
Figure 12-6
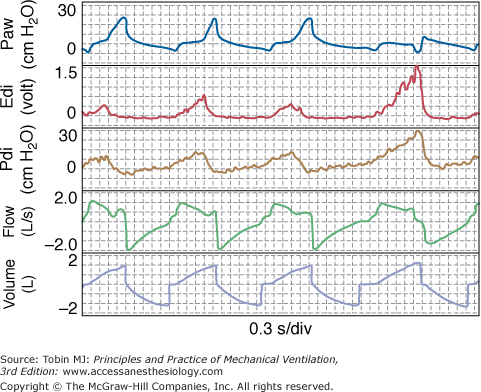
Tracings from a patient on volume-controlled ventilation. Note that ventilator cycles extend beyond inspiratory effort in the first three breaths while terminating during the effort in the last breath. Note also that patient received little or no assist when his effort was greatest (last breath). Edi, diaphragmatic activity; Paw, airway pressure; Pdi, diaphragmatic pressure.
With PAV, the end of the ventilator cycle is synchronized automatically with the end of patient effort (see Fig. 12-1), whereas with other modes it is not. Although ventilator response delays tend to delay cycling off somewhat,76 the effect is fairly trivial compared with the situation in other modes (see “Ventilator Response Time” below). In VCV, there is no relationship whatsoever; the patient determines the end of his effort, whereas the caregiver determines the end of the ventilator’s cycle. Any synchrony is happenstance. The ventilator may continue inflation well after the end of effort, when patient wants to exhale (e.g., breath 1 in Fig. 12-6), or may cycle off, withdrawing support before the end of effort while patient is still trying to inhale (e.g., breath 4 in Fig. 12-6).
With PSV, synchrony between the ends of the ventilator’s and the patient’s inspiratory phases may or may not occur depending on the patient’s respiratory mechanics and the relation between PSV level and Pmus.77,78 Ventilator cycles often extend well beyond inspiratory effort34,79 or may be almost completely out of phase with them79 (Fig. 12-7A). At times, inflation extends over two or more efforts (Fig. 12-8A).34
Figure 12-7
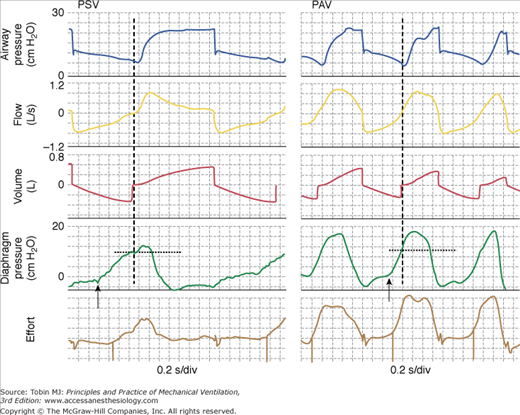
Comparison of pressure-support ventilation (PSV) and proportional-assist ventilation (PAV) in a patient with severe dynamic hyperinflation. With both modes, inspiratory muscles had to generate 10 cm H2O before inspiratory flow could be generated and the ventilator triggered (vertical dashed lines). Note that in PSV, ventilator cycle extends well into neural expiration. There also were many ineffective efforts (not shown). This is not the case in PAV. Note also that diaphragmatic output is considerably higher in PAV. As a result, delay between onset of effort (arrows) and triggering is much less. In addition, respiratory rate is higher with PAV. With severe dynamic hyperinflation, it is difficult to maintain respiratory muscle output at a low level in PAV. See Figure 12-13 for transition from PSV to PAV in this patient. Bottom tracing. A semiquantitative effort signal generated without knowledge of respiratory mechanics117 that can be used to identify onset and end of efforts noninvasively in real-time (event marks). Note that the onset of effort (downgoingmarks) can be identified well before inspiratory flow crossing. If used for triggering, this essentially can eliminate the extra work associated with dynamic hyperinflation.
Figure 12-8
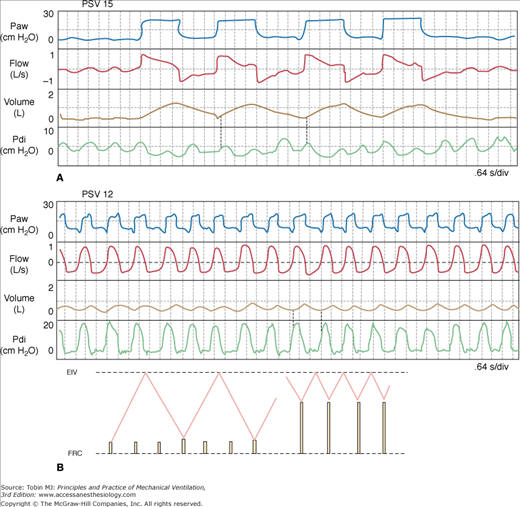
A dramatic example of a marked shift from slow, deep breathing (panel A) to very rapid, shallow breathing (panel B) following a small reduction in pressure support (PSV). The increase in respiratory rate was artifactual and related to improved synchrony (note that the rate of diaphragmatic efforts was unchanged). The small tidal volumes are related to dynamic hyperinflation (note that Pdi increases substantially before flow becomes inspiratory) (vertical dotted lines). Inset shows schematically the mechanism of shallow breathing. Height of solid lines represents effort amplitude. See text for additional details. EIV, end-inspiratory volume; FRC, functional residual capacity; Paw, airway pressure; Pdi, diaphragmatic pressure.
The operational characteristics of NAVA80–82 are very similar to those of PAV in that the assist is proportional to instantaneous effort in both cases. Thus, in both cases the assist will increase when effort increases and vice versa, and in both cases the ventilator cycle will terminate soon after the end of inspiratory effort. The main difference is in the signal used to drive the ventilator: PAV uses an indirect noninvasive estimate of effort (calculated Pmus) whereas NAVA uses a direct estimate of diaphragmatic activity obtained from internally inserted esophageal electrodes. This gives NAVA an advantage with respect triggering in that with NAVA the assist can, theoretically, begin very soon after the onset of diaphragmatic activity in the presence of important dynamic hyperinflation or circuit leaks, whereas with PAV the assist will not start until flow becomes inspiratory, and triggering and assist may be adversely affected in the presence of significant leaks (see “Limitations” below). On the other hand, because the diaphragm participates in many nonrespiratory activities (such as postural changes and vomiting), control of airway pressure by diaphragmatic activity could result in undesirable large increases in airway pressure during such activities. For example, the diaphragm contracts vigorously during vomiting to increase abdominal pressure. This may be expected to cause a large increase in airway pressure in the case of NAVA. PAV, in contrast, is not susceptible to this problem because diaphragmatic descent and reduction in intrathoracic pressure are prevented by concurrent contraction of the expiratory muscles.
The following sections deal with consequences as they relate to conventional assist modes (PSV and VCV). Because NAVA has similar operational characteristics, its consequences vis-a-vis conventional assist modes are expected to be similar (see Chapter 13 and reference 82 of this chapter). There are no studies in which NAVA and PAV have been compared directly so as to ascertain the clinical impact of NAVA’s triggering advantage in the presence of dynamic hyperinflation and leaks.
Figure 12-9 illustrates what, theoretically, should happen when assist level is varied in different modes (see refs. 3 and 83 for more details). The response of RR to changes in PaCO2 near the AT is key to understanding these plots. As indicated earlier, RR is fairly constant over a range of PaCO2 above the AT. For example, average difference between spontaneous RR and RR just before apnea is less than 1 breath per minute.6 At AT, breathing simply stops. There is no gradual reduction in RR.
Figure 12-9
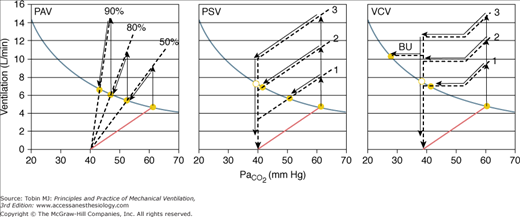
Responses to different levels of assist with proportional-assist (PAV), pressure-support (PSV), and volume-controlled ventilation (VCV). The ventilatory response to CO2 is shown for three assist levels in each case. The format is as in Figure 12-4. Note that in PAV the ventilatory response line intersects the metabolic hyperbola at all levels of assist. A steady state thus is possible at all levels. In PSV and VCV, the response lines intersect the hyperbola over a limited range of assist. At higher levels, a steady state is not possible, and nonsynchrony must result (see text). In this simulation, respiratory rate is shown to increase when PaCO2 exceeds 53 mm Hg. This accounts for the increase in ventilation above this PaCO2 in VCV. BU, backup rate.
The effect of different levels of PAV (see Fig. 12-9A) was discussed earlier (see Fig. 12-4). A steady state is possible at all assist levels, except in rare cases where chemical control is highly unstable (see “Ventilatory Instability” above). Once the AT is approached, it is not possible to increase  further.
The relationship between PCO2 and ventilation during PSV is extremely complex.3,34,77,83 For simplicity, it is shown as a parallel shift in the ventilatory response, reflecting the fact that the assist is independent of PCO2. Exactly what happens, however, to the slope of the ventilatory response is not terribly important here. What is important is that with PSV a minimum VT is delivered once the ventilator is triggered. This minimum VT is a function of PSV level and respiratory mechanics.6,77 For example, in a patient with an elastance of 25 cm H2O/L and a resistance of 12 cm H2O/L/s, the minimum VT at PSV of 7, 14, and 20 cm H2O will be approximately 0.22, 0.43, and 0.64 L, respectively.6,77 If the patient’s RR near the AT is a conservative 16 breaths/min, and every effort triggers the ventilator, minimum 
Related posts:


Stay updated, free articles. Join our Telegram channel

Full access? Get Clinical Tree


