Prone Positioning in Acute Respiratory Failure: Introduction
Approximately 35 years ago, the use of the prone position was proposed to improve arterial oxygenation in patients with acute respiratory failure (ARF).1–3 The prone position, however, may have variable effects on gas exchange. Moreover, it has been suggested that, independent of gas exchange, the prone position may decrease the harm of mechanical ventilation, improving the outcome of patients with ARF. This chapter discusses the mechanisms affecting the changes in gas exchange consequent to the prone position in patients with ARF, and the effects of prone positioning on outcome of critically ill patients.
Effects of Prone Positioning on Gas Exchange
The effects of prone positioning on gas exchange may result from a combination of the following mechanisms: (a) changes in regional lung inflation, (b) redistribution of ventilation, and (c) redistribution of perfusion. These three mechanisms apply to both the normal and diseased lung. In the diseased lung, however, these mechanisms are also affected by the underlying pathology. Moreover, because the underlying pathology is an evolving process, it is likely that the effects of positioning on arterial oxygenation will vary with time.
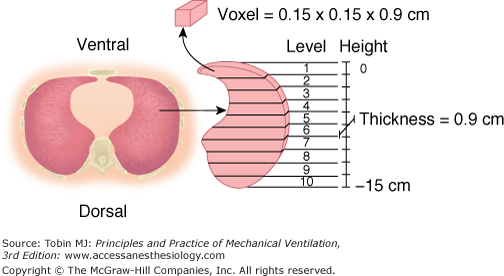
Most of the studies dealing with regional lung inflation in normal subjects were performed with radioactive xenon.4,5 We used computed tomography (CT) to quantify regional lung inflation.6,7 The CT scan provides a computer-reconstructed image that is composed of several hundred elementary units (voxels). Each voxel is characterized by a given level of absorption of X-rays, which mainly reflects the density of the material being studied. The density is usually expressed in CT numbers or Hounsfield units (H).8 A density equal to 0 H characterizes a voxel composed of water, while a voxel with a density of −1000 H is composed of gas. A voxel with a CT number equal to −500 H has a composition of 50% gas and 50% tissue. By analysis of the CT numbers, we quantitatively describe the regional lung inflation of a single CT section, at the level of the lung base, that is representative of the entire lung.6 The CT section is divided into ten levels along the vertical axis, each level including approximately 300 to 400 voxels (Fig. 49-1). The gas-to-tissue ratio, which is our index of regional lung inflation, was computed from the average CT number at each lung level.
Figure 49-1
Regional analysis of the CT scan image. The vertical distance from ventral to dorsal surface (height) is divided into ten equal intervals. Ten lung levels are then obtained. Each level is composed of 300 to 400 elementary units (voxels), each characterized by a given CT number expressed in Hounsfield units (H). (Used, with permission, from Pelosi et al.16)
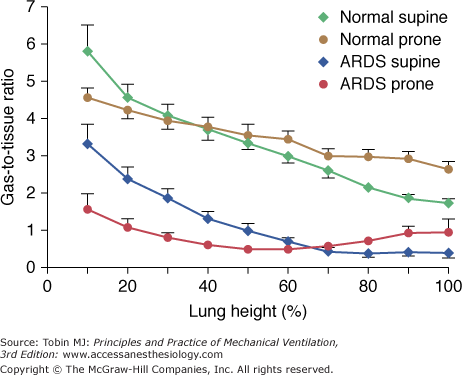
As shown in Figure 49-2, the regional inflation, expressed as the gas-to-tissue ratio, decreases along the vertical axis (from ventral to dorsal). Because the decrease is exponential, the rate of change of regional lung inflation with height may be characterized by a decay constant (Kd). The lower the value of the Kd, the higher the rate of the decrease of regional lung inflation along the vertical axis. The Kd in normal subjects is 13.6 ± 2.5 cm. At this distance from the ventral surface, the gas-to-tissue ratio is 37% of the gas-to-tissue ratio value computed at the ventral surface. In other words, the alveolar dimensions, in the dorsal regions, should be approximately one-third of those at the ventral surface.
Figure 49-2
The gas-to-tissue ratio as a function of lung height in the supine (diamonds) and prone (circles) positions. The green and brown symbols refer to normal lungs (N = 14) and the blue and red symbols refer to lungs of patients with acute respiratory distress syndrome (ARDS) (N = 20). It is important to note that “height = 0” refers to the ventral surface in the supine position and to the dorsal surface in the prone position. The height scale direction is from nondependent (0) to dependent (100).
When a normal subject is shifted from supine to prone, the regional inflation distribution changes, increasing in the dorsal regions and decreasing in the ventral regions (see Fig. 49-2). The regional inflation decreases exponentially from dorsal to ventral for both supine and prone positions; however, the Kd is higher in the prone position compared with the supine position (Kd prone, 26.2 ± 2.2 cm; Kd supine, 13.6 ± 2.5 cm). This indicates that the regional inflation distribution is more homogeneous in the prone than in the supine position, and therefore the prone position does not simply reverse the regional inflation distribution. We confirmed these concepts in animal studies by means of CT scan.9
The regional inflation is believed to depend on the local transpulmonary pressure (i.e., the absolute difference between pressure in the alveoli and pressure at the pleural surface [Ppl]). At functional residual capacity, alveolar pressure equals atmospheric pressure; thus, changes in transpulmonary pressure are caused by regional differences in Ppl. The Ppl gradient in normal subjects is approximately 0.2 to 0.3 cm H2O/cm.10 The nature of this pressure gradient, however, is still controversial and is mainly attributed to the following factors: (a) lung weight, (b) shape and mechanical properties of the chest wall, and (c) shape and mechanical properties of the lung.
The role of lung weight in normal subjects is considered a predominant mechanism by some investigators.11–14 It was first stressed by Krueger et al,15 who found that the normal Ppl gradient was very similar to the normal density of the lung (0.22 g/L). The lung-weight theory assumes that the lung behaves as a fluid and that the hydrostatic pressures are transmitted through the lung parenchyma as in a liquid (i.e., at a given lung height, the superimposed pressure [SPL] is equal to the product of the height of the lung column and density). Estimating the SPL with the CT scan, in normal subjects, we found an average SPL gradient of 0.23 cm H2O/cm,16 which is similar to the Ppl gradient classically reported in physiology. Factors other than lung weight, however, may play a substantial role in determining Ppl. In fact, in the prone position, the decay of the regional inflation with height is less than in the supine position (i.e., the Ppl gradient is probably lower in the prone than in the supine position; see Fig. 49-2). If the SPL was the only determinant of Ppl, the decay of the regional lung inflation would be similar in prone and supine positions. As shown in Figure 49-2, however, the regional inflation distribution, along the vertical axis, was different in the supine and prone positions. Our findings are in keeping with those of Mutoh et al17 in normal dogs, in which the Ppl gradient was directly measured. Factors such as the thoracic lung shape and compliance should then be involved in determining the regional inflation changes with positioning. In addition, the prone position eliminates the compression of the lungs by the heart, which also contributes to a more homogeneous distribution of lung inflation.18,19
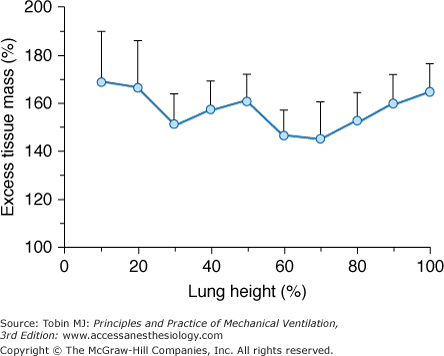
The early phases of ARF are characterized by lung edema. The edema causes a large increase in “lung tissue” and therefore in lung weight. In ARF patients, we found that lung weight, as measured by the CT scan technique, was two to three times greater than normal,20 and this is consistent with the lung weight values reported in autopsy series.21 We also found that edema (i.e., the amount of tissue mass in excess of normal [excess tissue mass]) does not accumulate preferentially in the dependent regions, and it is quite evenly distributed at each lung level (Fig. 49-3). The nongravitational distribution of edema was reported in a series of animal experiments using different techniques.22,23 This homogeneous increase in lung edema has two important consequences for regional inflation. First, although ARF is characterized by a marked decrease in lung gas volume,20 the total lung dimensions are similar to normal secondary to the increase in lung tissue mass (edema).16 Second, the increased lung tissue mass leads to a dramatic increase in SPL, which may be as high as 10 to 15 cm H2O in the most dependent regions.6,7,16
Figure 49-3
The distribution of excess tissue mass (i.e., the mass in excess of the expected normal mass) as a function of lung height. Data refer to thirty-four ARF lungs studied in the supine position. Zero on the abscissa refers to the ventral lung surface. (Used, with permission, from Gattinoni et al.51)
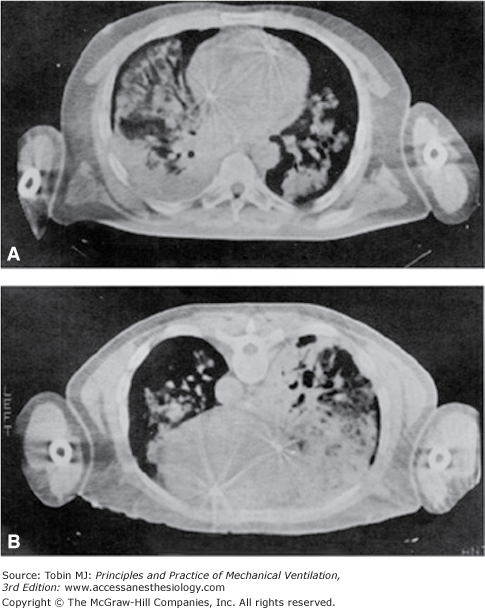
Figure 49-2 shows the behavior of regional inflation in patients with ARF in the supine position. As in the normal lung, the regional inflation decreases exponentially along the ventral–dorsal axis.16 Two important differences, however, must be stressed. First, the regional inflation at the ventral surface is only half that of the normal lung. Second, the decay constant in the regional inflation with height (Kd) is almost half that of normal; that is, the rate of the decrease of regional inflation from the ventral to dorsal region is double that of the normal lung (Kd ARF = 6.9 ± 1.2 cm vs. Kd normal = 13.6 ± 2.5 cm). This suggests that in supine ARF patients at 0 cm H2O positive end-expiratory pressure (PEEP), there is almost total alveolar collapse in the posterior half of their lungs, as confirmed by the CT scan image (Fig. 49-4).
Figure 49-4
A representative CT scan image in supine (A) and in prone (B) positions. Note the typical redistribution of lung densities. Images taken 10 minutes apart, and at end-expiration apnea, with 10 cm H2O PEEP. (Used, with permission, from Gattinoni et al.6)
Figure 49-2 shows the behavior of regional inflation in the prone position. As with normal subjects, the inflation gradient is reversed, and the regional inflation is greater in dorsal regions and lower in ventral regions. Once again, the dependent lung regions (ventral) are collapsed (see Fig. 49-4). As with normal subjects, regional inflation is more homogeneously distributed than in the supine position; however, exponential fitting of the experimental data did not reach a level of significance in all patients.
The main difference in regional inflation between normal subjects and patients with ARF is the greater rate of decrease of regional inflation along the vertical axis in ARF lungs. This suggests that the Ppl gradient is higher in patients with ARF than in normal individuals.16 The most likely explanation of the increased Ppl in ARF is increased lung weight; the overall lung shape, in fact, is not different between normal individuals and patients with ARF.16 The thoracic–lung shape modifications when the patients are turned prone, however, probably change the Ppl gradient (i.e., the modifications of the lung and the chest wall shape may redistribute the forces acting at the pleural surface).
The relationships between lung shape modifications and distribution of regional lung inflation in ARF patients is discussed in “Mechanisms Involved in Arterial Oxygenation Changes in the Prone Position” below.
In patients with ARF, lung densities redistribute from the dorsal to the ventral region when turned prone. Regional inflation decreases exponentially from the nondependent to the dependent lung region in both the supine and prone positions. The decay in regional inflation, both in normal individuals and in patients with ARF, is greater in the supine than in the prone position. This indicates that regional inflation is usually more homogeneously distributed in the prone position. The regional inflation gradient is secondary to the Ppl gradient. Lung weight is probably a major determinant in increasing the Ppl gradient in ARF. Thoracic–lung shape modifications from supine to prone, however, may produce a more homogeneous distribution of regional inflation in the prone position.
As a general rule, ventilation relates to applied pressures, flows, and resistances according to the following equation:
where DV is variation in volume, C is compliance, DPtp is transpulmonary pressure,  is flow, and R is resistance. It follows that regional ventilation depends on regional compliances, regional transpulmonary pressure swings, regional flow rates, and regional resistances.
When a bolus of radioactive gas is inhaled by spontaneously breathing subjects in the supine position, ventilation is predominantly distributed to the dependent lung regions.24 From available data, the major determinants of the distribution of ventilation appear to be: (a) the regional inflation distribution and (b) the pattern of diaphragmatic movement (active or passive).
Mead et al,25 Otis et al,26 and Pedley et al27 proposed a lung model divided into two compartments: upper and lower. Regional inflation is greater in the upper (ventral) compartment and smaller in the lower (dorsal) compartment. The upper lung regions are closer to the flat portion of their pressure–volume curve, while the lower regions are on the steeper portion of the curve. Consequently, for a given applied pressure, ventilation is greater in the lower lung regions than in the upper regions.
In the supine position, a large portion of the lung is close to the diaphragm, which may vary its tension, shape, and position. During tidal spontaneous breathing, there is a greater displacement of the dependent hemidiaphragm, with consequent greater ventilation of the dependent lung.28–30 Accordingly, in spontaneously breathing subjects, both regional inflation and diaphragmatic movement cooperate to distribute ventilation preferentially to the dependent lung. There are, however, three major conditions in which the ventilation is greater in the nondependent lung: (a) ventilation at low lung volume, (b) ventilation at high inspiratory flow rate, and (c) mechanical ventilation during anesthesia and muscle paralysis. The preferential ventilation of the upper compartment at a low lung volume is easily explained by the work of Otis et al26 (i.e., at a low lung volume, the upper lung regions are probably shifted on the steeper part of the pressure–volume curve). At a high inspiratory flow rate, the accessory respiratory muscles appear to play a determining role in the redistribution of ventilation to the upper compartment.31,32 During mechanical ventilation, particularly during anesthesia and paralysis, the diaphragm appears to play a major role in the distribution of ventilation.33–35 In this situation, the diaphragm behaves as a flaccid membrane, which is faced with the vertical pressure gradient of the abdominal contents. The upper, nondependent part of the diaphragm moves passively and faces a lower abdominal pressure; thus, ventilation is greater in the nondependent lung regions.
Distribution of ventilation in prone position is still controversial. Indeed, some authors found a uniform vertical distribution of ventilation in spontaneously breathing subjects,36 whereas others found a vertical gradient with either greater ventilation in the dependent (ventral) regions4 or in the nondependent lung regions.37
No data are available concerning ventilation at low lung volumes or at a high inspiratory flow rate in the prone position. During mechanical ventilation in anesthetized paralyzed normal individuals in the prone position, Rehder et al37 found that the distribution of ventilation was greater in the nondependent lung regions, where the passive upper position of the diaphragm faced a lower abdominal pressure.
Recently, in an animal study, we confirmed that the distribution of ventilation in the prone position is more homogeneous than in the supine position, and that in the prone position there is less lung strain once tidal volume is delivered.9
CT scan studies in patients with ARF have shown that ventilation is distributed preferentially to the nondependent lung because the dependent lung is usually collapsed and/or consolidated (see Fig. 49-4). We obtained CT scans at both end-expiration and end-inspiration in ten patients during the early phase of ARF.38 In these patients, we, indeed, found that “ventilation” was preferentially distributed to the nondependent (ventral) lung regions. The pattern was in part modified by application of PEEP. With an increase in PEEP and reopening of the dependent lung regions, “ventilation” was more uniformly distributed (gas could reach the recruited dependent regions).
Few data have been published on the distribution of ventilation in patients with ARF placed in the prone position. Because regional inflation is more uniform in the prone position, similarly to the pattern in normal lungs, however, one would expect that ventilation should be more uniform in this posture. Vieillard-Baron et al showed that the prone position does improve homogenization of tidal ventilation by reducing time-constant inequalities.39
In spontaneously breathing normal subjects, when supine, ventilation is preferentially distributed to the dependent lung regions, although prone position data are controversial. During mechanical ventilation, this pattern is reversed with preferential distribution of ventilation to the nondependent lung in both supine and prone positions. Accordingly, the main determinant of ventilation distribution is the regional inflation gradient and transdiaphragmatic pressures. In mechanically ventilated patients with ARF at low PEEP level, ventilation is preferentially distributed to the nondependent lung regions. In the prone position, we expect a similar pattern of ventilation distribution, because the collapsed areas move from the dorsal to the ventral regions. Tidal volume, however, is more homogeneously distributed in the prone position, because of a reduction in the slow compartment zones of the lung, and possibly because of a more homogeneous distribution of regional inflation.
The most widely accepted model that describes the pulmonary perfusion pattern is that described by West et al.40 According to these investigators, the relationship between blood flow and pulmonary artery pressure, alveolar pressure, and venous pressure can be modeled as in a Starling resistor, where a collapsible tube traverses a closed chamber (the gas compartment) in which pressure (the alveolar pressure) may be varied at will. When the inflow pressure (pulmonary artery pressure) is lower than the chamber pressure (alveolar pressure), blood flow stops (zone 1). When the inflow pressure is higher than the chamber pressure, the flow through the system is governed by either the difference between pulmonary artery pressure and alveolar pressure (zone 2) or the difference between pulmonary artery pressure and venous pressure, when the outflow pressure (venous pressure) exceeds the chamber pressure (zone 3).
According to this “gravitational” view, perfusion should progressively increase down the lung. In the supine position, the lung should be characterized by perfusion in zone 2 and zone 3, increasing from ventral (zone 2) to dorsal (zone 3), because zone 1 conditions do not occur. Several authors, suggesting that factors other than gravity can determine the perfusion heterogeneity, have challenged the model of West et al.41–45
According to the gravitational theory, a perfusion gradient should exist from dorsal to ventral. Few data confirm this pattern in human subjects.4 A perfusion gradient, however, could not be observed in the prone position in dogs;44,46 regional pulmonary blood flows were positively correlated when measured in supine and prone position (and not negatively correlated, as expected according to the gravitational theory).
Whatever the determinants of perfusion in the normal lung, several physiologic and anatomic factors are likely to alter the perfusion distribution in ARF. Among these are (a) hypoxic vasoconstriction, (b) vessel obliteration, and (c) extrinsic vessel compression.
The effects of hypoxic vasoconstriction were evaluated in the lateral position using separate lung ventilation.47 The inspiration of a hypoxic gas mixture by the dependent lung failed to redirect blood flow toward the nondependent lung, whereas diversion occurred in the supine position. This suggests that hypoxic vasoconstriction alone is not able to counteract the effects of posture on pulmonary blood flow.
Both macrothrombi and microthrombi have been found at various stages of ARF.48 These anatomic alterations were associated with the appearance of filling defects when selective angiography was performed.49 Unfortunately, data are not available regarding the distribution of these defects (homogeneous, dependent, or nondependent?), but obviously the presence of vessel obliteration will alter perfusion distribution. Nonthrombotic obliterative vascular disease may also occur in the early stage of ARF secondary to congestion or compression of vessels, and in the intermediate or late stages of ARF secondary to focal obstruction of small arteries and veins as a result of fibrosis.
Increased SPL in ARF could also cause extrinsic vessel compression: The radiologic equivalent would be the “pruning” of vessels on selective angiography. In early ARF, we found (unpublished observation) that selective angiography was usually positive (filling defects and/or pruning) when the tip of the catheter was positioned in the dependent lung regions (dense areas on CT scan), and negative when it was in the nondependent lung regions. Moreover, we occasionally found changes in the selective angiography findings (from positive to negative) when the patients were turned from supine to prone, and the angiography was repeated in the same lung region.
All these data suggest that the pulmonary flow distribution is altered in ARF. If the compression mechanism and hypoxic vasoconstriction are operating, both should act mainly in the dependent lung regions (less aeration and higher SPL), and the blood flow should partly be diverted toward the nondependent regions, as observed in cardiogenic pulmonary edema.50 This would partly protect against hypoxemia. In fact, it is not unusual to find 60% to 70% of airless lung (in the dependent regions) with a shunt fraction of 30% to 40%.51 This indirectly proves that, in the supine position, part of the pulmonary blood flow is redistributed to the nondependent lung.
To our knowledge, few data are available regarding the distribution of pulmonary blood flow in patients with ARF mechanically ventilated in the prone position. Experimental evidence in dogs suggests that perfusion to the dorsal regions is greater than to the ventral regions in the prone position.46 This occurrence might lead to a more even distribution of blood flow.52 Endogenous nitric oxide plays a role in the regulation of regional pulmonary perfusion. In fact, after the inhibition of nitric oxide synthase by N(G)-monomethyl-l
Stay updated, free articles. Join our Telegram channel

Full access? Get Clinical Tree


