Fig. 8.1
The volume of distribution accounts for the dilution of drug when it is first injected into the body
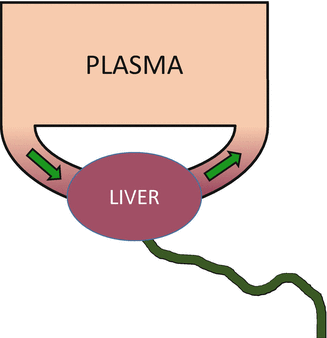
Fig. 8.2
Clearance is the flow of blood or plasma from which the drug is completely removed. If the drug is cleared by the liver, then clearance is liver blood flow times the fraction extracted by the liver
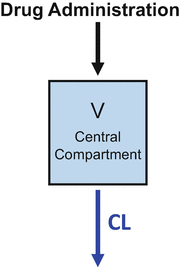
Figure 8.3 combines the basic principles of Figs. 8.1 and 8.2. This is the simple “one-compartment model .” Drug is administered into the “central” (and only) compartment. This is the volume of distribution and is typically designated in equations as V. Drug is removed from the central compartment by the process of clearance. Clearance is typically designated in equations as Cl. When a bolus of drug is injected into a system represented by a one-compartment model , as shown in Fig. 8.3, the drug concentration decreases over time in a log-linear manner.
Most intravenous drugs used in anesthesia practice are very soluble in fat. This is particularly the case with propofol . As a result, the simple one-compartment model shown in Fig. 8.3 can’t describe the drug concentrations observed after bolus drug delivery. To accommodate the movement of drug into body fat requires the addition of a second compartment, as shown in Fig. 8.4. In the two-compartment model , the peripheral compartment is substantially larger than the central compartment, because most anesthetic drugs preferentially partition into body tissues (e.g., fat, muscle) rather than remain in the central compartment (i.e., the blood or plasma).
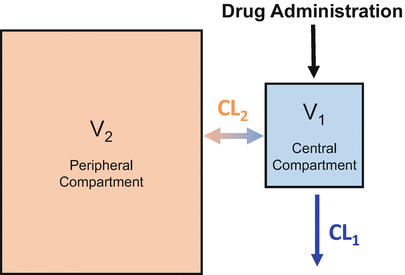

Fig. 8.4
The two-compartment model adds a second compartment to account for preferential uptake by peripheral tissues
The two-compartment model shown in Fig. 8.4 is not satisfactory to describe the behavior of intravenous anesthetic drugs [1]. Figure 8.5 shows the time course of drug concentration following intravenous injection of a typical intravenous anesthetic drug. The simulation is based on fentanyl pharmacokinetics, but the choice of drug and drug dose doesn’t matter. The general behavior which is shown in Fig. 8.5 is shared among the intravenous opioids, hypnotics, and muscle relaxants used in anesthesia. In Fig. 8.5 the Y axis has the units “percent of initial concentration.” That is why it starts at 100 (%).
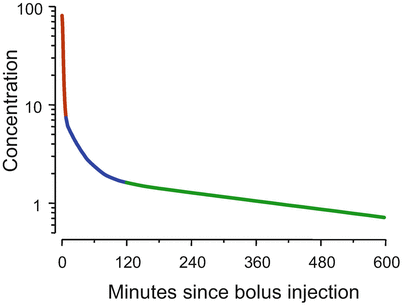

Fig. 8.5
For most intravenous anesthetic drugs, there are three distinct phases following bolus injection. As shown by the dark red segment, initially the concentrations fall by an order of magnitude over a few minutes. In the second phase, shown in blue, the rate at which the concentrations fall diminishes over an hour or so. In the final phase, shown in green, the concentrations decrease in a log-linear manner
The first observation about Fig. 8.5 is that the curve is not straight, even though it is plotted on a log Y axis. That means that the drug cannot be described by a one-compartment model . The second observation is that there are three distinct curve segments. In the first segment, shown in dark red, the drug concentration decreases almost an order of magnitude over a few minutes. In the second segment, shown in blue, the rate of decrease in concentration is initially rapid. However, over an hour or two the rate of decline gradually slows. The third segment, in green, is log-linear.
Figure 8.6 shows the usual interpretation of the three curve segments shown in Fig. 8.5. We can envision the body as being composed of three tanks. There is a central tank, which is where we inject the bolus. There are two peripheral tanks, representing peripheral volumes of distribution . The bigger peripheral tank might represent body fat, while the smaller peripheral tank might represent muscle and rapidly equilibrating tissues. The central tank is connected to two peripheral tanks by pipes at the base. There is also a pipe that drains the central tank. Initially, all of the drug appears in the central tank. The height of fluid in the tank corresponds to drug concentration in each tank.
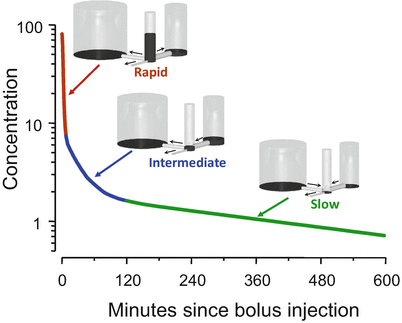

Fig. 8.6
The behavior shown in Fig. 8.5 is explained by a hydraulic model. In this model, there are three tanks, connected by pipes at the base. The drug concentration in each tank is represented by the height of the liquid in the tank. Initially all of the drug is placed in the central tank. Over time, drug flows into the peripheral tanks through the pipes at the base and then returns to the central tank once the concentration is low enough to reverse net drug flow. Drug leaves the system through the small pipe draining the center tank
Initially, during the red segment phase, there are three places for the drug to go. Drug can flow to the tanks on either side of the central tank or can flow out of the system through the pipe draining the central tank. Because there are three pipes that initially drain the tank, the drug concentration falls quickly.
With the transition from the red segment to the blue segment, the drug concentration in the central tank falls below the drug concentration in the tank to the right. Because drug flows down its concentration gradient, when the concentration in the central tank is less than that in the small peripheral tank, drug flow reverses. Drug now returns to the central tank from the peripheral tank. This acts as a brake on how quickly drug concentration can fall in the central tank. It is this reversal of flow that accounts for the gradual slowing of the rate of descent in the blue segment. By the end of the blue segment, the drug concentration in the central tank has fallen below the drug concentration in both peripheral tanks. Drug then returns to the central tank from both peripheral tanks, which greatly slows the rate of drug decrease .
The final, log-linear green segment is characterized as the “terminal slope” of the concentration curve. During this phase, there is only one way for drug to leave the central tank: the drainage pipe. However, as soon as drug leaves the central tank, it is almost (but not quite) replaced by drug that flows in from the peripheral tanks. The result is that the little drain pipe on the central tank is draining all three tanks, not just the central tank. Because it is draining all three tanks, they drain slowly. The log-linear behavior appears because the relative fraction of drug in each tank remains constant once this final equilibration has been reached. It is not a one-compartment model , but because the fraction in each tank remains constant, it behaves like a one-compartment model .
Figure 8.7 shows the three-compartment model corresponding to the three-tank model in Fig. 8.6. Drug is administered into V 1, the central compartment. As mentioned previously, the central compartment is thought of as consisting of the blood (or plasma) and tissues (e.g., the lungs) that equilibrate almost instantly with the blood. Drug equilibrates with two peripheral compartments. V 3, the larger peripheral compartment, is thought to be the fat compartment. V 2, the smaller peripheral compartment, is thought to represent muscle and rapidly equilibrating tissues. CL1 is the clearance from the central compartment, which often represents hepatic clearance (although remifentanil is cleared by nonspecific plasma and tissue esterases). CL2 is the clearance between the central compartment and compartment 2. CL3 is the clearance between the central compartment and compartment 3.
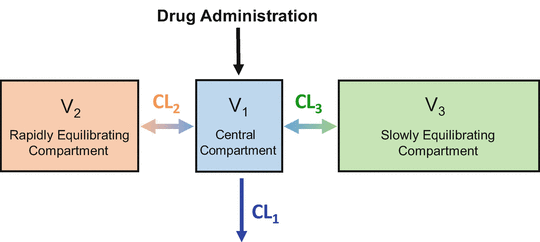

Fig. 8.7
This is the three-compartment model that is both necessary and sufficient, to describe the pharmacokinetics of most intravenous anesthetic drugs. It is a compartmental representation of the hydraulic model in Fig. 8.6
For the purposes of explaining the principles of TCI, I will represent the three-compartment model as being “true.” However, the model is “true” only to the extent that the three-compartment model accurately predicts drug concentration following any arbitrary dose. Compartment models are merely mathematical relationships expressed as volumes and clearances. The only component of these models that matches real physiology is central clearance, CLL. All three volumes, and both peripheral clearances, are just empirically derived terms that describe the pharmacokinetics . They only vaguely relate to true anatomic structures and physiological processes.
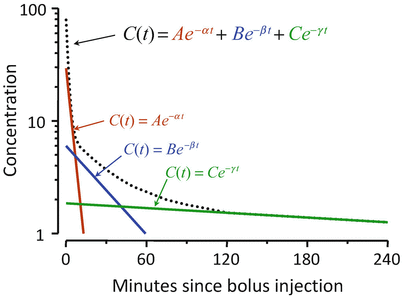
Figure 8.8 shows the mathematics that is embodied in the three-compartment model . The blood (or plasma) concentration over time following bolus injection (black dots) is described by the sum of three exponential terms,  . The three individual exponential components appear as color-matched lines. The terms A, B, C, α, β, and γ in the triexponential equation can be mathematically converted into V 1, V 2, V 3, CL1, CL2, and CL3 in the compartmental representation through a complex calculation.
 . The three individual exponential components appear as color-matched lines. The terms A, B, C, α, β, and γ in the triexponential equation can be mathematically converted into V 1, V 2, V 3, CL1, CL2, and CL3 in the compartmental representation through a complex calculation.
Fig. 8.8
The three-compartment model shown in Fig. 8.7 captures the same mathematical relationship as the sum of exponentials shown here following bolus injection. The overall shape of the curve is the sum of three separate mono-exponential equations, which are color-matched here. The models in Figs. 8.7 and 8.8 can be interconverted mathematically
Pharmacodynamics
Anesthetic drugs work in tissues, not in the blood or plasma. Understanding the behavior of anesthetic drugs in the blood (or plasma) is necessary to understanding target-controlled drug delivery, but it is not enough. We also need to understand the process by which the blood (or plasma) concentration equilibrates with the concentration of drug at the site of drug effect. Equilibration models were originally proposed by Sheiner [2], and independently by Hull [3], to describe the onset of neuromuscular relaxation following administration of d-tubocurarine and pancuronium, respectively. Equilibration models have been created for nearly all intravenous anesthetic drugs, including opioids and propofol . Because nearly all of these have measured plasma concentration, rather than blood concentration, I will refer to the process as plasma-effect site equilibration.
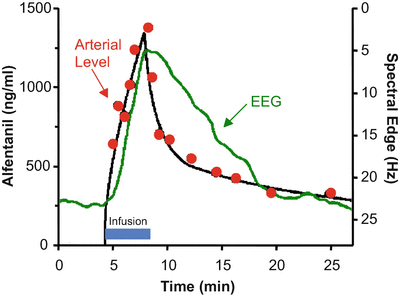
Figure 8.9 shows the rise and fall in arterial drug concentration during a brief infusion of fentanyl [4]. The blue bar shows the duration of the fentanyl infusion. During the infusion, the arterial fentanyl concentrations (red dots) rise rapidly, reaching a peak by the end of the infusion. Once the infusion is turned off, the plasma fentanyl concentrations fall very quickly, consistent with the red segment of Figs. 8.5 and 8.6. The black line is the fit of a three-compartment pharmacokinetic model to the arterial fentanyl concentrations. The green line is fentanyl drug effect on the brain, as determined using 95 % EEG spectral edge frequency (shown on the Y axis to the right of the data). The spectral edge is about 18 Hz at baseline. During the fentanyl infusion there is initially no change in spectral edge, reflecting the delay caused by plasma-effect site equilibration. About 2–3 min after starting the fentanyl infusion, the spectral edge starts to respond. It then rises quickly, as drug continues to cross from the plasma into the brain. Because of this equilibration delay, the spectral edge continues to rise for 1–2 min after turning off the infusion, simply because it takes a few minutes for the fentanyl concentration in the plasma to drop below the fentanyl concentration in the brain. The brain recovers much more slowly than the plasma, again reflecting the delay in plasma-brain equilibration .
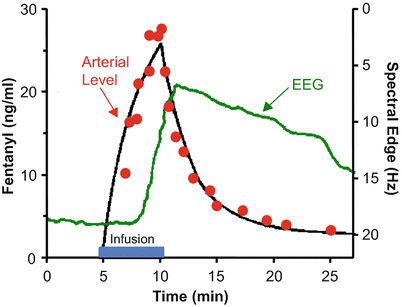

Fig. 8.9
Stanski and colleagues used infusions of fentanyl and alfentanil to characterize the equilibration delay between the plasma and the brain. This figure, adapted from Scott et al. [4], shows the arterial fentanyl concentration (red dots), the pharmacokinetic fit to the concentration (black line), and the 95 % EEG spectral edge (green line). There is a delay of several minutes between changes in arterial fentanyl concentration and the brain response
Figure 8.10 shows the same experiment repeated for alfentanil [4]. The rise and fall in arterial alfentanil concentrations in Fig. 8.6 is not very different from the rise and fall in fentanyl concentrations in Fig. 8.5. However, the brain response is very different. The EEG starts to respond within a minute to the rising alfentanil concentration. After the alfentanil infusion is turned off, the EEG begins to fall almost immediately, again reflecting the rapid plasma-brain equilibration of alfentanil. The plasma-brain equilibration delay for remifentanil is very similar to that of alfentanil, shown in Fig. 8.6.
The plasma-brain brain equilibration delay shown in Figs. 8.9 and 8.10 can be incorporated into a pharmacokinetic model by adding an “effect site” to the model, as shown in Fig. 8.11. The effect site is connected to the plasma by a pipe, shown as the red arrow from the plasma to the effect site. In the model, the effect site is assumed to have trivial (nearly 0) volume, and so very little drug actually flows to the effect site. Drug is removed from the effect site by a clearance process that is defined by a single rate constant: k e0. Because the effect site is arbitrarily small, the rate of plasma-effect site equilibration is completely determined by the value of k e0. As will be demonstrated below, it is important to know the value of k e0 for drugs given by TCI, because this information allows you to titrate the drug concentration in the brain, where the drugs actually work, rather than the concentration in the plasma.
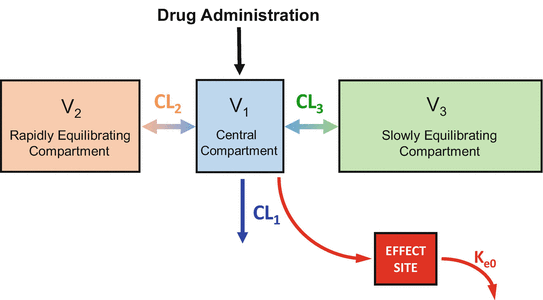

Fig. 8.11
For intravenous anesthetics, it is possible to fully account for the equilibration delay between the plasma and the site of drug effect by adding an effect site to the model. The equilibration delay requires only one additional parameter, k e0
How TCI Pumps Work
TCI devices consist of three components, a computer, an infusion pump, and the interface between them. The computer is responsible for interacting with the user. Based on this interaction, the computer selects the pharmacokinetic model and calculates the infusion rate required to rapidly achieve and maintain desired drug concentration. The infusion pump gives drugs at a constant rate, based on instructions from the computer. While this may seem like a simple task, the pump has many sensors to measure how much drug was given every moment and detect any problems (e.g., air-in-line, occluded tubing). These must be communicated quickly to the computer. The interface provides a two-way link between the computer and the pump. At regular intervals (e.g., every 10 s), the communication link transmits a status update from the pump to the computer. The computer determines the infusion rate necessary to rapidly achieve and maintain the desired concentration and transmits the necessary instructions to the pump. The computer also updates the pharmacokinetic model (e.g., Fig. 8.11) and the real-time display of the patient status to the clinician. These three components are integrated into a single device in commercial TCI systems.
When the pharmacokinetics of drugs are described by a one-compartment model , as shown in Fig. 8.3, then it is easy to rapidly achieve and maintain a steady drug concentration. Let’s say you want a drug concentration of 2 units/ml. You first give a bolus of drug that is 2 × V, the volume of distribution. That will immediately achieve the desired concentration of 2 units/ml. You then start an infusion, set to 2 × clearance. That will maintain a concentration of 2 units/ml. If anesthetic drugs were described by one-compartment models, there would be very little for a TCI computer to calculate. Unfortunately, an initial bolus followed by a constant-rate infusion is unable to rapidly achieve and maintain a stable drug concentration for any of the intravenous anesthetics, because none of them are described by one-compartment models.
In 1968 Kruger-Thiemer [5] published the equations needed to rapidly achieve and maintain a steady-state concentration for drugs described by a two-compartment model . This was extended to an arbitrary number of compartments in 1981 by Schwilden [6]. As noted by both authors, the infusion rates must decrease exponentially to maintain a steady concentration, reflecting the accumulation of drug in peripheral compartments.
To understand TCI it is not necessary to understand exponentially decreasing infusion rates. While these are required to maintain steady concentrations, that is not the goal during anesthesia. The goal is to rapidly achieve, maintain, and titrate the anesthetic drug effect. If everything is stable, then a steady concentration is fine. However, in anesthesia very little is “stable.” Surgical stimulation varies throughout the case. The patient’s tolerance for hemodynamic depression may change over the course of anesthesia. Coadministration of other drugs may alter anesthetic requirements. The goal is not to maintain a single steady concentration. The goal is to titrate the intravenous anesthetic in a highly controlled manner [7, 8].
Stay updated, free articles. Join our Telegram channel

Full access? Get Clinical Tree


