Fig. 23.1
a Propofol TCI set at 3 μg/ml, b MCI propofol infusion regimen, designed to give a plasma concentration of 3 μg/ml: 1 mg/kg bolus, 10 mg/kg/h, reduced to 8 mg/kg/h at 10 min, reduced to 6 mg/kg/h at 20 min. Large arrow bolus dose, solid line plasma concentration μg/ml, white boxes infusion rate ml/h
Now, consider a further thought experiment in which we communicate these two methodologies to a first year resident and, even more challenging, a senior colleague not familiar with intravenous anesthesia practice.
For TCI the simple instructions are easy to follow: enter the patient details and propofol concentration into the pump, select a target of 3 and press start.
In comparison the instructions for the MCI involve the following steps:
- 1.
Calculate the bolus dose as follows:

- 2.
Calculate initial infusion rate as follows:

- 3.
Enter these details and press start.
- 4.
Calculate the second infusion rate as follows:

- 5.
Calculate the third infusion rate as follows:

At this point our senior colleague is likely to decide that TIVA does not suit his clinical practice. Our resident, who is keen to learn a new technique, is likely to point out that the bolus and initial infusion rate, using 1 % propofol, are numerically the same as the patient’s weight in kg. He notes that after 10 min the infusion rate is reduced by one fifth and then by one quarter after 20 min and is likely to conclude this as relatively straightforward.
Now we need to consider titration of our hypnotic infusion and infusion of an opiate. With TCI the anaesthesiologist simply selects a lower or higher target depending on the response of the patient and can likewise start a TCI of opiate. With MCI , if the infusion rate is doubled at 10 min, it will take approximately 10 min before the plasma concentration has doubled. Halving the infusion rate at this point will not result in a halving of the plasma concentration, no matter how long we wait. This is because of the drug that is already in the body and the fact that a fixed infusion rate of propofol will result in plasma concentrations that rise until steady state is reached. This will take more than 24 h in the case of propofol. In contrast doubling the set target concentration with a TCI at 10 min results in a doubling of the plasma concentration in less than 1 min. Halving the TCI target at 20 min results in a halving of the plasma concentration in less than 5 min. This is because the TCI system switches off the infusion, allowing the plasma concentration of propofol to fall as rapidly as possible, as dictated by the kinetics of the drug (see Fig. 23.2) and then restarts the infusion at an appropriate lower concentration. In order to achieve a similar rapidity of titration with MCI , for an increase in the desired plasma concentration, the anaesthesiologist would have to calculate a small supplementary bolus size and a new infusion rate. For a decrease in the desired plasma concentration, he will have to calculate an interval of zero infusion and a new infusion rate thereafter. All these calculations are complex for propofol (and all other anesthetic drugs) as they depend on the interplay between three exponential processes, how much drug has been delivered and the duration of infusion (see Chaps. 6—Raeder and 25—Anderson on PK/PD).
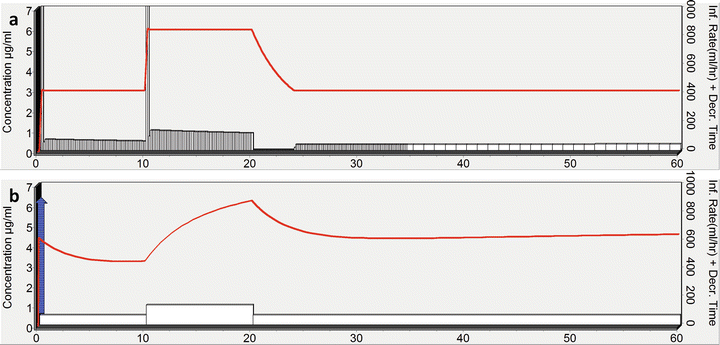

Fig. 23.2
Comparison of titration with TCI and MCI : a propofol TCI 3 μg/ml initial target increased to 6 μg/ml at 10 min, decreased back to 3 μg/ml at 20 min; b MCI propofol infusion regimen 1 mg/kg bolus, 10 mg/kg/h increased to 20 mg/kg/h at 10 min, reduced back to 10 mg/kg/h at 20 min. Large arrow bolus dose, solid line plasma concentration μg/ml, white boxes infusion rate ml/h
At this point our keen resident should logically concede that the TCI methodology will be easier to learn and implement than MCI . With the MCI methodology the anaesthesiologist’s focus is on drug calculations, infusion rates and timings, at a time when the he should be focusing on his patient. The TCI methodology allows rapid stepwise changes in the plasma propofol concentration, in a manner analogous to the use of a calibrated vaporiser. The anaesthesiologist needs to only decide if more, less or the same target is required, and titration is simply achieved by changing one number, the target concentration.
There is also brevity in the description of dosing with TCI. What response do I give if a colleague asks “what sedative dose of propofol do I need for conscious sedation”? When describing TCI dosing, I can say “around 1–2 μg/ml titrated to effect”. This description includes the automatically calculated loading dose and rate adjustment over time, which will be identical for all patients with the same characteristics and for the same target concentrations. With MCI I would have to specify a loading dose range in mg/kg and a maintenance infusion regimen with a wide range in mg/kg/h, to account not only for interindividual differences in pharmacokinetics and pharmacodynamics but also for the changing relationship between infusion rate and plasma concentration (as the propofol concentration gradient between the central and other compartments gradually decreases). As we will see in the case studies that follow, TCI dosing facilitates easy communication and understanding of dosing strategies for TIVA, in a wide range of cases.
The illustrations we have looked at so far have only considered the blood (or plasma) concentration of propofol, whereas the blood compartment is not the site of action of propofol. While we know that the site of action of the hypnotics is somewhere in the brain, it is by no means certain where and how in the brain this action occurs. Therefore the site of action is commonly referred to rather vaguely as the effect site (see Fig. 23.2, Chap. 25 [Anderson]).
Before continuing to the case studies, we will therefore briefly consider the modelling and relevance of the effect-site concentration.
Effect-Site Concentration
I can clearly remember an incident during my first few weeks as an anesthesia senior house officer in the UK. A senior colleague was teaching me about induction of anesthesia, at the time using thiopentone (as propofol was a new drug that was then considered to be expensive and not regularly used). He informed me that if I injected an appropriate dose, anesthesia would be induced within one “arm-brain circulation time”. The underlying assumption made was that equilibration across the blood-brain barrier is instantaneous. Now that we have a better understanding of drug PK/PD, we know this to be untrue. In fact thiopentone does equilibrate more rapidly with the brain than propofol (this is one of the reasons why some still recommend thiopentone for rapid sequence induction of anesthesia), but this equilibration is by no means instant.
Each drug appears to have a unique equilibration profile presumably related to its physiochemical properties and mechanism of receptor interaction. Hypnotic agents have to diffuse across the blood-brain barrier (BBB) and then to their site of action. At the site of action, a hypnotic/receptor interaction occurs which then induces changes within the brain, resulting in a change in conscious level. The time taken for this process can be modelled by objectively measuring the clinical effect—usually by means of a form of processed EEG. One of the parameters derived from this PD modelling is a rate constant (K e0), which can be used to calculate a theoretical effect-site concentration. This assumes that the drug has maximal effect when blood and brain concentrations equilibrate. This assumption cannot be tested in practice, as we don’t currently have the means to measure the hypnotic concentration at the site of its action (the brain). We rely instead on a derived surrogate measure of drug effect. As there is no standardised effect measure, or agreed methodology in the literature, and significant variation is seen between subjects within individual studies, various values for the K e0 of propofol have been published in the literature.
As mentioned, using PD modelling we can derive a K e0 and estimate an effect-site concentration of the hypnotic, which should better relate to conscious level and depth of anesthesia. Figure 23.3 shows a simulation of the time course of plasma and effect-site concentrations following a bolus dose of propofol and thiopentone . Both drugs rapidly achieve a peak plasma concentration. Thiopentone has a more rapid initial decay due to its rapid redistribution, but it also has a more rapid effect-site equilibration rate due to a “faster K e0”. The result of both these factors is a more rapid time to peak effect (T PEAK). The T PEAK for thiopentone is about 1.5 min compared to about 3.5 min for propofol using the Marsh PK/PD model1 [5]. The clinical consequence is that in experienced hands thiopentone can achieve rapid and safe induction of anesthesia. The longer delay to peak effect seen with propofol means that an anaesthesiologist is more likely to overdose during bolus induction, particularly if he is thinking in terms of “one arm-brain” circulation time and is overhasty in administering subsequent doses. The rapid initial decrement in blood concentration seen with thiopentone , and this, coupled for the fast K e0 is the reason for the short duration of effect of a single bolus. While this has some benefits, it has been implicated in awareness during rapid sequence induction, when difficulties with the airway may result in delays in attaining adequate inhalational agent levels [1]. Anesthesiologists considering administering additional boluses of thiopentone should of course remember that it is slowly metabolised. This results in a long elimination half-life, so that significant accumulation occurs with multiple boluses or infusions and may result in delayed awakening.
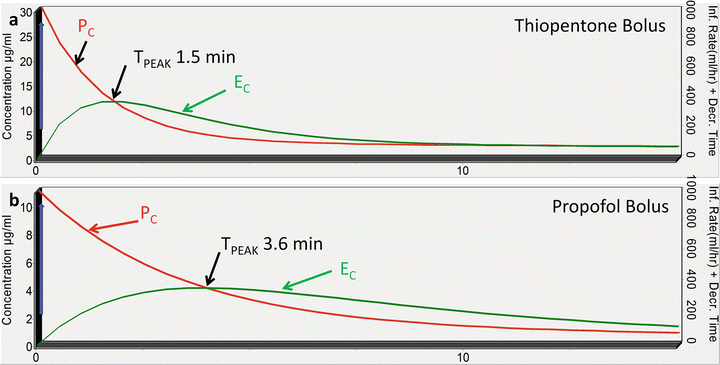

Fig. 23.3
Bolus dose of a thiopentone and b propofol. Effect-site concentration (C e): plasma concentration (C p), time to peak effect (T PEAK)
Clearly, among other pharmacokinetic and pharmacodynamic issues, the anaesthesiologist also needs to consider the speed of equilibration between plasma and effect site during TIVA administration and in particular at induction, during titration and during emergence.
MAC Equivalence EC50
No new volatile agents have been developed in recent decades. Nonetheless, if an anesthetist is faced with an unfamiliar or new volatile agent, he will soon want to know the MAC50 or MAC of the agent. The MAC50 is the minimum alveolar concentration associated with a 50 % probability of movement in response to skin incision. This will immediately allow an assessment of potency of the new agent and give a guide to dosing. An analogous measure for intravenous agents is the effective concentration resulting in a 50 % probability of movement in response to skin incision (EC50). This can be determined for an intravenous agent for a single drug or a combination of agents, and we will discuss this in more detail later in this chapter. For now we will concentrate on a single agent used for induction of anesthesia. The EC50 for loss of consciousness (EC50 LOC) can be determined for both plasma and effect-site concentrations. These values may differ substantially depending on the method of induction. The faster the induction dose is given, the more the effect-site concentration (C e) and plasma concentration (C p) will differ at various clinical end points. Figure 23.4 illustrates induction of anesthesia with 3 different infusion rates 1200, 600 and 300 ml/h. The data are also presented in Table 23.1 [6]. The lowest infusion rate results in the longest induction time and the lowest induction dose. As can be seen from the data, the C p at LOC varies from 4.3 μg/ml at the 300 ml/h induction rate up to 9.2 μg/ml at the 1200 ml/h induction rate. However, the calculated C e for LOC is similar for all three infusion rates at around 1 μg/ml and essentially rate independent. Thus it is more appropriate to consider the C e LOC when comparing induction strategies in our case studies to follow.
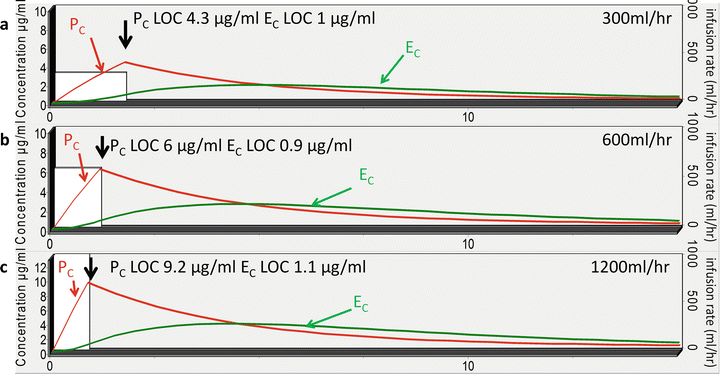

Fig. 23.4
Induction of anesthesia with different rates of infusion: a 300 ml/h, b 600 ml/h, c 1200 ml/h. Effect-site concentration (C e), plasma concentration (C p ), plasma concentration at loss of concentration (C p LOC), effect-site concentration at loss of consciousness (C e LOC). White boxes infusion rate ml/h. Data re-simulated from the infusion rate and induction times from Peacock and co-workers [6] using Tivatrainer with Marsh PK/PD
Table 23.1
Blood and effect-site concentration at loss of consciousness for 3 different infusion rates
C p LOC | C e LOC (μ/ml) | |
|---|---|---|
1200 ml/h | 9.2 | 1.1 |
600 ml/h | 6.0 | 0.9 |
300 ml/h | 4.3 | 1.0 |
Case Studies
All the cases detailed below are taken from real patients to whom I or my colleagues have administered TIVA. All propofol TCI infusions were delivered using the standard Marsh model in plasma control mode with 1 % propofol. Remifentanil TCI infusions were delivered using the Minto model in plasma control mode with a syringe concentration of 20 μg/ml (1 mg in 50 ml 0.9 % NaCl). The timeline displayed in the text is in the format hh:mm:ss, and time 00:00:00 is the start time of anesthesia. The C p and C e time course presented in the figures are simulated using Tivatrainer ©2. For a video of the TIVAtrainer output, and a sound recorded during the case, see the online material.
Induction of Anesthesia
Case Study 1
First let us consider a simple single agent induction of anesthesia with propofol, in a 68-year-old male who weighs 82 kg and is 170 cm tall, attending for inguinal hernia repair surgery. He has a history of stable angina on beta-blocker therapy and as required nitroglycerine spray. He is otherwise fit and healthy. In this case we started a TCI of propofol at 4 μg/ml, using the Marsh model in plasma control. Figure 23.5 and Video 23.1 show the time course of the C p and C e. Below is the clinical course from induction (time zero).
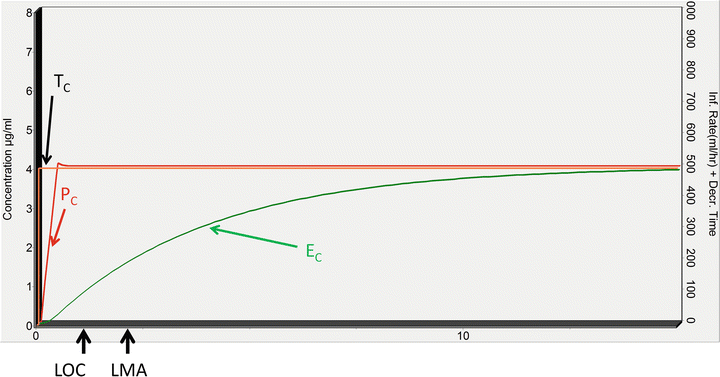

Fig. 23.5
Case study 1: propofol TCI induction of anesthesia 4 μg/ml. Target concentration (T C), effect-site concentration (C e), plasma concentration (C p), loss of consciousness (LOC), loss of eyelash reflex (LER), laryngeal mask airway insertion (LMA)
00:00:00
Haemodynamics : blood pressure (BP) 122/77 mmHg, heart rate (HR) 69/min, pulse oximeter oxygen saturation (SpO2) 98 %. Initial propofol TCI target set at 4 μg/ml.
00:00:28
The C p is now calculated to have reached the target of 4 μg/ml, achieved with a loading dose of 8 ml (80 mg). I speak to the patient and he responds with no discernible change in conscious level; the temptation is to increase the target, but if we look at the calculated C e, it is still only 0.2 μg/ml, so we wait without changing the target.
00:00:50
The patient yawns and is not as attentive to his surroundings. The C p has not changed, but the C e has risen to 0.6 μg/ml. The total dose given to the patient at this stage is 87 mg; BP is now 112/71, HR 62 and SpO2 99 %.
00:01:01
The patient looses response to verbal contact, but eyelash reflex remains, the C e is now 0.8 μg/ml and 90 mg of drug has been delivered.
00:01:36
The eyelash reflex is lost and the patient’s airway is supported by face mask with 100 % 02; BP 97/58, HR 55 and SpO2 97 %, the C e has now risen to 1.2 μg/ml and 102 mg of propofol has been delivered. At this point the anaesthesiologist checks the slackness of the jaw but feels the patient is not yet ready for insertion of the laryngeal mask airway (LMA) .
00:02:26
The C p is still 4 μg/ml as we have not changed the target; the C e is now 1.7 μg/ml and 118 mg of propofol has been delivered. The jaw is now slack and a LMA is inserted successfully at first attempt; repeat haemodynamics reveal a BP of 105/65 and HR 72, following the mild stimulation of the LMA insertion.
In this example we have achieved a smooth induction of anesthesia and LMA insertion with minimal effect on haemodynamics in an elderly patient with a history of cardiovascular disease. The system delivered a total induction dose of almost 120 mg (1.46 mg/kg) of propofol over 2.5 min, in keeping with dosing recommendations in the elderly (1.5–1.75 mg/kg) [7]. Delivering this dose over a longer time frame is likely to result in less cardiovascular depression. The high peak blood concentration seen with bolus dosing has been avoided, at the expense of prolonging the induction time. The same dose given as a bolus would result in a peak blood concentration of 6.4 μg/ml. If we assume that the patient would lose consciousness at the same effect-site concentration of 0.8 μg/ml, then this would be achieved at 38 s. However, we would likely see a bigger decline in BP, as propofol has a direct vasodilatory effect on the vasculature, as well as a centrally mediated cardiovascular depressant action.
It is important to realise that there is variability between patients with respect to both PK and PD. Typically PK variability results in 30–35 % variation in blood concentrations given the same dosing regimen. However, PD differences mean that the effect a given blood concentration can vary as much as 100 % between individuals. Some of this variability is predictable from patient factors such as age and previous exposure to drugs. In practice it is always important to titrate to drug effect in an individual patient, rather than giving the same dose to all patients. Table 23.2 illustrates the difference in two patients of similar age with respect to their response to a TCI of propofol set at 4 μ/ml. Patient 1 is the patient we discussed in the example above. Patient 2 is a 69-year-old male of similar body habitus. The second patient loses consciousness at a higher effect-site concentration 1.5 μ/ml compared with the first patient 0.8 μ/ml, showing almost a 100 % difference. Some of this difference may be due to PK differences, but it is more likely to be related to PD variability.
Table 23.2
Comparison of propofol induction dose requirements and induction time , for two patients of similar age and weight, together with a younger patient
C e LOC (μ/ml) | C e LER (μ/ml) | T LOC (mm:ss) | T LER (mm:ss) | Propofol LOC (mg) | Propofol LER (mg) | |
|---|---|---|---|---|---|---|
Case study 1 age 68, weight 82 kg, height 176 | 0.8 | 1.2 | 01:01 | 01:36 | 90 | 102 |
Similar patient age 69, weight 82 kg, height 174 | 1.5 | 1.9 | 02:01 | 02:35 | 110 | 122 |
Young patient age 28, weight 75, height 179 | 1.8 | 2.2 | 01:02 | 01:36 | 172 | 182 |
Case Study 2
Now we will consider a younger male patient aged 28, with weight 75 Kg, height 179 cm and no comorbidity. In this case we would expect the patient to be less sensitive to propofol and to have more cardiovascular reserve. In order to have a shorter induction phase in this patient, we select a higher initial target of 8 μg/ml to drive the drug into the effect site. Once loss of consciousness is achieved, the target concentration of propofol is reduced to 4 μg/ml. Figure 23.6 and Video 23.2 show the time course of the blood and effect-site concentrations of propofol during this case, and the induction doses and times are presented in Table 23.2.
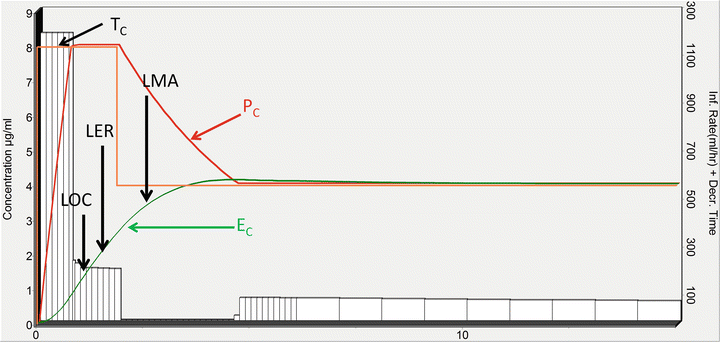

Fig. 23.6
Case study 2: induction with TCI propofol 8 μg/ml reduced to 4 μg/ml following induction of anesthesia. Target concentration (T C), effect-site concentration (C e), plasma concentration (C p), white boxes infusion rate ml/h, loss of consciousness (LOC), loss of eyelash reflex (LER), laryngeal mask airway insertion (LMA)
00:00:00
The initial propofol target concentration is set at 8 μg/ml. BP is 122/77, HR 69 and SpO2 97 %.
00:00:47
A loading dose of 152 mg has been delivered. The infusion rate is now 238 ml/h, the C p is 8 μg/ml but the C e is still only 0.8 μg/ml. The patient’s eyes are open, he is looking around, the BP has dropped to 112/71 and HR is 62 and SpO2 99 %.
00:01:10
The patient’s eyes are closed, but he responds to the question “are you feeling sleepy” in the affirmative. The C p is maintained at 8 μg/ml (this calculated value will not change until a new target is set), the C e has risen to 1.6 μg/ml and the infusion rate is now 219 ml/h.
00:01:20
The patient looses response to verbal communication at a C e of 1.8 μg/ml, a total of 172 mg of propofol have been delivered and BP is 97/58, HR 56 and SpO2 98 %.
00:01:36
The eyelash reflex is lost, the C e is 2.2 μg/ml and bag mask ventilation is commenced; infusion rate is 217 ml/h and 182 mg of propofol has been delivered.
00:01:50
The target concentration is reduced to 4 μg/ml, the C e is currently 2.6 μg/ml and a total of 190 mg of propofol has been infused. The infusion rate is now 0 ml/h, as the system has switched off the infusion to allow the C p to fall as quickly as possible to the new target. BP is 85/54, HR 48 and SpO2 98 %.
00:02:20
The infusion rate is still zero as the calculated C p of 7 μg/ml is above the set target of 4 μg/ml. The C e is now 3.3 μg/ml and continues to rise despite the infusion rate being zero, as there is still a concentration gradient between plasma and effect-site concentrations. The jaw is now relaxed and an LMA is inserted. Following this mild stimulus the BP is 107/67, HR 55 and SpO2 97 %.
00:04:50
The C p and C e have now equilibrated at 4 μg/ml, the system has restarted and the infusion is at 95.7 ml/h. A total of 194 mg of propofol has been delivered. Before surgery starts an opiate TCI will be started to blunt the response to surgical stimulation. The plan would be to have the C e of hypnotic/opiate combination at around the EC95 as a starting point for maintenance. However, the clinician always needs to adjust these values according to the patient’s response, to the induction phase and proposed surgery and to its associated degree of stimulation. We will consider the concept of hypnotic/opiate EC95 in more detail in the case studies to follow.
In this case we have started with a high initial target concentration, which results in a larger loading dose, achieving a high C p to drive the drug into the brain. In this healthy young individual who has a reasonable cardiovascular reserve, this is well tolerated. However, this is not a technique to use in the elderly or cardiovascularly compromised patients, as such patients are likely to have a steep decline in their blood pressure. In these patients a more cautious approach is merited. We have seen such an approach in case one. In more fragile patients, it is often better to select an even lower target and titrate up slowly, allowing time for effect-site equilibration. This technique will result in a more stable haemodynamic response, but will also result in a slow induction phase. The patient will pass through progressively deeper levels of sedation before losing consciousness. An alternative approach for such patients is to use a lower dose of hypnotic combined with an opiate. We will consider these combinations for both induction and maintenance in the cases that follow. However, many colleagues prefer to use TCI propofol as a sole induction agent, in order to gauge the individual patient’s response, as a guide to dosing and an indication of the wakening concentration of hypnotic. The C e at loss of consciousness (C e LOC) can indicate if the patient is sensitive or relatively resistant to propofol and guide initial maintenance dosing. There is also some evidence to support the fact that the C e LOC but not the C p LOC is a guide to the C e at recovery of consciousness (C e ROC). Milne and colleagues determined the values for calculated plasma and effect-site concentrations of propofol at LOC and ROC in three remifentanil groups, low, medium and high [8]. The data is presented in Fig. 23.7. The mean value for C e LOC was 2.08 (1.85–2.32) μg ml−1 and that for C e ROC 1.85 (1.68–2.00) μg/ml. These are calculated values using the Marsh model for propofol; however, this relationship does not hold up using the Schnider model for propofol, which predicts a much higher C e LOC than C e ROC. Of course there are many potentially compounding factors; the level of stimulus from the wound during recovery will have a profound effect on the C e ROC. If a good-quality regional block is in place, the patient is likely to wake up at a lower C e, than if there is significant pain from the wound. Also the nature of surgery, body surface vs. body cavity procedures. Finally the concomitant concentration of opiate in the patient will also affect the recovery concentration. Interestingly this study showed little difference in propofol C e ROC, between the three remifentanil groups; testament to the unique and rapid metabolism of this drug even after prolonged infusion.
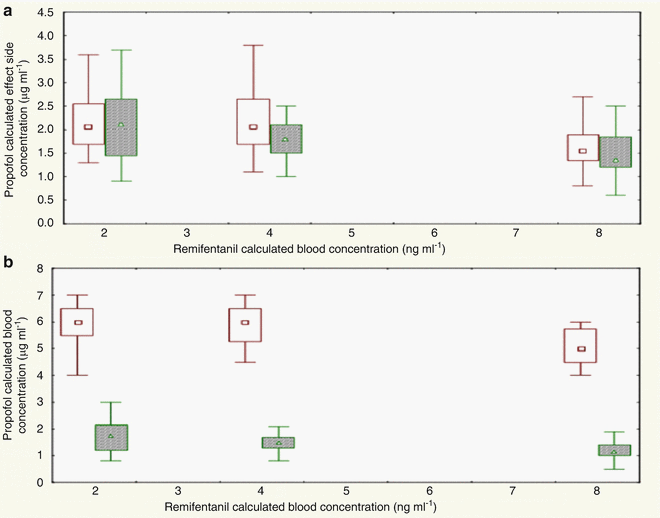

Fig. 23.7
a Propofol plasma concentration at loss of and recovery of consciousness, b propofol effect-site concentration at loss of and recovery of consciousness [8]
Drug Interactions and Induction of Anesthesia
Milne and co-workers also studied the interaction between remifentanil and propofol during induction of anesthesia. They found a calculated C e propofol of around 2 μg/ml at LOC, in the presence of a calculated C e remifentanil of 2 ng/ml, and this was reduced to around 1.5 μg/ml with an associated C e remifentanil of 8 ng/ml. However, there was a large range with almost 300 % interindividual variation, again emphasising the need to titrate the dose to the individual.
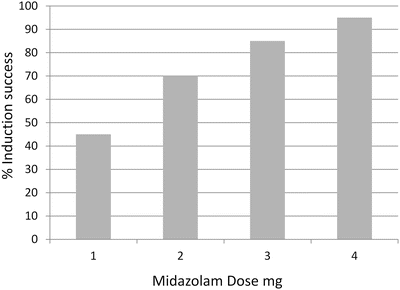
Similarly a concurrent dose of a second hypnotic such as midazolam reduces the propofol requirements for loss of consciousness. Tzabar and colleagues showed an increasing success rate of induction of anesthesia in response to a TCI of propofol set at 4 μg/ml, with increasing doses of midazolam, as represented in Fig. 23.8 [9].

