Pressure-Support Ventilation: Introduction
Pressure-support ventilation (PSV) is a mode of partial ventilator support. Such modes are widely used in intensive care units (ICUs) because most ventilated patients (unless deeply sedated) have preserved respiratory drive. The use of these modes helps to reduce need for sedation, an important issue in the ICU,1,2 and potentially prevents disuse atrophy of the respiratory muscles that can result from controlled ventilation.3,4 This preventive effect has been shown experimentally with different modes of partial support.3,5 Finally, partial support may facilitate both the screening process for detecting patients able to breathe spontaneously as well as the weaning of patients with prolonged or difficult weaning.6 An ideal mode of partial support should be able to supply both full ventilator support and optimal support during weaning; optimize patient–ventilator synchronization and comfort while reducing the need for sedation and the risk of cardiovascular consequences; and, if possible, facilitate or reduce the duration of the weaning. PSV meets several of these requirements, at least partially, as discussed in this chapter. PSV also has limitations, which are delineated. One important limitation is that overassistance of the patient can be easily reached and improvement in the delivery of the optimal PSV level continues as a field of research.
PSV can be remarkably effective in reducing patient effort and avoiding respiratory distress, and can offer a comfortable ventilator support to many patients. PSV can also deliver support much in excess of patient needs and results in excessive delivered volume, excessive duration of inspiration relative to neural inspiratory time (TI), or both. Much recent research has been undertaken to understand and analyze the consequences of delivering of excessive pressure. Many benefits of PSV, which provides greater freedom to the patient than traditional modes, can be obscured by improper usage.
Epidemiology
Some clinicians view PSV primarily as a mode devoted to weaning and only consider its use until late in a patient’s course.6 An international survey on mechanical ventilation in 361 ICUs in twenty countries was conducted in 1998 (published in 2002).7 On the first day, PSV was used in less than 10% of all patients; the combination of SIMV with PSV was used in almost 15%, and assist-control in approximately 60% of the patients. A low level of PSV was used to perform a once-daily weaning attempt in 28% of such attempts, a gradual reduction of PSV was used as the sole weaning method in 21% of cases, and a gradual reduction of synchronized intermittent mandatory ventilation (SIMV) and PSV was used in 22% of all cases. Overall, PSV was used (one way or another) for 45% of weaning attempts, suggesting that clinicians consider weaning as the main indication for PSV.
In 2004, Esteban et al repeated the prospective international observational cohort study, employing a nested comparative study performed in 349 intensive care units in twenty-three countries, and compared the findings with the 1998 cohort.8 Whereas the use of a T piece was the most common initial method for spontaneous breathing trials, the use of low levels of pressure support for weaning trended upward over time (10% vs. 14%). Among patients not extubated, methods for gradual withdrawal differed: there was a decrease in the use of SIMV and of SIMV combined with PSV, and a major increase in the use of PSV for weaning (19% vs. 55%) between the two observation periods. This international survey was repeated a third time, on a larger scale in 2010 and included more than 8000 patients. The initial results indicate that after more than 6 days of mechanical ventilation, PSV was now the most frequently used ventilator mode, indicating progressive dissemination in the use of this technique over the years.9
Differences among Mechanical Ventilators Definition and Phases
PSV is a pressure-targeted (or limited) mode in which each breath is patient-triggered and supported.10–13 It provides breath-by-breath support by means of a positive-pressure boost synchronized with inspiratory effort: patient initiated and flow terminated (Fig. 8-1). During inspiration, airway pressure is raised to the preset pressure-support level. The speed of pressurization is system specific but most recent ventilators offer the possibility of adjusting this pressurization rate. Throughout the inspiratory phase, the ventilator works as a pressurized demand-flow system at a predetermined pressure level. PSV is maintained until the machine determines the end of expiration, supposedly reflecting the end of patient demand. The expiratory trigger mechanism is based on decay of inspiratory flow. When inspiratory flow falls below a threshold value, which should indirectly indicate that the inspiratory muscles have relaxed, the ventilator cycles to the expiratory phase releasing the PSV and opening its expiratory port. A level of positive end-expiratory pressure (PEEP) lower than the inspiratory plateau pressure can then be applied. PSV can thus be defined as a patient-initiated (pressure or flow), pressure-targeted, flow-cycled mode of mechanical ventilation.
Figure 8-1
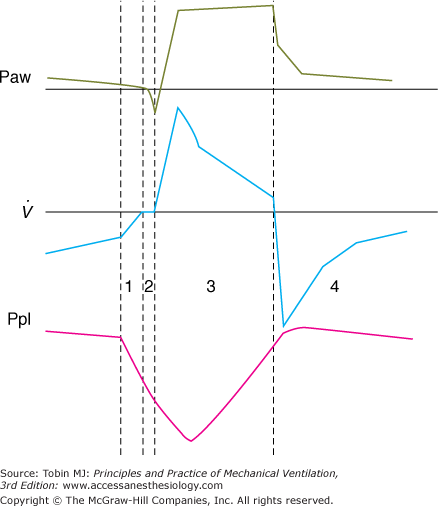
A pressure-supported breath with tracings of airway pressure (Paw), flow ( ), and pleural pressure (Ppl). Four phases of patient effort can be discerned. Phase 1 is still expiratory and corresponds to an effort performed against intrinsic positive end-expiratory pressure; it occurs before the triggering system of the ventilator can detect any signal that indicates the onset of patient inspiratory effort. Phase 2 is the time required to activate the triggering system of the ventilator (also called the initiation phase). Phase 3 is the insufflation phase during which the ventilator pressurizes the airway at the level set by the clinician. This phase is terminated by the cycling-off criterion. Patient inspiratory effort may terminate before the end of this phase. Phase 4 is the expiratory phase.
Three phases of PSV can be distinguished: (a) recognition of the beginning of inspiration, (b) pressurization, and (c) recognition of the end of inspiration. These phases constitute the working principles of PSV, and can vary from one ventilator to another (see Fig. 8-1). As discussed in the section Differences Among Mechanical Ventilators, these variations may induce differences in the effect of PSV for similar levels of pressurization.
Triggering of inspiration is initiated by patient effort and is detected by a pressure or flow sensor. Trigger sensitivity is adjustable. This mechanism requires an active effort by the patient, the intensity of which depends on the characteristics of the valve. The opening time delay varies between 50 and 250 milliseconds, depending on the ventilator.14–18 The most recent data indicate that most ventilators now respond in less than 100 milliseconds.19–22
Opening of the demand valve can be triggered by a fall in pressure or a difference in the flow signal between inspiratory and expiratory flows (referred to as flow-by). For the latter, a constant flow is delivered to the circuit during the expiratory phase; inspiratory effort is then detected as a small difference between inspiratory and expiratory flow. Flow-triggering avoids the need for a closed demand valve. Aslanian et al23 showed that the difference between pressure-triggered and flow-triggered systems has become quite small on modern ventilators. The triggering phase represents less than 10% of a patient’s overall effort to breathe. A flow-triggering system makes a statistically significant difference but of limited clinical importance.
Once inspiration has been initiated, the ventilator delivers a high inspiratory flow, which rapidly decreases throughout the rest of inspiration. A servo regulatory mechanism maintains the proper flow to reach the appropriate preset PSV level and keeps this pressure approximately constant until expiration occurs. Flow regulation varies among ventilators, thus determining the pressure waveform. Usually, the servo valve is continuously controlled during the breath, such that delivered pressure closely approximates target pressure set by the clinician. In general, the aperture of the proportional servo valve is progressively reduced as the monitored pressure gets closer to the target pressure. For this reason, the wave shape often constitutes a pressure ramp rather than a true square wave. The pressure level can be adjusted between 0 (spontaneous breathing through the ventilator circuit) and a maximum of 30 or 60 cm H2O (even more with some ventilators). In clinical settings, pressure levels above 30 cm H2O are rarely used.
Pressure increases according to a rate that is system-specific; formerly, it was nonadjustable. A high speed of pressurization produces a square pressure wave; low achievement of the preset PSV level attenuates this shape. Many ventilators now allow adjustment of the rate of pressurization. Its influence is discussed in the section Pressurization Rate and Inspiratory Flow.
During PSV, cycling to exhalation is primarily triggered by a decrease of inspiratory flow from its peak to a system-specific threshold value. This critical decrease of inspiratory flow is taken as indirect evidence that the inspiratory muscles have begun to relax. Expiration is triggered when either an absolute level of flow (between 2 and 6 L/min) or a fixed percentage of peak inspiratory flow (12% or 25%) is reached, depending on the ventilator model (Table 8-1). The threshold value for cycling, which can be viewed as sensitivity of the expiratory trigger, was formerly nonadjustable. Adjustment is now offered to clinicians on many ventilators.
| Inspiratory Trigger | Pressurization | Cycling-off Criterion | |||||
|---|---|---|---|---|---|---|---|
| Manufacturer | Flow | Pressure | Flow Cycle | Pressure Cycle | Time Cycle | ||
| PB 7200 | Puritan Bennett/ Covidien | 1 to 15 | 0.5 to 20 | 5 L/min | +1.5 cm H2O | 3 s | |
| PB 740 | Puritan Bennett/ Covidien | 1 to 20 | 10 L/min or 25% PF | +3 cm H2O | 3.5 s | ||
| PB 760 | Puritan Bennett/ Covidien | 1 to 20 | 5% to 100% | Adjust. 1% to 45% PF | +3 cm H2O | 3.5 s | |
| PB 840 | Puritan Bennett/ Covidien | 1 to 20 | 5% to 100% | Adjust. 1% to 80% PF | +1.5 cm H2O | 3 s | |
| Evita 2 | Drager | 25% PF | High pressure limit | ||||
| Evita 2 dura | Drager | 0.3 to 15 L/min | 0 to 2 s | 25% PF | High pressure limit | ||
| Evita 4 | Drager | 0.3 to 15 L/min | 0 to 2 s | 25% PF | High pressure limit | 4 s | |
| Evita XL | Drager | 0.3 to 15 L/min | 0 to 2 s | 5% to 70% PF | High pressure limit | ||
| Savina | Drager | 25% PF | High pressure limit | ||||
| Servo 900C | Maquet | 0 to 20 | 25% PF | +3 cm H2O | |||
| Servo 300 | Maquet | 0.6 to 2 | 0 to 20 | 5% PF | +20 cm H2O | ||
| Servo-i | Maquet | 0.6 to 2 | 0 to 20 | 0 to 0.4 s | Adjust. 1% to 80% PF | High pressure limit | |
| Servo-s | Maquet | 0.6 to 2 | 0 to 20 | 0 to 0.4 s | Adjust. 1% to 80% PF | High pressure limit | |
| Veolar | Hamilton | 25% PF | High pressure limit | 3 s | |||
| Galileo | Hamilton | 0.5 to 15 | 0.5 to 10 | 25 to 200 ms | Adjust. 10% to 40% PF | High pressure limit | 3 s |
| Raphael | Hamilton | ||||||
| Bird 8400 | Viasys Healthcare | 1 to 10 | 1 to 20 | 25% PF | High pressure limit | 3 s | |
| T-Bird | Viasys Healthcare | 1 to 20 | 5% to 30% PF (submenu) | High pressure limit | 3 s | ||
| Vela | Viasys Healthcare | 1 to 8 | Adjust. 5% to 30% PF | High pressure limit | 0.3 to 3 s | ||
| Avea | Viasys Healthcare | 0.1 to 20 | 0.1 to 20 | Adjust. 5% to 45% PF | High pressure limit | 0.15 to 5 s | |
| Bear 1000 | Viasys Healthcare | 25% PF | 5 s | ||||
| Bipap Vision | Respironics/Philips | Automatic (autotrack) | 0.05 to 0.4 s | Automatic (autotrak) | |||
| Esprit | Respironics/Philips | 0.5 to 20 | 0 to 20 | 0.1 to 0.9 s | Adjust. 10% to 45% PF | ||
| LTV1000 | Pulmonetics | 1 to 9 | Adjust. 10% to 40% PF | High pressure limit | |||
| Elisee | Saime | Adjust. 10% to 40% PF or automatic | |||||
| e500 | Newport | Adjust. 5% to 50% PF, variable | High pressure limit | ||||
| HT50 | Newport | 0 to –10 | High pressure limit | 0.1 to 3 s | |||
| Infrasonics star | Infrasonics | -0.5 to 20 | 4 L/min or 10% PF | 3.5 s | |||
| Inspiration | Event | 1 to 25 | -1 to 20 | Fast/medium/low | Adjust. 10% to 80% | ||
Detection of a small degree of pressure (1 to 3 cm H2O) above the fixed PSV level, consequent to sudden expiratory effort by the patient, can also be used (alone or combined with the flow criteria) to stop inspiratory assistance. Finally, a time limit for inspiration is usually included. This serves as a safety mechanism if a leak develops in the circuit and the two previous methods of terminating inspiration become inoperative. Complications have been reported in the absence of this time-limit mechanism, whereby constant insufflation (at the PSV level) creates a high level of continuous positive airway pressure.24
Because no mandatory breath is present with PSV, a safety feature is often available in case of apnea. This may be an automatic feature, or a minimal frequency, or minute ventilation to be set. The time delay for apnea may be adjustable. This safety feature is not available on all ventilators.
PSV can be used in conjunction with SIMV.25–28 Two approaches have been used: addition of a fixed level of PSV during spontaneous breathing to overcome endotracheal tube (ETT) or circuit resistance,29 or use of a variable level of PSV between the mandatory breaths. The second approach introduces considerable complexity into ventilator management of patients.
Differences among Mechanical Ventilators
During PSV, specific characteristics of the ventilator may interfere with patient respiratory activity. These differences may be determined by the manufacturer’s algorithm to deliver pressure, such as speed of pressurization and/or initial peak flow setting, ability to maintain a plateau pressure and quality of regulation, and termination criteria used to cycle from inspiration to expiration. Nonspecific features include characteristics of the demand valve and/or triggering mechanism, and flow-impeding properties of the expiratory circuits, including PEEP devices.22 These differences may also vary with the type of ventilator, whether it is designed only for delivery of noninvasive PSV or a full intensive care ventilator.20,21,30,31 The relative weight of each factor is difficult to determine and may vary from one patient to another. This consideration should, however, be kept in mind when interpreting the results of clinical studies of PSV using various ventilators. One study with old-generation ICU ventilators compared three of them and found major work differences,32 showing that different characteristics of PSV could have a major influence on its efficacy (Fig. 8-2). Fortunately, most recent ventilators have designed much better systems of regulation, providing more homogeneous delivery of PSV, but clinically relevant differences still exist.22
Figure 8-2
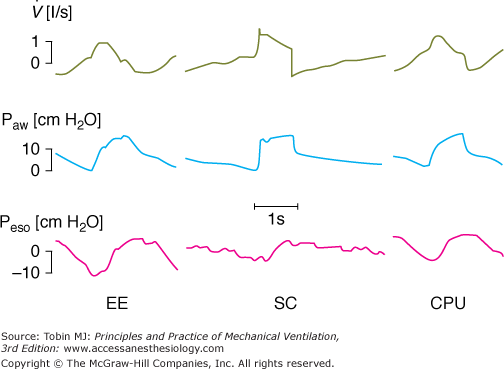
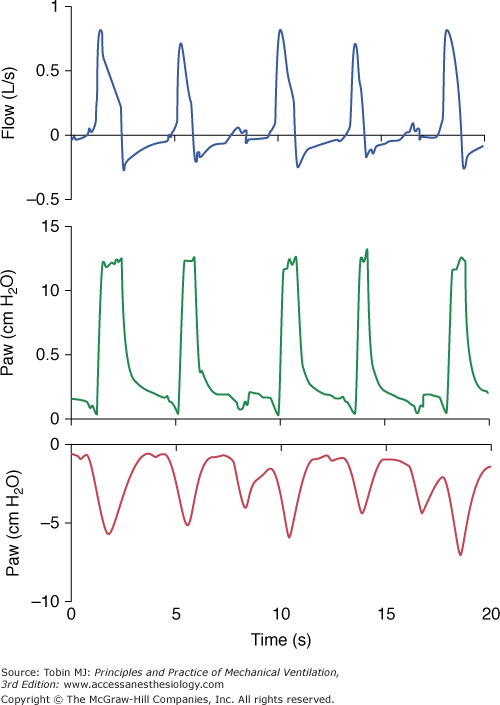
The influence of a ventilator and its specific algorithm on patient effort. Three ventilators were studied at 15 cm H2O of PSV. Flow, airway pressure (Paw) and esophageal pressure (Peso) are presented. Note the different airway and flow profiles, and the impact on esophageal pressure swing. Work of breathing was significantly less with SC. Although modern ventilators tend to homogenize the delivery of PSV, differences still exist and illustrate the effects of varying the pressure ramp. CPU, CPU1, Ohmeda, Maurepas, France; EE, Erica Engstrom, Bromma, Sweden; and SC, Servo 900 C, Siemens, Lund, Sweden. Reproduced from.28
As with other assisted modes, the triggering mechanism is a key determinant of the efficacy of PSV. A poorly functioning demand valve has two consequences: it imposes an effort to open the valve, and it prolongs the time before assistance is delivered. Assisted modes, like PSV, are primarily devoted to reducing or optimizing this effort. Demand valves function with an unalterable delay before delivering gas flow to the patient. For instance, if 200 milliseconds is required between the beginning of an inspiratory effort and the opening of the valve, nearly one-third of the duration of inspiratory effort in a tachypneic patient may take place without any gas entering the lungs. If auto (or intrinsic) PEEP is present, another 200 milliseconds may be wasted (while the respiratory muscles work against this positive alveolar pressure) before any inspiratory flow can start.33 In addition, if the speed of pressurization of PSV is low, another 200 milliseconds is required to reach the plateau pressure. Thus, assistance will be delivered to the patient 600 milliseconds after the beginning of inspiratory effort, which may correspond to the end of that patient’s inspiratory effort.34
Comparison of the triggering functions of various ventilators demonstrates that the most recent generation of ventilators, using pressure-sensitive mechanisms, flow-sensitive mechanisms, or both, usually require less effort and open faster than the older generation. This was extensively studied by Richard et al,19 and subsequently by Thille et al22 who compared different generations of ventilators, including the new turbine ventilators (Figs. 8-3, 8-4, 8-5). The ability of different ventilators to pressurize the airway during PSV was investigated. Different levels of simulated inspiratory demand were used. Pressurization was assessed through the net area of the inspiratory airway pressure-time tracing over the first 0.3 second, 0.5 second, and 1 second at different levels of PSV (Figs. 8-3 and 8-4). Triggering sensitivity was assessed independently by measuring the time delay and the pressure fall with different levels of inspiratory drive (Figs. 8-3 and 8-5). Ventilators released after 1993 achieved significantly better results than most previous generation ventilators regarding the pressure-time area at 0.3 seconds and triggering delay, indicating large improvements in terms of triggering and pressurization. Regarding PSV and trigger performances, this generation of ventilators outperformed most previous generation ventilators; this was also the case for some piston and turbine-based ventilators, including several of those specially designed for noninvasive ventilation (NIV). Six years later, trigger function, pressurization capacity and accuracy of pressure measurements during simulated PSV, and expiratory resistance were again evaluated in a similar bench study.22 In 2006, new-generation turbine-based ventilators performed as well as, or better than, the best compressed-gas ventilators. The newest ventilators did not perform significantly better than the 2000 ventilators, suggesting that a technological ceiling may have been reached.
Figure 8-3
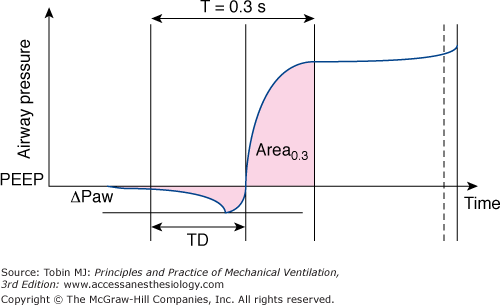
The method used to calculate the trigger characteristics and pressurization phase during pressure support ventilation based on the airway pressure-time curve. The total trigger phase is evaluated by the time delay (TD) between the onset of simulated effort and the time at which airway pressure becomes positive after experiencing a pressure fall (ΔPaw). The quality of pressurization is best quantified as the area measured at 0.3 second. (With kind permission from Springer Science and Business Media: Cox D, Tinloi SF, Farrimond JG. Investigation of the spontaneous modes of breathing of different ventilators. Intensive Care Med. 1988;14:532–537.)
Figure 8-4
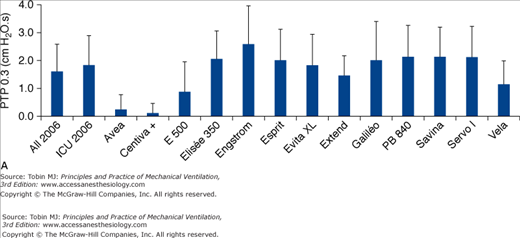
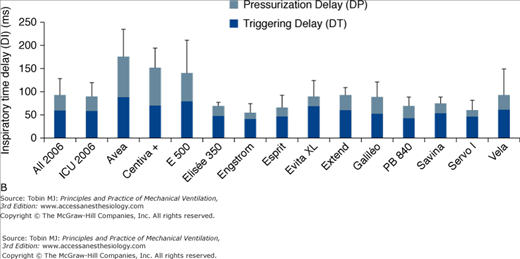
A. Inspiratory area, measured as the integral of the airway pressure-time trace over the first 0.3 second of inspiration (see legend of Fig. 8-3), for a PSV level of 15 cm H2O for the same simulated level of inspiratory demand. B. Inspiratory time delay in milliseconds measured during the same tests, separated into triggering and pressurization delay. The new-generation ICU ventilators proposed in 2006 were evaluated. These included Avea and Vela (Viasys Healthcare, Conshohocken, PA), E 500 (Newport Medical Instruments, Costa Mesa, CA), Elisee 350 (Resmed-Saime, North Ryde, Australia), Engstrom and Centiva (General Electric, Fairfield, CT), Esprit (Respironics, Murrysville, PA), Extend (Taema, Antony, France), Savina and Evita XL (Dräger, Lubeck, Germany), Galileo (Hamilton, Rhäzuns, Switzerland), PB 840 (TYCO, Carlsbad, CA), and Servo I (Maquet, Solna, Sweden). Of these thirteen ventilators, four were turbine-based (Elisée 350, Esprit, Savina, Vela) and nine were conventional servo-valve compressed-gas ventilators. Seven were viewed as ICU ventilators (Avea, Evita XL, Engstrom Extend, Galileo, PB 840, Servo I) and six were mid-level ICU ventilators (Centiva, E 500, Elisee 350, Esprit, Savina, and Vela). The mean values for all ventilators or only ICU ventilator is also presented. (With kind permission from Springer Science and Business Media: Thille AW, Lyazidi A, Richard JC, Galia F, Brochard L. A bench study of intensive-care-unit ventilators: new versus old and turbine-based versus compressed gas-based ventilators. Intensive Care Med. 2009;35:1368–1376.)
Figure 8-5
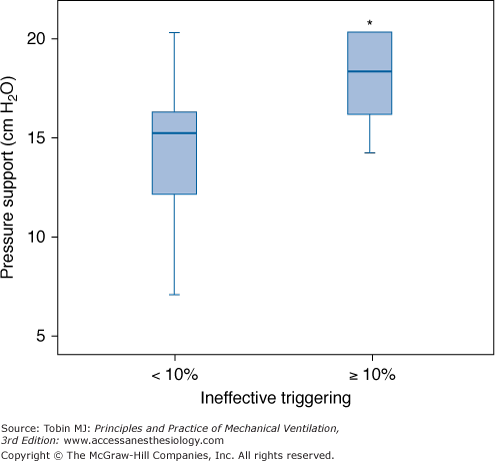
Relationship between the level of PSV and the frequency of ineffective triggering in a cohort series of sixty-two consecutive patients requiring mechanical ventilation for more than 24 hours. Box plots show median, interquartile range (25th to 75th percentiles), and outliers (5th to 95th percentiles) of PSV in patients with and without a high prevalence of ineffective triggering (>10%). PSV was higher in patients with a high incidence of ineffective triggering. *p < 0.05. (With kind permission from Springer Science and Business Media: Thille AW, Rodriguez P, Cabello B, Lellouche F, Brochard L. Patient-ventilator asynchrony during assisted mechanical ventilation. Intensive Care Med. 2006;32:1515–1522.)
NIV using PSV can be performed with either turbine ventilators, specially conceived to provide NIV, or conventional ICU ventilators originally designed for invasive ventilation. The rate of use of each of these is variable depending on the care setting, the etiology of respiratory failure, the specialist, and even the geographic region.35–37 Ventilators delivering PSV and PEEP, termed bilevel ventilation, and designed for home ventilation have been evaluated in stable, awake patients with chronic ventilatory failure.38 Despite some variability in the delivery of pressure, no difference was found in terms of comfort or improvement in inspiratory muscle unloading. These differences, however, might have greater impact in patients with acute respiratory failure.
The presence of air leaks around the mask is a major problem related to use of NIV. When ICU ventilators are not capable of compensating for leakage, leaks generate autotriggering, prolonged cycling, ineffective efforts, and a poor pressurization capacity of the ventilator. For these reasons, manufacturers have developed specific algorithms, called NIV modes, which aim to minimize the negative impact of leaks on ICU ventilator performance. Dedicated NIV ventilators are designed to function with leaks and have developed sophisticated algorithms that evaluate online the magnitude of a leak and readjust the triggering thresholds. Several bench studies show variable performance in the ability to ameliorate these key ventilator functions with the activation of the NIV mode,39,40 and an overall better performance for dedicated NIV ventilators. The clinical effect of “NIV modes” on patient–ventilator interactions has also been evaluated in two recent short-term clinical studies. Vignaux et al compared four ICU ventilators, with and without the activation of the NIV mode, showing a reduction in patient–ventilator asynchronies with the NIV mode.41 A second study, employing the same schema but also testing a specific NIV ventilator, showed a significant reduction in the rate of these events with the latter.42 Although clinical studies are needed to clarify this issue, it is advisable to use NIV modes on ICU ventilators or dedicated ventilators.
Main Physiologic Effects of Pressure-Support Ventilation
During PSV, the patient maintains control over respiratory rate, and has partial control of TI and tidal volume (VT). As such, PSV seems to allow the patient to breathe in a “physiologic” way. This is only partially true, because there is a complex interaction between ventilator support and patient control of breathing. This interaction depends on the pressure level and PSV characteristics. For instance, a change in the criterion for cycling from inspiration to expiration will result in a different TI, different VT, and may result in more (or less) dynamic hyperinflation.
The addition of PSV modifies the spontaneous breathing pattern.43–48 Most patients develop an increase in VT and decrease in respiratory rate with increasing levels of PSV. The breathing pattern adapts rapidly under PSV when the respiratory muscles face a new workload.49 Adjustment of the PSV level can be guided by noting the breathing pattern response: changes in breathing pattern in response to loading conditions usually occur within 1 to 2 minutes.49,50 Importantly, evaluation of a patient during a low level of PSV is different from evaluation of during a T-tube trial, for instance, even if the clinical outcome of the two approaches may be similar. Two studies show that the use of a low level of PSV during a “spontaneous breathing trial” modifies the thresholds that may be used to predict weaning success or weaning failure.51,52
Excessive levels of support, however, can generate hyperinflation, respiratory alkalosis, respiratory depression with apnea, or appearance of missing efforts.53 A high level of support-induced hyperinflation may indeed result in an inability to trigger the ventilator (so-called ineffective triggering), with a substantial difference in the ventilator’s displayed respiratory rate and the patient’s true respiratory rate.54 The frequent occurrence of these findings (discussed below in Degree of patient-ventilator synchrony or asynchrony) illustrates the fact that the insufflation during PSV is often terminated after cessation of the patient’s inspiratory time, especially in case of airway obstruction.55 The higher the pressure level, the longer is this prolongation.56 Thus, to some extent, PSV artificially forces the patient to decrease respiratory rate as a way of trying to maintain a sufficient expiratory time.54 As the PSV level is increased, an imbalance almost inevitably occurs between prolongation of the insufflation time and shortening of expiratory time, promoting severe asynchrony.
In patients with acute lung injury, factors other than respiratory muscle load influence respiratory drive. Pesenti et al reported that variation in arterial oxygen (O2) saturation between 85% to 90% and 100%, obtained by modifying fractional inspired oxygen concentration (FIO2), had a significant effect on respiratory drive in patients with acute lung injury receiving PSV.57 Volta et al reported similar findings: modulation of produced variation in dyspnea, occlusion pressure, and respiratory frequency.58
The influence of PSV on the duty cycle (fractional inspiratory time, TI/TTOT) is variable and influenced by the setting of the pressure ramp on the ventilator.59 A decreasing duty cycle with increasing PSV levels was observed in several studies.44–46
The influence of PSV on minute ventilation is variable, producing an increase or no change.43–47 An increase in minute ventilation is often observed when PSV is compared with unassisted breathing through the ventilator circuit. More frequently, an increase in PSV fails to substantially modify minute ventilation whereas it modifies alveolar ventilation. Consequently, the breathing pattern may be markedly modified without significant change in minute ventilation.43–48 Thus, monitoring minute ventilation is of little help when titrating the level of PSV.
The primary goal of PSV is to support patient effort while allowing a satisfactory gas exchange. PSV is not primarily aimed at improving oxygenation. The effects of PSV on gas exchange are primarily explained by increased alveolar ventilation resulting from changes in breathing pattern. Indeed, despite lack of change in minute ventilation, an increase in VT produces a decrease in the ratio of dead space to tidal volume (VD/VT). Thus, alveolar ventilation is often increased. Other factors may influence arterial blood gases, such as changes in O2 consumption, modification of total dead space, and altered distribution of ventilation. During the weaning of patients with hypercapnic respiratory failure, addition of PSV produced a correction of the partial pressure of arterial carbon dioxide (PaCO2) and respiratory acidosis compared to spontaneous breathing.43 In normal, nonintubated subjects, PSV 10 cm H2O produces significant decreases PaCO2 in below normal levels.53 PSV can thus correct hypoventilation but also induce hyperventilation that is not counteracted by respiratory motor output.60 Consequently, although PSV permits correction of hypercapnia resulting from rapid shallow breathing or helps patients with chronic CO2 retention to choose their own target PaCO2, the level of PSV requires fine adjustment as respiratory alkalosis can easily occur.
Although breathing pattern, especially respiratory frequency, is in part controlled by the patient, an interaction exists between the level of PSV and alveolar ventilation, which is not fully controlled by respiratory center command. MacIntyre and Leatherman showed in a lung model that a biphasic effect can occur with increasing levels of PSV.61 Above a certain limit, passive (hyper-) inflation will result with high levels of PSV. That excessive assistance with PSV may induce respiratory alkalosis not controlled by the patient’s respiratory centers and has important consequences. Parthasarathy and Tobin found that during sleep PSV was associated with numerous episodes of apneas, desaturation, and microarousals leading to sleep fragmentation.62 This could be prevented by adding dead space to the circuit. Not tested in this study was the likelihood that reductions in the level of PSV might prevent this problem.
The distribution of ventilation and perfusion during PSV has been assessed in a few studies.63–68 Valentine et al63 compared SIMV, PSV, and airway pressure release ventilation in nine patients a few hours following cardiac surgery. The major characteristics of ventilation–perfusion ( ) distributions were similar with all modes.63 Dead space was lower during airway pressure release ventilation than during either SIMV or PSV. Gas exchange was assessed with the six-inert-gas technique in a study comparing controlled mechanical ventilation, unassisted spontaneous breathing, and PSV 10 cm H2O.64 Using isotopic scanning, they evaluated regional distribution of
  ratios in eight patients with chronic obstructive pulmonary disease (COPD). Ventilator discontinuation was associated with rapid shallow breathing and an increase in perfusion to low
  regions. Isotopic scans revealed a horizontal craniocaudal difference of
  with all modes, and the lowest
  ratios were found at the bases. Abnormalities in
  distribution observed during spontaneous breathing were also present during 10 cm H2O PSV, but to a smaller extent.
Ferrer et al assessed whether PSV could improve  imbalance during the transition between positive-pressure ventilation and spontaneous breathing in seven intubated patients with COPD during weaning.66 PSV avoided
  worsening during this transition. Hemodynamics, blood gases, and
  distributions were equivalent during PSV and assist-control ventilation (ACV) when the two modes provided similar levels of assistance. Diaz et al studied the reasons for improvement in partial pressure of oxygen (PO2) and partial pressure of carbon dioxide (PCO2) in ten patients with acute hypercapnic exacerbations of COPD who were switched from spontaneous breathing to PSV during NIV.65 Improvement in blood gases was primarily mediated by a higher alveolar ventilation, and not improvement in
  relationships. Although O2 uptake tended to decrease, the respiratory exchange ratio increased, explaining a slight increase in arterial-to-alveolar O2 difference secondary to increased clearance of body stores of CO2 during NIV. These results suggested that attaining an efficient breathing pattern rather than high inspiratory pressures should be the primary goal for improving arterial blood gases during NIV with PSV in this type of patient. Lastly, a recent study assessed gas exchange and changes in lung volume through the use of lung diffusion capacity for carbon monoxide (DLCO) in sixteen patients without COPD.69 An increase in PSV of 5 cm H2O neither affected lung volume nor increased the volume of the lung participating in gas exchange, but was associated with a slight but significant deterioration in DLCO. Thus, a target VT closer to 6 mL/kg than to 8 mL/kg of predicted body weight during PSV was associated with better gas exchange.
The effect of PSV on oxygenation varies and depends on many factors, such as the induced changes in alveolar ventilation, O2 consumption, dead space, and mean airway pressure.43–46 Most investigators have not found significant changes in arterial oxygenation when PSV was compared with other modalities (primarily spontaneous breathing or SIMV) delivered at the same FIO2. Compared with continuous positive pressure ventilation in surgical ICU patients, Zeravik et al suggested that only patients with a low level of extravascular lung water had improved oxygenation with PSV among patients with moderate acute respiratory failure.70
A major goal of PSV is to assist respiratory muscle activity in a way that improves the efficacy of patient effort and decreases workload. Many of the initial studies on PSV have focused on this point and have measured work of breathing or indexes of patient effort during PSV.11,13,43,45,46,71,72
MacIntyre was one of the first to study the effects of various levels of PSV in patients.11 The level of PSV was positively correlated with VT and negatively correlated with respiratory rate. He suggested that PSV alters the characteristics of work of breathing: the change in the pressure-to-volume ratio of the work of each breath decreased progressively with increasing levels of PSV. In intubated patients recovering from acute respiratory failure, Brochard et al compared breathing characteristics during 10 cm H2O PSV, spontaneous unassisted breathing through a ventilator, and a continuous flow system without a demand valve.13 PSV produced significant increases in VT and partial pressure of arterial oxygen (PaO2), and a decrease in respiratory rate, transdiaphragmatic pressure (Pdi) swings, pressure-time index, and electromyographic activity of the diaphragm. Subsequently, Brochard et al compared several levels of PSV in eight patients who were experiencing weaning difficulties, four of whom had COPD.43 During unassisted breathing, patients breathed with a small VT and a high rate, a pattern associated with unsuccessful weaning, hypoxemia, and hypercapnia. All patients exhibited intense activity of their sternocleidomastoid muscles and the analysis of the diaphragmatic electromyographic recordings suggested impending high-frequency fatigue during PSV0. All these signs or symptoms disappeared at 10 cm H2O or 20 cm H2O of PSV, while activity of the sternocleidomastoid muscles was minimized or no longer present. Work of breathing returned to normal, whereas the respiratory rate remained around 30 breaths/min. These findings were later confirmed by another study also analyzing an index of high-frequency fatigue.73
The values of respiratory rate described above emphasize that trying to “normalize” respiratory rate much below the point where a patient is no longer in respiratory distress, such as targeting a threshold of 20 breaths/min or even lower values, may not be desirable; we will see later that it may favor asynchrony. A limit of 30 breaths/min was also found by Jubran et al to be predictive of a inspiratory pressure-time product of less than 125 cm H2O.sec/min, representing a desirable level of inspiratory effort.74 This has important clinical implications for the bedside titration of PSV.
PSV acts with great efficiency in decreasing work of breathing. This is more or less proportional to the level of PSV and is accompanied by changes in breathing pattern measurable at the bedside, together with changes in respiratory muscle recruitment. There is, however, an individual limit of pressure above which work of breathing is not decreased and the patient becomes to be overassisted.44
Different indexes have been used to assess respiratory muscle activity. Beck et al compared the crural diaphragmatic electrical activity (Edi) with Pdi during varying levels of PSV in intubated patients.56 Changes in PSV did not alter neuromechanical coupling of the diaphragm: Edi and Pdi decreased proportionally with the addition of PSV. In contrast, Fauroux et al found that diaphragmatic pressure-time product, often used to quantify loading and unloading of the diaphragm, did not exhibit a linear relationship with the diaphragmatic electromyographic activity during PSV and that flow measurements may be necessary when assessing diaphragmatic unloading during PSV.75
PSV has been used to predict patient tolerance of unassisted breathing and extubation.76 The idea is based on selecting a level of PSV just sufficient to overcome the circuit resistance. Thus, spontaneous muscular activity should be similar to what a patient would perform in the absence of an ETT or circuit.77 The pressure needed to obtain a “adequate” breathing pattern during a spontaneous breathing test can provide insight into a patient’s ability to tolerate extubation.
It has long been argued that breathing through an ETT and demand valve increases respiratory muscle work78 and that PSV can compensate for this increased demand.77,79,80 Part of the confusion, however, comes from the fact that the resistance posed by an ETT is probably close to upper-airway resistance after extubation. Several clinical studies have compared work of breathing before and immediately after extubation.80–82 These studies demonstrated that the work of breathing was similar or even often higher after extubation than before extubation (while breathing through an ETT). This indicates that there is no rationale for compensating for the ETT in itself. What needs to be compensated for, however, is the ventilator circuit through which the patient is breathing, including the triggering system.
In intubated subjects breathing with various levels of PSV who were disconnected from the ventilator and finally extubated,77 the level of PSV that compensated for extra work of breathing through the ETT and ventilator circuit was calculated post hoc. In patients with underlying lung disease, the PSV level that compensated for the additional work ranged from 8 to 14 cm H2O, while it averaged 5 cm H2O in patients free of lung disease. Based on various studies,83,84 it has been argued that a PSV level of 5 to 10 cm H2O be provided when a patient is breathing through a demand valve.
Despite wide individual variation among patients regarding the best pressure to apply in physiologic studies, a simplified approach, based on the same principle, has been applied in several large clinical trials. These studies showed that a low level of PSV (7 to 10 cm H2O) is overall as efficient as a T-piece trial in testing whether a patient can be separated from the ventilator and eventually extubated, despite the lack of individual titration of PSV.8,85–87
Some studies suggested that this low PSV test may be easier to tolerate than a T-piece trial,88 and measurements of muscular effort support this impression in cardiac patients.89 Therefore, a T-piece trial seems to constitute a more challenging test than the low PSV test, at least in cardiac patients.
Instrumental dead space is usually constituted by the flex-tube connector, the Y piece, and the humidification system. Heat and moisture exchangers and heated humidifiers constitute a resistive load,90 but heat and moisture exchangers also add instrumental dead space, because they are positioned between the Y piece and the ETT. The mechanical characteristics of heat and moisture exchangers can substantially modify breathing pattern, effort to breathe, and gas exchange during PSV. These effects were assessed in several studies during PSV and invasive ventilation,90–95 and also studies during NIV,96,97 with consistent results. Adding dead space with the heat and moisture exchanger reproduced well-described effects of addition of CO2 on breathing pattern. In intubated patients during PSV, for instance, Pelosi et al reported that work of breathing increased from 8.8 ± 9.4 J/min with a heated humidifier to 14.5 ± 10.3 J/min with an heat and moisture exchanger.92 These investigators suggested that increasing the level of PSV by 5 cm H2O may be necessary to compensate for the increased work of breathing caused by heat and moisture exchangers dead space. Recently, it was shown, however, that small heat and moisture exchangers have a much lower dead space, and that their impact is therefore limited or negligible.98
Sleep
Mechanical ventilation in the ICU is associated with an abnormal sleep pattern characterized by abnormal circadian distribution of sleep and numerous arousals, similar to the pattern found in sleep apnea patients.99,100 The exact influence of mechanical ventilation on sleep fragmentation in ICU patients remains poorly understood, but the ventilator mode and its settings, as well as patient–ventilator interactions, can influence the degree of fragmentation and the quality of sleep.62,99,101–103
The effects of the ventilator mode and settings were investigated in ICU patients by Parthasarathy and Tobin.62 Sleep fragmentation was increased with the use of PSV as compared with ACV, mostly because of central apneas caused by the level of PSV. The main mechanism of apnea was a decrease in PCO2, which could be avoided by adding an external dead space. This illustrated an undesirable effect of PSV, resulting from hyperventilation. During ACV, by contrast, the patient can trigger some or all breaths, and a minimal respiratory rate and the VT are preset, and this backup setting protects against apnea. Conceivably, however, a similar effect could have been achieved by selecting lower levels of PSV. This important study thus raised relevant clinical questions for the selection of ventilator settings.
The hypothesis that the possible deleterious effect—hyperventilation—could be avoided by a more appropriate level of PSV was confirmed in subsequent studies, both in home-ventilated patients and in ICU patients. A study of outpatients with neuromuscular disease compared two settings for NIV with PSV, one based on clinical parameters and the other based on physiologic requirements as estimated by an assessment of the patient’s respiratory effort and mechanics.103 The physiologic setting was associated with improvements in sleep quantity and quality, as well as with a lower level of PSV. An association was found between reductions of ineffective efforts (a marker of patient–ventilator asynchrony, mainly related to hyperinflation) and a higher proportion of rapid eye movement (REM) sleep, a sleep period with extreme physiologic importance. The smaller number of ineffective efforts with the physiologic settings were ascribed to the lower intrinsic PEEP, possibly related to the lower VT. The apnea index was also lower at the physiologic setting.
The effects of three ventilatory modes on sleep were compared in nonsedated ICU patients.102 The three modes were ACV, clinically adjusted PSV, and automatically adjusted PSV. With automatically adjusted PSV, the pressure level is adjusted in real-time based on VT, respiratory rate, and end-tidal CO2, as described later in this chapter (Closed loop delivery).104 The goal of automatically adjusted PSV is to adjust the level of PSV to the patient’s ventilatory demand so as to avoid underassistance or overassistance. Sleep was severely altered in the fifteen patients, who exhibited reductions in REM sleep and marked sleep fragmentation. No differences, however, were found in sleep architecture, sleep efficiency, or sleep fragmentation between the three ventilator modes. The absence of significant differences may reflect an adequate adjustment of ventilator settings, as minute ventilation was similar with the three modes. In this study,102 central apneas and ineffective efforts were relatively uncommon and were similar with the three modes. These results suggest that the mode may be less important than adjustment of the settings of each mode.
Newer modes may provide a more continuous and physiologic assistance. The effects of two assist-ventilation modes on sleep quality have been compared.101 Patients received proportional-assist ventilation (PAV) during one night and PSV during a second night. PAV involves applying a level of pressure that is proportional to the patient’s inspiratory effort; therefore, the level of pressure is variable. The patient triggers all the breaths and VT changes with every breath, reflecting the natural breath-to-breath variability. PSV, in contrast, applies the same level of pressure independently of the magnitude of a patient’s inspiratory effort. The working hypothesis was that PAV would improve patient–ventilator interactions and lessen asynchrony, and therefore reduce sleep fragmentation. The ventilator was set to achieve the same reduction in inspiratory effort. The number of patient–ventilator asynchronies was significantly smaller with PAV than with PSV. In addition, PAV was associated with a lower fragmentation index and with higher percentages of slow-wave sleep and REM sleep. VT and minute ventilation were lower with PAV, suggesting that this mode ensured better matching of the assistance to the patient’s requirements than did PSV, thereby decreasing the number of asynchronies linked to overassistance.
Degree of Patient–Ventilator Synchrony or Asynchrony during Pressure-Support Ventilation
The fundamental principle of assisted ventilation is to deliver assistance on a breath-by-breath basis in synchrony with patient effort. As discussed, some patient–ventilator asynchrony often exists with most current assisted modes, which can be aggravated by inappropriate settings, chiefly excessive support. Synchrony has been the subject of several investigations, often not specific to PSV.28,105–109 Patient–ventilator asynchrony has been described during invasive ventilation28,109–112 and NIV113 (Figs. 8-6, 8-7, 8-8, 8-9, 8-10, 8-11, 8-12, 8-13, 8-14).
Figure 8-6
Ineffective efforts. The third and sixth inspiratory efforts by the patient fail to trigger the ventilator. The efforts by the patient (visible on the esophageal pressure tracing [Pes]) are not accompanied by ventilator insufflations. A small and transient increase in flow during expiration and a decrease in airway pressure are visible at the time of the failure-to-trigger events.
Figure 8-7
Autotriggering. This form of asynchrony can occur when the inspiratory trigger is set too sensitive or in the presence of end-expiratory leaks. As on this tracing, a “short cycle” is a frequent result of an autotriggered cycle. The “autotriggered cycle” is accompanied by the absence of an initial airway pressure decay.
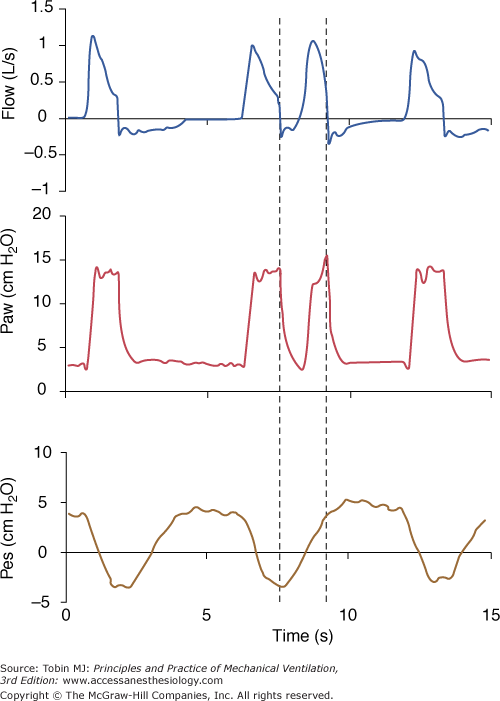
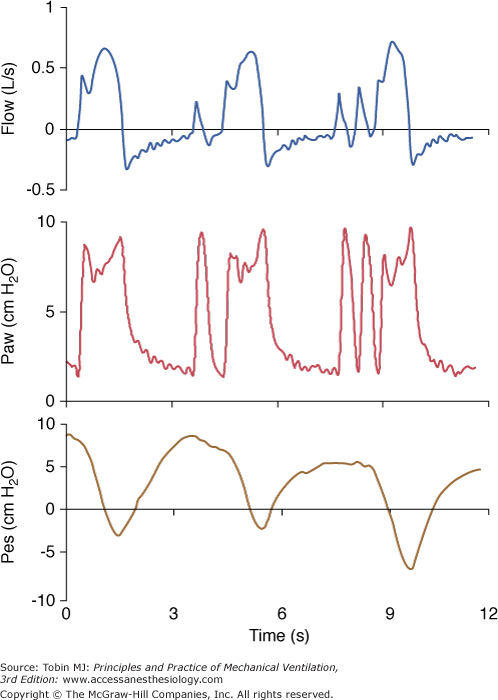
Figure 8-10
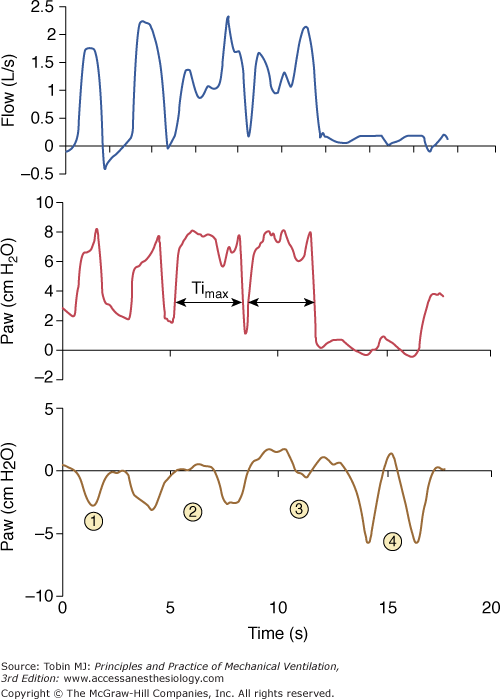
Prolonged inspiration during noninvasive ventilation. This form of asynchrony during PSV results from a failure to recognize the flow cycling-off criterion. With an end-inspiratory leak, as in this example, the ventilator increases and/or sustains flow to maintain the set airway pressure (here above 2 L/s). This prevents recognition of the decelerating flow threshold and cycling to expiration. Insufflation is stopped only when maximum inspiratory time (Timax) is reached. Ineffective triggering secondary to hyperinflation may follow the prolonged inspiration, as in this example.
Figure 8-11
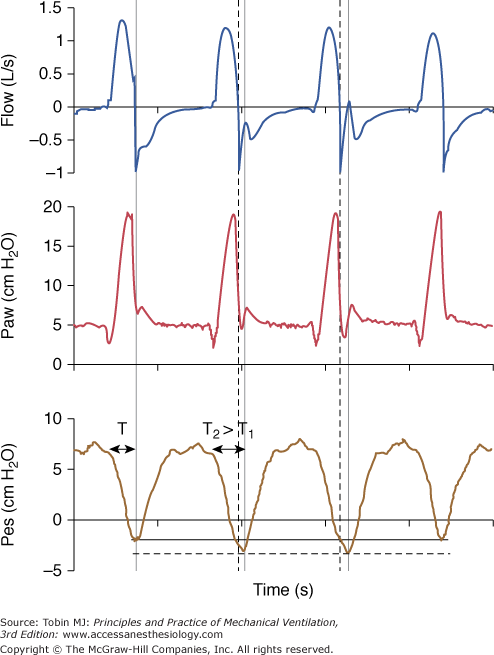
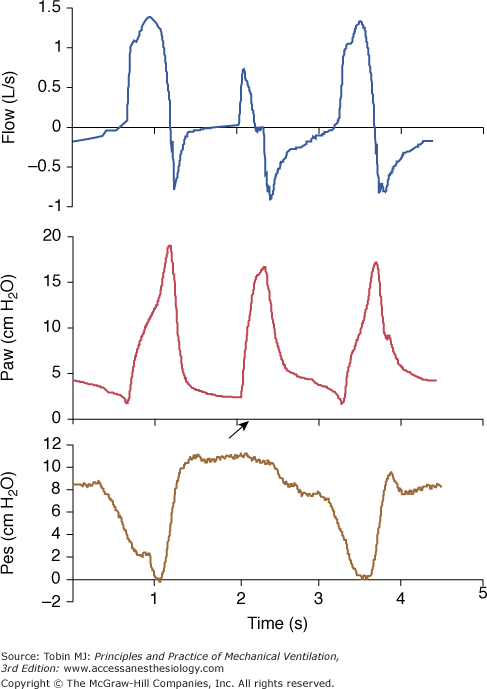
Early cycling-off. The ventilator ends insufflation (thick vertical dotted line) before the patient’s inspiratory effort ceases (second vertical line). The airway pressure tracing then drops transiently below the baseline end-expiratory pressure level because patient effort is still substantial after ventilator insufflation has ceased. The two cycles with this form of asynchrony are associated with increased effort (dotted horizontal line) and prolonged TI. The duration of TI on the second cycle (T2) is longer than TI on the first cycle (T1) as reflected with the greater distance between the arrowheads. A large TI favors this form of asynchrony.
Figure 8-12

Related posts:


Stay updated, free articles. Join our Telegram channel

Full access? Get Clinical Tree


