Pressure-Controlled and Inverse-Ratio Ventilation: Introduction
The use of pressure-controlled ventilation (PCV) increased substantially after 1995, when intensivists became increasingly aware of ventilator-induced lung injury (VILI) and the risks of high inspiratory pressures. Familiarity with the concept of permissive hypercapnia contributed to this change, helping physicians to overcome the old and stringent mindset on arterial blood gases.1–4 Tidal volume or minute ventilation requirements were increasingly regarded as secondary goals during mechanical ventilation and the apparent security provided by PCV, keeping airway pressures under strict limits, gained broader acceptance. Recent surveys in intensive care units demonstrate that PCV is now used in up to 25% of ventilated patients, usually in the most severe cases5,6 (including pediatric patients7). Studies, describing the implications of PCV on the cardiovascular system, work of breathing, regional mechanics, risks of VILI, and recruitment maneuvers are now available. These studies increase physician comfort in moving away from volume-controlled ventilation.
In contrast to the increasing acceptance of PCV, the use of inverse-ratio ventilation (IRV)—that is, the prolongation of inspiratory time to the point of inverting the conventional inspiratory-to-expiratory (I:E) ratio—is now very rare. This decline was caused by recent progress in our understanding on the pathophysiology of lung collapse, and demonstration of unnecessary hemodynamic compromise. The original benefits in terms of oxygenation ascribed to IRV,8–14 and the apparent reduction of peak inspiratory alveolar pressures11,12 are now supplanted by more consistent effects of recruiting maneuvers followed by optimization of positive end-expiratory pressure (PEEP),15–20 especially during controlled mechanical ventilation. It is only in the more specific context of airway pressure release ventilation (APRV) that the use of IRV has still survived, although surrounded by great skepticism and controversy.21,22
In this chapter, we do not revitalize IRV. We believe there are always safer, more predictable, and more efficient ventilatory solutions to be implemented at the bedside. IRV was extensively discussed in the second edition of this book. At the end of the present chapter, we present a few aspects of IRV that still offer great insights about the pathophysiology of acute respiratory failure.
Types of Controlled Ventilation and Selection of the “Controlled” Parameter
Ventilators regulate the pressure profile applied to the airways or the pattern of flow delivery. Somewhat imprecisely, flow-controlled ventilation has been designated “volume-controlled” ventilation (VCV). We avoid this convention because the criterion by which the ventilator ceases to pressurize the airway (initiates deflation) may be a specified value of delivered volume, pressure, elapsed time, or flow. The variable, however, actively controlled by the ventilator during “volume-controlled” breaths is in reality inspiratory flow. Therefore, the modes of ventilation currently used in medical practice should be classified as pressure-controlled or flow-controlled and as time-cycled, volume-cycled, flow-cycled, or pressure-cycled. Pressure-support ventilation (PSV) is an example of a pressure-controlled, flow-cycled mode, whereas PCV is an example of pressure-controlled, time-cycled mode.
In flow-controlled modes, the waveform theoretically can be of any desired contour; in practice, however, the flow waveforms usually are rectilinear (square), linearly decelerating, and sinusoidal. Setting tidal volume as the “off switch” criterion (volume-cycled) means that the pressure applied to the airway opening can rise to any value required by impedance to inflation that does not exceed the pressure-limit alarm. For instance, very high absolute airway pressures can develop during acute airway obstruction, acute lung edema or expulsive efforts or bouts of coughing, without consequences to delivered tidal-volume (except if the alarm is activated).
Although once used extensively, pressure-cycled ventilation is now considered obsolete for continuous support, and its application in intermittent positive-pressure breathing has been restricted greatly as a backup cycling-off criterion during flow-controlled, volume-cycled ventilation (when airway pressures reach a preset alarm threshold), or as a backup for flow-cycling during pressure support ventilation.
To improve safety or decrease the need for repeated adjustments at the bedside, flow-controlled and pressure-controlled algorithms have been combined recently to form new modes (dual modes, such as “volume-assured pressure support” and “pressure-regulated volume control”), incorporating the desirable characteristics of each category.23,24
The equation of motion of the respiratory system confines the clinician to setting independently the inspiratory flow and tidal volume or just the applied pressure profile. Flow and pressure cannot be selected independently at the same time because their relationship is intrinsically defined by the mechanical properties of the respiratory system. Because modern ventilators can provide online feedback information about output variables (airway pressures during flow-controlled ventilation or flow and tidal volume during pressure-controlled ventilation), either flow-controlled, volume-cycled ventilation or pressure-controlled, time-cycled ventilation (PCV) can be used interchangeably during specific conditions. For instance, instead of using the original pressure-control algorithms during IRV, some investigators proposed the equivalent use of IRV through flow-controlled, volume-cycled breaths,13 although doing so requires careful monitoring and frequent readjustments. Depending on particular combinations of compliance and resistance in the respiratory system, the pressure profile generated in the airways can be similar in both modes.
The major differences between flow-controlled and pressure-controlled breaths appear during prolonged use, after unpredictable changes in respiratory system characteristics. By using the traditional flow-controlled, volume-cycled mode, minute ventilation is guaranteed safely over prolonged periods of time, although airway pressures may rise significantly when respiratory system impedance increases. Conversely, during prolonged use of pressure-controlled, time-cycled ventilation, airway pressure limits are guaranteed, although minute ventilation is at risk whenever lung impedance changes.
Independent of selection of the controlled parameter, inspiration can be triggered by elapsed time or by small perturbations in pressure and flow in the airways (usually indicative of patient effort). Elapsed time defines a totally controlled breath, whereas small perturbations in pressure and flow define an assisted (patient-triggered) breath. In recent years, modern ventilators have incorporated algorithms providing pressure-controlled breaths triggered by either elapsed expiratory time, characterizing traditional PCV, or patient effort (assisted pressure-controlled ventilation), analogous to the traditional flow-controlled assist-control ventilation.
During assisted PCV, some important and relevant differences between VCV and PCV may appear. For instance, in the presence of a sustained inspiratory effort, extending from the beginning until end-inspiration, the pressure-controller will respond with an increased delivery of flow and tidal volume so as to keep airway pressures close to target. The result is an increased transpulmonary effective pressure (which is the sum of the positive airway pressure generated by the ventilator plus the modulus of the negative perturbation in pleural pressure driven by inspiratory muscles). In contrast, the flow-controller keeps inspiratory flow close to the target, while peak airway pressures decreases in proportion to the negative perturbation in pleural pressures. The result is a near constant transpulmonary effective pressure (Fig. 9-1, which shows that the modulus of positive airway pressure from the ventilator decreases in direct proportion to the modulus of the negative perturbation in pleural pressures; thus, the sum of the two is almost constant). This is why some investigators believe that VCV is safer during acute lung injury in the presence of strong patient effort and a persisting need for lung protection.25,26 The drawback of this “forced” maintenance of transpulmonary pressures by VCV, however, is the increased workload to inspiratory muscles and the promotion of a regimen of more negative pleural pressures, which, when excessive, may promote lung edema.27
Figure 9-1
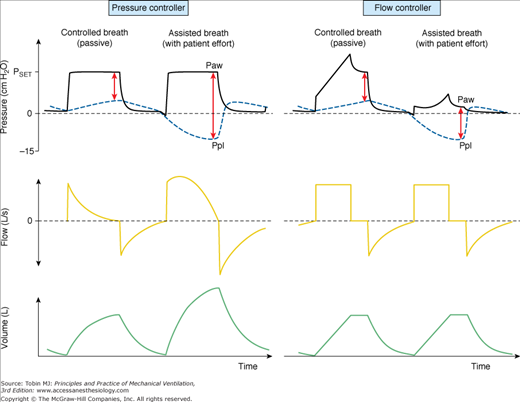
Airway opening pressure (Paw), pleural pressure (Ppl—blue dashed lines), flow and volume tracings during pressure-controlled ventilation (PCV, left panel of curves) and during flow-controlled ventilation (VCV, right panel of curves). In this simulation, pleural pressures are +1 cm H2O at relaxed end expiration, which corresponds to the midpleural pressure in a supine patient under anesthesia. In the second cycle of each panel, a patient effort is simulated (muscle pressure = –15 cm H2O). Red arrows at end-inspiration represent the total amplitude of effective transpulmonary pressure at end-inspiration. Note that transpulmonary pressures may increase during assisted PCV, in conjunction with increases in inspiratory flow and tidal volume (second breath in the left panel). In contrast, the assisted-VCV breath (second breath in the right panel) is associated with a drop in airway pressures, and with sustained inspiratory flow and tidal volume. The result is a near-constant transpulmonary pressure at end-inspiration. Because of safety concerns, some modern ventilators do not operate as pure flow controllers during VCV if airway pressure drops to below baseline pressure (PEEP); they may provide an extra demand flow to compensate excessive drops in Paw. In this case, the effective transpulmonary pressure might also increase during VCV, although to a lesser degree.
Specific Characteristics of Pressure-Controlled Ventilation
Many recently introduced ventilator modes can be considered as variants of pressure-controlled or pressure-preset ventilation. This includes traditional PCV,8,27 PSV,28,29 biphasic continuous positive airway pressure, and variants of APRV.30,31 In some modes, spontaneous respiratory efforts continue. In others, none occur. These modes vary both in their intended objectives and in their criteria for initiating and terminating the machine’s inspiratory cycle. Yet all can be viewed as modes in which the machine applies approximately square waves of pressure to the airway opening. In concept, any pressure profile can be regulated. In current practice, however, most pressure-controlled modes build pressure rapidly, toward a preset value, attempting to maintain pressure nearly constant throughout the remainder of the higher-pressure phase. During exhalation, pressure is released abruptly, allowing passive deflation to occur unimpeded or against a set PEEP level. By fixing the level of applied pressure during inspiration, the physician imposes an upper limit to the machine’s energy transferred to lung tissue.
The specifics of the new pressure-controlled modes are discussed in other chapters. The physical principles governing pressure-controlled, time-cycled ventilation—which serves as the prototype for this group—and its major “outcome” variables, such as tidal volume, minute ventilation, and intrinsic PEEP, are addressed here. Some discussion of the concepts of mean airway pressure ( ) and mean alveolar pressure (
 ) also are presented because these concepts are essential tools for understanding the physiologic implications of all pressure-controlled modes.
Apart from the external PEEP, the clinician sets only three parameters during PCV: the applied inspiratory pressure, backup or mandatory frequency, and fractional inspiratory time (duty cycle, TI/TTOT). The most salient feature of PCV is that maximal airway and alveolar pressures are restricted by the cap of preset pressure, whereas tidal volume, flow, minute volume, and alveolar ventilation depend on the impedance of the respiratory system in conjunction with the three input variables just described. Once the impedance (resistance and compliance) of the respiratory system is known, the machine’s contributions to ventilation and alveolar pressure can be characterized completely from knowledge of just those three input parameters.
Machines vary in the rapidity (rise time or inspiratory slope) with which airway pressure builds toward the preset maximum value. Faster rates of pressurization are needed in certain situations when flow demands are high (during assisted pressure-controlled ventilation) so as to achieve high peak inspiratory flows that exceed patient demands. Because of limitations in the controlling system of most ventilators, however, a faster (shorter) rise time has to be selected during low-impedance conditions (in large patients), whereas a slower one has to be selected during high-impedance conditions (to avoid overshoots in airway pressure at the beginning of inspiration). Some newer machines allow the clinician to adjust rise time to suit the situation at hand, whereas others adjust it automatically.
With most machines today, physicians set the pressure increment above external PEEP to be applied during inspiration. This means that absolute inspiratory pressures increase as external PEEP increases. With a few machines, the physician has to set the absolute inspiratory pressure, which is independent of external PEEP.
When considering a plot of airway-opening pressure (Paw) over time, mean airway pressure is the integral of Paw over time divided by the time span of the breath. Two input parameters that the clinician sets during PCV bear direct relationships to mean airway pressure ( ): preset inspiratory pressure and TI/TTOT. Because of the square waveform of pressure during PCV,
  can be expressed simply as
where PEEPE is external PEEP. Therefore, variations in either set pressure (PSET) or TI/TTOT influence  predictably. Frequency variations leave
  unaffected.28,29
Under passive conditions, airway pressure represents the total pressure applied across the respiratory system. Under this circumstance, it can be demonstrated mathematically that mean alveolar pressure  bears a close relationship with
  , and its bedside estimation requires only some previous assessment of inspiratory and expiratory resistances
where RE and RI are mean expiratory and mean inspiratory resistances, respectively, and  is the minute ventilation.
Some practical conclusions can be drawn from this simple formulation. First, changing frequency alters mean alveolar pressure very little if inspiratory and expiratory resistances are similar. In this particular situation, mean airway pressures will reflect alveolar pressures consistently. Conversely, when expiratory resistance exceeds inspiratory resistance, a frequent condition in chronic obstructive lung disease, mean airway pressures can seriously underestimate mean alveolar pressures, especially when minute ventilation is high. Under such conditions, variations in frequency do influence mean alveolar pressure, and physicians easily could overlook the hemodynamic consequences of a ventilator setting.
Figure 9-2 illustrates some additional features related to alveolar and airway pressures during PCV. Alveolar pressure (PA) can rise no higher than PSET, the pressure to which it equilibrates at end inspiration when sufficient inspiratory time is provided (in Fig. 9-2 there is no equilibrium). Peak PA falls rather than rises with increasing frequency. One also can grasp from the figure that intrinsic PEEP increases with increasing frequency, reducing the effective ventilating pressure (PSET–total PEEP) and consequently reducing tidal volume. As frequency increases further, PA oscillations decline to the point that  sets the upper bounding value for intrinsic PEEP.
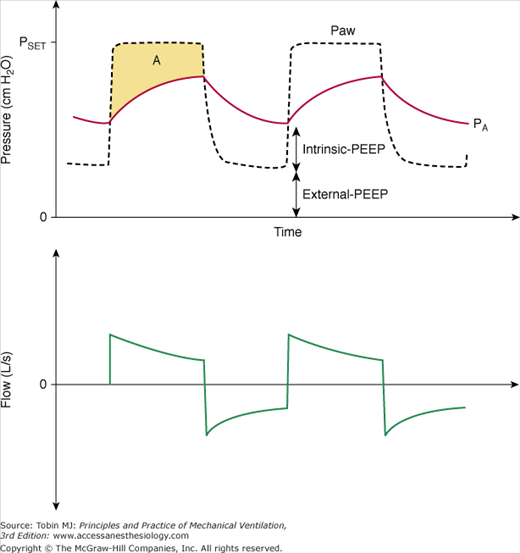
Figure 9-2
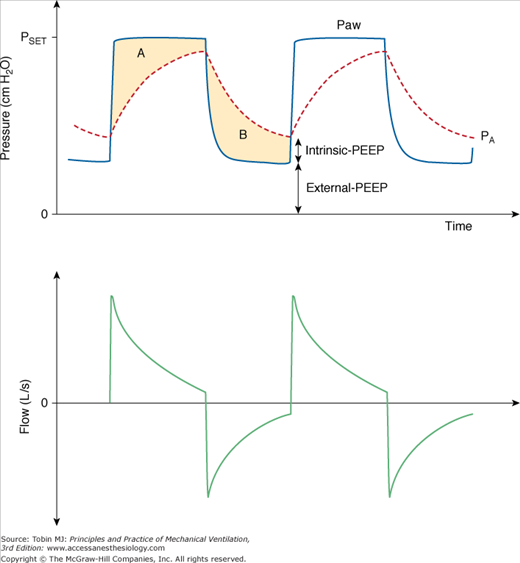
Airway opening pressure (Paw), alveolar pressure (PA, red dashed line) and flow during pressure-controlled ventilation. Intrinsic-PEEP presents a backpressure that opposes the applied pressure (PSET) and reduces the effective ventilating pressure, which is equal to PSET–total-PEEP (total-PEEP = intrinsic-PEEP + extrinsic-PEEP). Areas A and B represent the pressure-time product dissipated during inspiration and exhalation, respectively. These areas are proportional to mean inspiratory and expiratory resistances.
Under conditions of passive inflation, mean airway pressure reflects the average distending pressure of the respiratory system. Understandably, therefore, mean airway pressure has been associated with two beneficial physiologic effects (ventilation and oxygenation) and three potentially noxious effects (hemodynamic compromise, fluid retention, and barotrauma). These effects, however, are nonlinear, and there are exceptions. For instance, as discussed later, the relationship between  and oxygenation is very dependent on the extent of pressure-volume hysteresis of the lung, which is greatly affected by lung disease. The greater the hysteresis, the greater is the dependency of oxygenation on PEEP and previous lung history (i.e., the maximum alveolar pressure achieved in previous breaths), and the looser is the correlation between the current
  and oxygenation. In situations of negligible lung hysteresis, for instance, during partial liquid ventilation, the correlation between
  and oxygenation is straight forward.30 The complex relationship between
  and oxygenation is further elaborated in the short discussion of IRV below.
Mean airway pressure is also a measurable correlate of the back pressure for venous return. Raising  during passive ventilation increases both lung and chest volumes by similar amounts. Lung expansion tends to increase right-ventricular afterload, which is already high in many patients with acute respiratory failure. More important, the increase in intrapleural pressure may raise right-atrial pressure, often impeding venous return. Rising back pressure can have clinical consequences in patients with impaired systemic venous tone and reduced tissue turgor (e.g., consequent to sedation or paralysis). Sodium and water retention also tends to correlate with the magnitude of
  . Although high
  may not be directly implicated in the generation of barotrauma (barotrauma seems to be mainly associated with high inspiratory plateau pressures or high inspiratory driving pressures31), a high level of
  may exacerbate damage or accentuate gas leakage through rents in the alveolar tissues, thereby bringing barotrauma to clinical attention.
As discussed earlier, the major “output” variables of PCV are tidal volume, intrinsic PEEP, minute ventilation, alveolar ventilation, and inspiratory flow.
When maximal airway pressure is preset, the tidal volume actually delivered varies with several key variables: the pressure gradient existing between the airway opening and the alveolus at the onset of inflation, the resistance to airflow, the compliance of the respiratory system, and the time available for inspiration. Theoretically, inspiratory time should be longer than the three time constants of the respiratory system to allow near-complete (>95%) lung filling, thus maximizing delivered tidal volume. This scenario would guarantee that alveolar pressures are in equilibrium with airway pressures at the end of inspiration. In adult patients with orotracheal intubation, equilibration usually requires 1.0 to 1.5 seconds of inspiration. In the presence of severe obstructive disease, this value can be as high as 2 to 4 seconds, whereas in patients with reduced compliance (acute respiratory distress syndrome [ARDS]) this value can be as short as 0.8 to 1.0 second. To improve synchrony during assisted PCV, sometimes it is necessary to match the spontaneous inspiratory time of the patient. In this case, inspiratory time rarely should exceed 1.2 seconds, usually resulting in incomplete lung filling but promoting comfort.
Any residual end-expiratory pressure (intrinsic PEEP) detracts from the total pressure difference available to accomplish ventilation (driving pressure). Therefore, incomplete lung emptying is also an important factor affecting the delivered tidal volume. To allow near-complete lung emptying, expiratory time should be longer than three expiratory time constants. The aggravating factor is that expiratory resistance is usually higher than inspiratory resistance, implying that the expiratory time constants are longer. An expiratory time shorter than 1.5 seconds in an adult patient should be considered a potential source of intrinsic PEEP, reducing the potential for tidal volume delivery.
Such relationships are also valid during low tidal ventilation (used for lung protection, often combined with tidal volumes of approximately 6 mL/kg or lower), which means that incomplete lung filling or emptying are common at respiratory rates above 25 to 30 breaths/min. Because the absolute values of intrinsic PEEP, however, in this setting tend to be negligible (from a clinical perspective),32 clinicians have used PCV with respiratory rates up to 40 breaths/min without great concern about intrinsic PEEP.
Intrinsic PEEP (auto-PEEP) that results from dynamic hyperinflation is a complex function of the input parameters of PCV in conjunction with the impedance characteristics of the respiratory system.33 The general principles affecting it can be summarized as follows: (a) higher-frequency, longer TI/TTOT ratio, and higher PSET tend to increase intrinsic PEEP; (b) increments in TI/TTOT cause a monotonic increase in intrinsic PEEP from external PEEP up to PSET; (c) pure increments in frequency also cause an increase in intrinsic PEEP but with a saturation effect that limits intrinsic PEEP to half (approximately) the range between external PEEP and PSET, which arises because as frequency rises, inspiratory time is curtailed, preventing equilibration between applied airway and alveolar pressures, keeping maximum PA well below PSET (Fig. 9-3); and (d) the higher the compliance and the higher the expiratory resistance, the higher is the intrinsic PEEP for the same input parameters. Figure 9-3 illustrates some of these relationships.
Figure 9-3
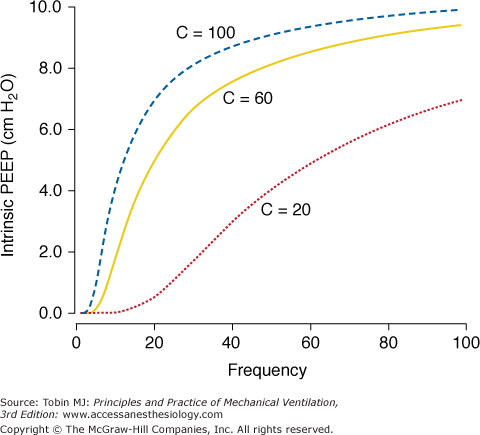
Effect of frequency on intrinsic-PEEP generation during PCV. Three impedance combinations with moderate airflow obstruction and varying respiratory system compliance (expressed in mL/cm H2O). A decrease in compliance causes both a reduction in intrinsic PEEP and alteration in the curvature of the intrinsic PEEP-to-frequency relationship. Note that curves converge to an asymptote at 10 cm H2O, which corresponds to approximately half PSET. Simulated conditions: PSET = 20 cm H2O above PEEP; TI/TTOT = 0.4; RE = 25 cm H2O/L/s. (Adapted from Marini JJ, Crooke PS 3rd. A general mathematical model for respiratory dynamics relevant to the clinical setting. Am Rev Respir Dis. 1993;147(1):14–24).
The relationships just described are responsible for important and nonintuitive effects on minute ventilation (Figs. 9-4 and 9-5). When frequency increases at constant values for PSET and TI/TTOT, the durations of inspiration and expiration both decrease, and intrinsic PEEP rises. As tidal volume falls, minute ventilation exponentially approaches an upper bound mainly determined by resistance.33 In obstructed adult patients breathing at respiratory rates above 40 breaths/min, changes in compliance have a minor influence on minute ventilation generation, because most of the driving pressure is spent in overcoming resistive losses. For instance, a decrease in compliance from 100 to 50 mL/cm H2O will produce a maximum fall in minute ventilation of 10%. This situation resembles a condition commonly observed during high-frequency oscillation,34,35 when the distribution of ventilation is mainly driven by the distribution of regional resistances, rather than regional compliances.
Figure 9-4
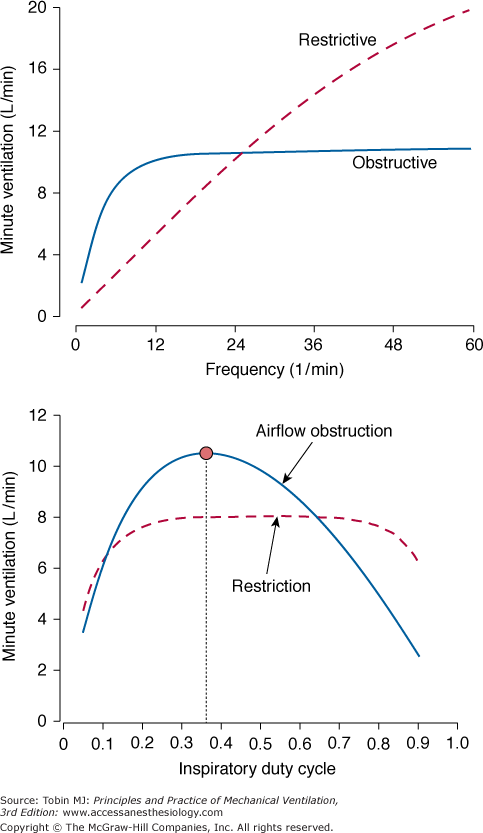
Upper plot. Effect of frequency on minute ventilation during PCV. An increase in frequency causes tidal volume to fall so that minute ventilation approaches a mathematically defined plateau value mainly determined by the applied pressure and resistance. The approach is more gradual for a restrictive ventilatory defect with low compliance. Bottom plot. Unlike minute ventilation in the obstructed condition, for which a distinctly optimal TI/TTOT is evident (red dot), minute ventilation in the restricted condition remains essentially unaffected by changes in this parameter. Simulated conditions: PSET = 20 cm H2O above PEEP; TI/TTOT = 0.4; restrictive, C = 20 mL/cm H2O, RI = RE = 10 cm H2O/L/sec; obstructed, C = 100 mL/cm H2O, RI = 15, RE = 45 cm H2O/L/sec. (Adapted from Marini JJ, Crooke PS 3rd. A general mathematical model for respiratory dynamics relevant to the clinical setting. Am Rev Respir Dis. 1993;147(1):14–24.)
Figure 9-5
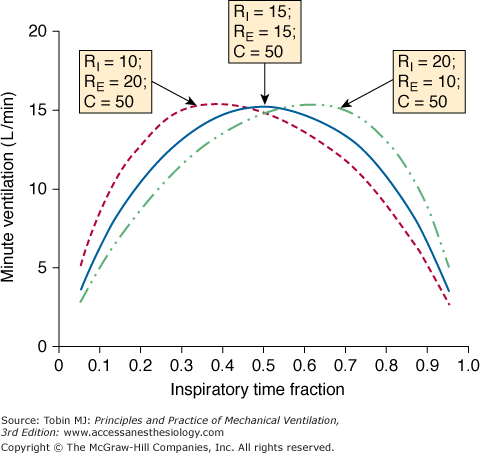
Effect of inspiratory time fraction(TI/TTOT) on minute ventilation according to the balance between inspiratory and expiratory resistances (RI and RE, respectively). As is true for tidal volume, the apogee of the curve is reached at TI/TTOT = 0.5, provided that RI = RE. Note that optimum TI/TTOT is shifted leftward, when RE > RI, exemplifying a common situation in clinical practice. (Adapted from Marini JJ, Crooke PS, 3rd, Truwit JD. Determinants and limits of pressure-preset ventilation: a mathematical model of pressure control. J Appl Physiol. 1989;67(3):1081–1092.)
Figure 9-4 suggests that in patients with moderate to severe airway obstruction (resistance ≥25 cm H2O/L/s), the benefits of increasing respiratory rate above 12 breaths/min is negligible (this is an important hint when ventilating patients with asthma). The situation changes considerably, however, under conditions of low compliance (≤25 mL/cm H2O): any increase in frequency becomes an effective mechanism to increase minute ventilation (see Fig. 9-4, top).
Important differences between obstructed and restricted patients also can be seen in the relationship between minute ventilation and duty cycle. Minute ventilation becomes very sensitive to changes in duty cycle for obstructed patients but not for restrictive patients. As shown in Figure 9-5, if one wants to maximize minute ventilation for a given PSET (a common target during intensive care of patients with asthma), TI/TTOT has to be titrated according to the ratio between inspiratory and expiratory resistances. For patients with fixed obstruction and equivalent values for inspiratory and expiratory resistances (as sometimes occurs in asthmatic patients), the ideal TI/TTOT for maximizing minute ventilation is 0.5.
Over the lower frequency range, increasing frequency tends to improve alveolar as well as total ventilation, decreasing partial pressure of arterial carbon dioxide (PaCO2); however, the same is not necessarily true when high frequencies are used. As frequency rises at a fixed, noninverse TI/TTOT, inspiratory time is curtailed, preventing equilibration between applied airway and alveolar pressures.
From a practical standpoint, the ventilator itself becomes less able to generate the nominal pressure waveform, especially when flow impedance is low and rising-time is not optimal. As tidal volume declines, the wasted fraction of each breath (dead-space-to-tidal-volume ratio [VD/VT]) increases owing to the predominance of the series (“anatomic”) dead-space component. Under certain conditions, this increase in dead space actually may cause PaCO2 to rise rather than fall with increasing frequency.36 In practical terms, there is an important message for the bedside: For a given PSET and TI/TTOT, increments in frequency may cause a decrease in PaCO2 up to the point that tidal volume decreases by 25% to 30%. Beyond this limit, even when minute ventilation increases with frequency, it is likely that further increments in frequency will be counterproductive because of excessive amounts of dead space.
Because the principles just outlined are rooted in physics and mathematics, hypercapnia can be an unavoidable consequence of a pressure-targeted strategy for managing acute lung injury.
Decelerating inspiratory flow necessarily is observed during pressure-controlled breaths with rectilinear pressure waveforms—provided that there is no patient effort. Under such conditions, the theoretical maximum of flow associated with a square wave of pressure (PSET) depends on inspiratory resistance (RI) and end-expiratory alveolar pressure (PEEPTOT), and is achieved at inflation onset:
where PEEPTOT = intrinsic PEEP + external PEEP.
In practice, however, the abruptness of the rise to the nominal peak value is a set characteristic of the particular ventilator, which may be modulated by the slope or inspiratory rise-time adjustment. Under conditions of quiet breathing, a precipitous buildup to peak flow often is associated with some pressure overshoot, which may be annoying for monitoring purposes because of alarm triggering. Because most of this pressure overshoot represents pressure dissipation as frictional work across the endotracheal tube, it does not cause elevation of peak alveolar pressure and probably is not associated with any harm.
Conversely, under high flow demands (especially in large patients, or in patients using the helmet for noninvasive ventilation), a slow “attack rate” up to peak flow can cause some pressure undershoot or a slow ramp of pressure at the initial phase of the breath, forcing the patient to expend considerable effort and causing delaying filling of the lung.37,38 Because of limitations in the hardware controlling system, the flow performance of most ventilators, especially at the first 300 milliseconds of inspiration, tends to be poor when PSET is less than 10 cm H2O. Under such conditions, maximizing rise time or slightly increasing PSET (in association with some procedure to avoid too prolonged TI, such as shortening the set TI during assisted PCV, or increasing the cycling-off criterion during PSV39) can be very helpful.
The decelerating-flow pattern found in PCV usually improves the distribution of ventilation and limits the end-inspiratory gradient of regional pressures among units with heterogeneous time constants. When inspiratory time is long enough, inspiratory flow may decrease down to zero before exhalation, a phenomenon that further favors redistribution of air or pressure among heterogeneous units and collateral ventilation.40,41 The consequences of such a flow profile are reflected mainly in the CO2 eliminated per breath (Fig. 9-6).42 The longer the inspiratory time, the more effective is the clearance of CO2, although most of the benefit may be seen already when TI slightly exceeds the point of zero flow (Fig. 9-6). This topic is discussed further in “The Controversy on Optimal Distribution of Ventilation” below.
Figure 9-6
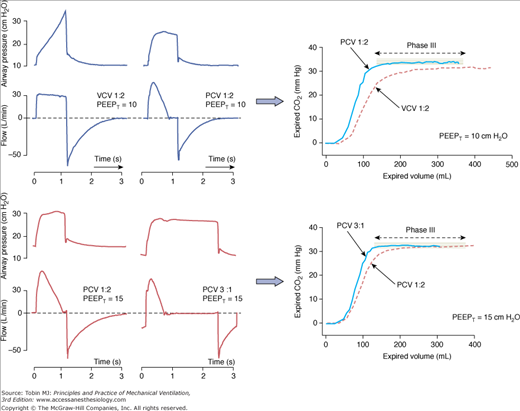
Effects of inspiratory flow profile on CO2 elimination per breath (CO2 single-breath tests obtained in a mainstream volumetric capnograph). Top. The change from flow-controlled, volume-cycled ventilation (VCV) to PCV, while keeping the same inspiratory time, resulted in more efficient elimination of CO2 per breath, reflected by the large area under the curve of CO2 versus exhaled-volume (especially in the first 200 mL, and consequently reflecting a lower dead space). Note that inspiratory flow decayed to zero before exhalation and that the phase III slope is almost flat during PCV, reflecting less heterogeneity among lung units. Arterial PCO2 was the same (38 mm Hg) in both conditions, despite the lower tidal volume during PCV. Bottom. Changing PCV with an I:E ratio = 1:2 to PCV with an I:E ratio = 3:1 (when part of external PEEP was replaced by intrinsic PEEP) resulted in a further increase in the area under the curve of CO2 versus exhaled volume. The benefit, however, was much less evident than in the top panel.
Figures 9-7 and 9-8 illustrate the effects of resistance and compliance on flow profile. Because of the consequent increase in time constant, increments in resistance tend to produce a less decelerating flow pattern (presenting reduced peak flow, with more squared appearance) and rendering tidal volume very sensitive to reductions in inspiratory time. In contrast, decrements in compliance tend to accelerate flow decay. It is obvious, therefore, that restrictive patients tolerate a shorter inspiratory time without marked consequences to their tidal volume.
Figure 9-7
Typical tracings in an obstructed patient receiving PCV. Note that the flow pattern resembles a square waveform, mimicking flow-controlled, volume-cycled ventilation. Intrinsic PEEP is evident and end-inspiratory alveolar pressures (in red) are much lower than end-inspiratory airway pressures (black dashed line).
Figure 9-8
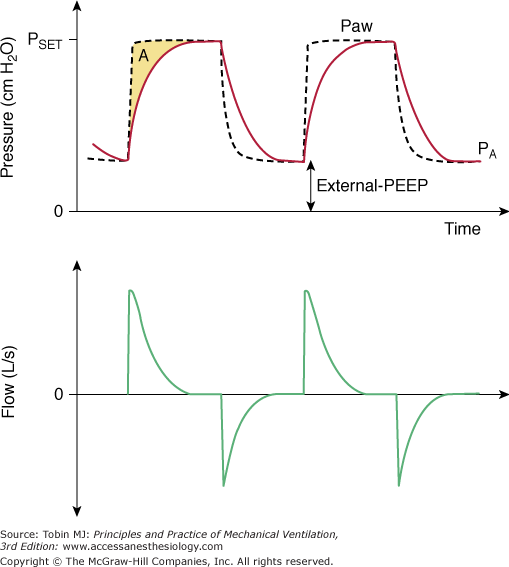
Typical tracings observed in a restricted patient receiving PCV. Note that inspiratory flow decelerates quickly, achieving zero-flow conditions well before the end of inspiration (generating a small area A; compare with Fig. 9-7). There is no intrinsic PEEP and end-inspiratory alveolar pressures (in red) equilibrate with end-inspiratory airway pressures (black dashed line).
Physiologic Effects of Pressure-Controlled Ventilation
A major feature of PCV is that peak alveolar pressure cannot rise any higher than PSET. In critical situations, when one attempts to minimize ventilator-induced lung injury, this aspect of PCV may be convenient. Specifying the maximum achievable alveolar pressure, however, does not cap the upper limit for transalveolar pressure (equivalent to transpulmonary pressure during an end-inspiratory pause) unless the patient’s own breathing efforts also have been silenced (see Fig. 9-1). As suggested by many studies, transalveolar pressure, rather than alveolar pressure, is the key determinant of ventilator-induced lung injury and barotrauma.43,44
In the absence of patient efforts, keeping peak alveolar pressures within a safe range makes sense. Under these circumstances, controlling airway pressure effectively controls maximal alveolar pressure. Obviously, the same peak alveolar pressure always can be achieved by flow-controlled, volume-cycled ventilation, although more bedside adjustments are necessary. The subtle difference here is that by selecting pressure as the controlling parameter, the physician better defines the priority of his or her strategy (i.e., to minimize peak alveolar pressure at the expense of minute ventilation and possible hypercapnia) and probably minimizes violations to the target during ongoing tidal ventilation (see the section The Controversy on Optimal Distribution of Ventilation).
When thinking in peak alveolar pressures as opposed to peak airway pressures, it is important to stress some important aspects of PCV. When inspiratory time is brief, end-inspiratory airway and alveolar pressures fail to equilibrate, so the maximal alveolar pressure is considerably less than the set value. This is reflected by persistent end-inspiratory flow, which frequently occurs in obstructed patients.
For a given inspiratory time and peak airway pressure, however, PCV is the waveform that applies the greatest cumulative pressure to the respiratory system.45 Therefore, for the same peak airway pressure—and provided that inspiratory time is long enough—PCV generates a higher peak alveolar pressure and a higher tidal volume than VCV (flow-controlled, volume-cycled breaths delivered with a square-wave profile). Such characteristics of PCV are advantageous during laryngeal mask ventilation: for the same delivered tidal volume, PCV generates lower peak laryngeal pressures during inspiration (approximately 3 to 4 cm H2O lower than during VCV), resulting in less inadvertent gastric insufflation,46 and keeps peak airway pressures at a safer distance from the threshold leak pressures.47
The consequences of PCV on  were discussed earlier. It is an important parameter for evaluating the hemodynamic consequences of PCV. Unlike in flow-controlled VCV,
  relates linearly to PSET and TI/TTOT (see Eq. 1). As its defining equation indicates,
  is unaffected by changes of respiratory system impedance and frequency. Provided that changes in inspiratory and expiratory resistance are roughly balanced, mean alveolar pressures follow mean airway pressures very consistently. Consequently, the impact of adjustments in
  on
on  can be predicted much more easily during PCV than during VCV.
Such a straightforward relationship between  and the input parameters of PCV may be convenient during short-term procedures such as recruiting maneuvers. By adjusting PEEP, PSET, and TI/TTOT, one can easily predict the generated
  (or
(or  ) and hence the hemodynamic consequences. Recent studies demonstrate the relative safety of recruitment maneuvers using PCV for 1 to 2 minutes,15–17 which achieved equivalent or superior efficacy as sustained pressure maneuvers (continuous positive airway pressure [CPAP]) adjusted to equivalent PSET.15,48–51 Because the motor of effective recruitment is the surpassing of threshold opening pressures of terminal airspaces,52 applied long enough to overcome the forces of viscosity and adhesion,53 cyclic pressurizations with PCV provide an interesting alternative. At the same time that repeated waves of inspiratory pressure promote progressive recruitment, repeated relief of pressure during exhalation minimizes impairment of venous return. Theoretically, one should adjust PSET above the threshold opening pressures, adjust PEEP above the closing pressures, and ensure that inspiratory time is long enough to favor slow, sequential stepwise recruitment of clumps of alveolar units.52 As suggested by Neumann et al,54 inspiratory times exceeding 0.6 second (ideally closer to 3 seconds)—for instance, obtained during PCV with a frequency of 8 to 10 breaths/min and an I:E ratio of 1:1—would be enough to maximize the potential for recruitment at a certain PSET. The great appeal of such PCV maneuvers is their reasonable hemodynamic tolerance: because the
  generated during a PCV maneuver is substantially less than the
  generated during a CPAP maneuver (at equivalent PSET), the hemodynamic consequences are less pronounced.48,50,51,55 Preceding volume expansion with colloids further improves hemodynamic tolerance of the maneuver.50
Some investigators, such as Schreiter et al,56 have applied PCV recruiting maneuvers over much shorter periods (approximately 10 to 15 seconds) but reached higher inspiratory pressures (50 to 80 cm H2O) and reported good success in patients with severe chest trauma. Comparative data of the relative efficacy and safety of shorter, more intensive application of recruiting pressures57–60 versus longer (1 to 2 minutes) application of less intensive (45 to 60 cm H2O) recruiting pressures15,17,61–63 do not yet exist.
When some active patient effort is present during PCV, the primary control of airway pressures (instead of flow) might offer the potential benefit of introducing some variability in the flow or tidal volume profiles among breaths. By design, an assisted PCV breath provides more freedom (lower machine impedance) for the intrinsic variability of a patient’s respiratory motor output to manifest. Besides the likely improvement in comfort, recent research suggest that some random variation (within certain limits) in the effective driving pressure applied to the respiratory system may bring additional benefits in terms of oxygenation, mechanics, and surfactant function.64–69 The benefits of such extra freedom, however, have to be tempered in conditions where lung protection is a priority, especially when patient effort becomes too vigorous (see Fig. 9-1).
As with any time-cycled mode of ventilation, PCV invites dyssynchrony when the patient breathes spontaneously. The implications of slow rising-time settings were discussed earlier. It is important to think about the other end of the inflation period, however, when the airway continues to be pressurized to the nominal value until the set inspiratory time has elapsed. As with flow-controlled VCV, the patient may attempt to cycle to expiration before the ventilator completes its pressurization cycle. One could imagine, however, that unlike the situation with flow-controlled ventilation, patient effort never could force airway pressure higher than the preset value during PCV. Unfortunately, this is not always true (see the section Activation of Exhalation Valve During Pressure-Controlled Ventilation: Airway Pressure Release Ventilation) because of hardware limitations in some ventilators.
Another feature related to dyssynchrony is the fact that by fixing TI, as required with many commercial ventilators, one allows TI/TTOT to vary with frequency whenever the patient retains control of the cycling rhythm. As frequency increases, TTOT decreases and TI/TTOT tends to increase, often provoking dynamic overinflation and generation of intrinsic PEEP. Even with ventilators in which the direct input is “duty cycle,” most of them calculate the inspiratory time based on the set frequency rather than on measured frequency. Therefore, the resulting TI/TTOT can be very different from the originally set TI/TTOT.
Several studies have attempted to demonstrate a definitive advantage of PCV over VCV (squared flow pattern) in terms of ventilation distribution, oxygenation, hemodynamics, lung injury, and patient outcome. At first glance, results seem inconclusive. By separating the studies according to key ventilator parameters measured, however, some consistency emerges.
First, it is important to distinguish studies that compare PCV-IRV from studies comparing PCV with normal I:E ratio against other modes. As discussed within this section, the effects of IRV are complex and depend on intrinsic PEEP generation. Thus, during IRV, the choice of the controller (flow versus pressure) is just a minor issue inside a complex and broader picture. Second, it is important to observe whether all the remaining variables (I:E ratio, tidal volume, intrinsic PEEP, total PEEP, frequency, and O2 fraction) were kept constant during the comparison and whether they were consistent. For example, studies displaying different plateau pressures or tidal volumes during PCV and VCV can hardly be considered to be perfectly matched if one is interested in the effects on oxygenation70 or lung overdistension.71 Thus, they should not be used to draw important conclusions on this controversy.
Keeping such boundaries in mind and by considering only the effects of a pure change in the type of controller (from squared flow control to squared pressure control,
Related posts:


Stay updated, free articles. Join our Telegram channel

Full access? Get Clinical Tree


