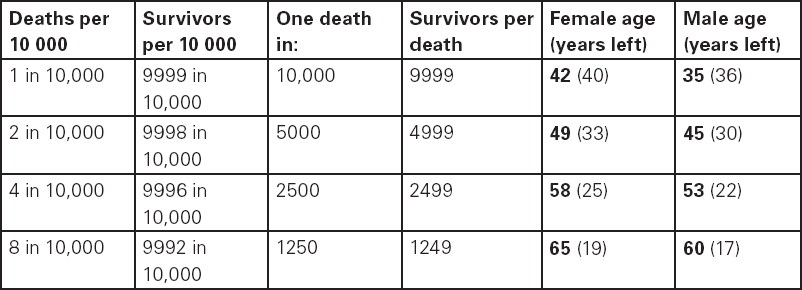
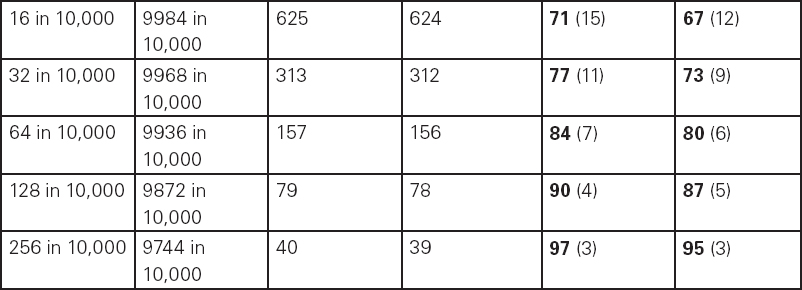
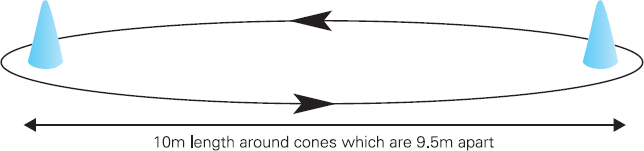
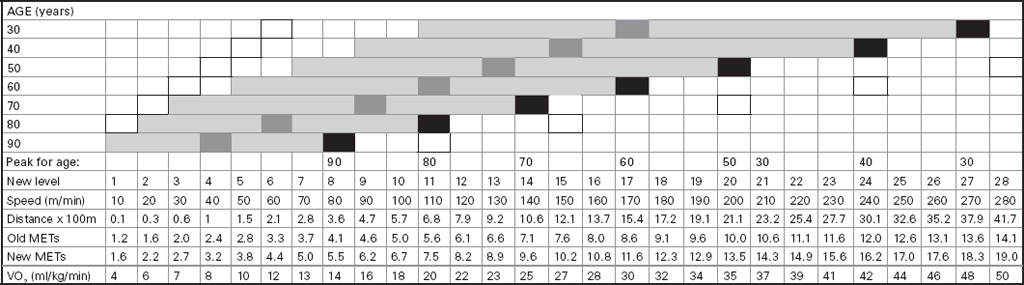
John Carlisle This chapter will describe: • how to estimate the chances of survival and death and methods to reduce risk • how to decide whether to proceed with surgery and to help minimise risk • a step-by-step sequence to determine risk and review other risk scores • how information from a fitness test increases the precision of the survival estimate. A common question from patients is ‘what are my chances of survival (my risk of dying) if I have surgery?’ More specifically, what happens to my chances if I have this surgery? Researchers have tried to answer this question by looking at populations having surgery and recording who is alive and who is dead one month after surgery (actually the outcome has usually been cardiac complication rather than death). Some people are more likely to die and some types of surgery are more likely to kill. Researchers recorded before surgery whether or not patients have a factor that they (the researchers) thought might influence the risk of dying, for instance whether the patient had had a heart attack. Researchers also recorded what surgery the patient had. Then, usually one month after surgery, the researcher recorded whether or not the patient had experienced the outcome(s) of interest – usually heart attack, stroke or ‘cardiac’ death. In this way researchers could see whether or not the presence of a variable was associated with the outcome and by how much (using multivariate logistic and linear regression statistics). Different researchers have generally associated similar patient and surgical variables with the same (or similar) outcomes. I list later some of the scoring systems that have resulted from these associative studies. However, there are sources of survival data that until now preoperative services have not used. In this chapter I will describe how to use these sources of information. The benefits of using previously untapped information sources are: • the precision and reliability of risk estimates will be better (data derived from a bigger population) • you can estimate preoperative mortality risk as well as the postoperative risk (putting the latter into context to facilitate decision-making) • you can estimate survival chances for anybody having any operation, not just people similar to those assessed by the perioperative researchers. Once a patient knows the likelihood of good and bad outcomes, before and after surgery, with and without surgery, they can decide what to do. We can plan how to make their hospital stay safe, using resources, like intensive care, efficiently. To make an informed decision as to whether or not to have surgery one needs to know: what the risk is for good and bad outcomes without surgery (see below); what the risk is for long-term (more than one month) good and bad outcomes after surgery. Most published scoring systems do not provide this information. This chapter will provide you with a template for risk assessment for one outcome – death. This template is based upon a logical sequence of steps for risk calculation, which can also be used to determine the risks for other specific outcomes (such as myocardial infarction, cardiac arrest, cardiac death, deep vein thromboses). The first stage in this process is to start with the average risk of dying for a population with a given age and sex. Population risks, published by the United Kingdom government, are derived from all deaths in the UK and are therefore precise. Other scoring systems derive risk from relatively small surgical populations, numbering in total a few thousand. These systems do not assess the preoperative risk. There are much larger survival studies of people not having surgery. These provide more precise estimates of the preoperative association of a variable, such as heart failure, and survival. The preoperative risk for an outcome such as death illustrates to patients and clinicians the likelihood of an outcome without surgery. The final step in the sequence is to estimate the effect of a particular operation on a person’s risk (of death), i.e. the postoperative risk. Once you have followed these steps and calculated the postoperative risk, you can compare it with the risk quoted by published scoring systems. One caution is that the scoring system you are comparing with is for the same outcome (this chapter describes death – although many scoring systems are for cardiovascular events). If the two estimates are particularly different you should recalculate and try and determine whether your patient is particularly different from the patients used to calculate the risks in the surgical scoring system. To predict survival from surgery you need to measure the fitness of the patient as best you can. The four variables that together predict survival in people without disease are: • age • sex • socioeconomic status • fitness. These variables also form the basis of survival prediction for people with systemic diseases: a few diseases independently increase risk above and beyond their effect on fitness (see below). If you assess fitness by history alone you will be unable to predict survival as well as you could if you measured fitness directly, no matter how many other variables you take into account. Four variables, described in Step one, Step two and Step three, determine the risk of dying in the healthy patient. Five additional variables determine the risk of dying in patients with disease. Each variable is independent, so multiply the risk you have calculated in preceding steps by the value in the next step. Step one: Age and sex (www.gad.gov.uk) In the United Kingdom all deaths are recorded and used to calculate age-specific and sex-specific survival. These figures are updated every year and can be downloaded in spreadsheet form giving survival for men and women. Table 2.1 lists examples of mortality risk and median life expectancy for men and women. These data provide a precise but average risk of dying. The risk of death doubles about every seven years. For instance, the risk that a 58-year-old woman will die in the next month is 1 in 2500, the risk that a 65-year-old woman will die is 1 in 1250. The risk that a man will die is 1.7 times the risk that a woman will die. Steps two onward determine how average a patient is. Table 2.1 Examples of UK monthly mortality and median years left Http://www.gad.gov.uk/Demography_Data/Life_Tables/Interim_life_tables.asp The impoverished are twice as likely to die as the wealthy. This association is reasonably consistent using occupation, educational qualification or income as the measurement of wealth. Ethnicity is not an independent risk factor: poverty, and the risk factors listed below, account for differences in all-cause mortality between ethnic groups. Regional mortality rates account for some geographical variation in wealth. Multiply the average regional mortality rate by 1.5 for the impoverished and by 0.7 for the wealthy.1,2 Fit people are more likely to survive than unfit people, for both healthy and diseased populations. Traditional assessment is based upon the maximum work (power) that someone says they can achieve, usually in terms of day-to-day activities, like walking or going upstairs. The approximate power required to achieve these activities is listed in tables as the number of METs (metabolic equivalents). One MET is the internal power used at rest. The MET scale of daily activities was not intended to be a prognostic measure and imprecisely stratifies risk. Fitness assessment by history, using the MET scale and others, is unreliable. Bodies are powered by oxidising food. Food oxidation at rest is often quoted as using 3.5 millilitres of oxygen every minute for every kilogram of body mass (3.5 ml O2/kg per min). This is the value most MET scales assume as one MET and the value used by treadmill studies of fitness and survival. When fitness is tested by observation, rather than relying upon how fit people say they are, the following relationships apply between fitness and survival for men and women: • The expected peak power (in METs) for men3 is 18.4 – (0.16 x age). • The expected peak power (in METs) for women4 is 14.7 – (0.13 x age). • The risk of dying is more for unfit people – multiply the risk (from Step one and Step two) by 1.19 for every MET short of the expected peak power (for age). The risk of dying is less for fit people – multiply the average risk by 0.84 for every MET in excess of the expected peak power.5–11 Incidentally the value used in the MET scale for oxygen consumption at rest is incorrect. The correct average adult resting oxygen consumption is 2.6 ml O2/kg per min, with 95% of adults consuming between 2.0 and 3.4 ml O2/kg per min.12 Fitness testing provides precise prognostic information and replaces risk based upon historical factors, such as hypertension and diabetes (see pages 23–4). However historical risk factors can help one decide which test to do: the incremental shuttle walk test (ISWT) or cardiopulmonary exercise testing (CPX). CPX is more complex than the ISWT. In the CPX test peak oxygen consumption (and therefore METs) are measured directly, whereas the ISWT estimates peak METs (and oxygen consumption). CPX testing provides the most precise prognostic information, but it is too labour-intensive a method to use in every preoperative patient, unlike the ISWT. This assessment in relation to cardiac disease and management is discussed in more detail in Chapter 5. Measuring fitness, part one: incremental shuttle walk test (ISWT) The ISWT is better than many other fitness tests, such as the distance walked in 6 or 12 minutes, or the number of stair flights ascended, because it requires the participant to increase power throughout the test. The ISWT is a slower version of the ‘shuttle’ or ‘bleep’ test used in sport. In the ISWT you have to keep travelling to and fro 10 metres, around two cones 9.5m apart (figure 2.1). In the first minute of the ISWT, participants are usually asked to complete three 10m lengths, four lengths in the next minute and so on.13–16 In Table 2.2, (see page 20) I have illustrated the power levels that men and women of different ages are expected to achieve, using the relationships between age and expected peak power that I have described above. I have added two levels, so that if you started at level one you would have to complete one length in the first minute and two in the second minute. These two (new) levels allow the elderly and infirm to start very slowly. I have suggested faster starting levels for fitter and younger men and women. I have assumed that people start to jog above a speed of 130m/min (level 13) when I calculated oxygen consumptions and METs: the relationship between speed and work is different for walking and running.17–23 Figure 2.1 Incremental shuttle walk test course Table 2.2a Predicted fitness for men Table 2.2b Predicted fitness for women New level: number of lengths each minute in the ISWT. Distance: cumulative distance if one started at level 1. Old MET: multiples of resting oxygen consumption estimated as 3.5ml 02/kg per min. New MET: multiples of resting oxygen consumption estimated as 2.6ml 02/kg per min. V02: oxygen consumption. Table 2.2 Looking at Table 2.2a, a 60-year-old man of average fitness would start at new level five and would be expected to reach level 17 (indicated by a black box). A 60-year-old man who continued to level 24 (indicated by an unshaded box) would have half the average risk of dying. A 60-year-old man with double the average risk of dying would stop at level 11 (indicated by a dark grey box) having also started at level five. A 60-year-old man with four times the average risk would not exceed level 3 (another unshaded box). You may need to start patients at a lower level than I have indicated if you think they are particularly unfit, so that they walk at least five minutes before stopping. Measuring fitness, part two: cardiopulmonary exercise testing (CPX) Only the distance (and time) walked (or run) is recorded by the ISWT. This is used to estimate the peak power and oxygen consumption achieved. How well someone’s body copes up to the time they stop is not measured: with the ISWT this information cannot be used to improve prognostication. Cardiopulmonary exercise testing (CPX or CPET), unlike the ISWT, directly measures the aerobic capacity of someone whilst they exercise, usually either on a treadmill or bicycle24 (see Figure 2.2, page 22). The CPX test measures the breath volume, oxygen consumption and carbon dioxide production during exercise. An ECG with ST segment analysis and pulse oximetry is recorded throughout, along with intermittent non-invasive blood pressures. Rarely, arterial blood gases are sampled. As in the ISWT, power increases throughout the CPX test until the person stops, by increased braking on the bicycle and by increased speed and gradient on the treadmill. Incremental exercise should last at least five minutes, and preferably ten minutes, to accurately gauge prognosis. The expected peak powers (and related peak oxygen consumptions) for men and women of different ages, are the same for CPX as for ISWT. Combinations of CPX variables that improve prognostic precision include: the amount of breathing needed to get oxygen in • helps clinicians determine whether surgery is more likely to harm or benefit a patient • helps patients determine whether to have surgery • helps determine the efficient use of scarce resources (critical care, transplants) • helps determine the likelihood that interventions could improve outcomes. Readers interested in using CPX results should refer to specialist texts listed on page 32. Figure 2.2 CPX testing Steps one, two and three calculate the preoperative risk of dying in someone without disease. Five diagnoses independently increase the risk already calculated using age, sex, wealth and fitness. Histories of peripheral vascular disease (PVD), stroke, heart failure, myocardial infarction or renal failure (creatinine concentration more than 150µmol/L) each independently increase the risk of dying by about 1.5. Temporary ischaemia, instead of tissue infarction, in the heart (angina) or brain (TIAs) increases the risk of dying by 1.2 rather than 1.5. The elevated risk following infarction is maintained over decades, whilst the lesser risk from stable temporary ischaemia falls over time.1,2, 33–44 Step one: Determine baseline risk with age and sex. Step two: Multiply baseline risk from Step one by 1.5 for poorest, 0.7 for wealthiest. Step three: Multiply risk from Step two by the relative risk associated with the peak power achieved in the ISWT or CPX test. Step four: Multiply risk from Step three for a history of each of the following – myocardial infarction (1.5); heart failure (1.5); stroke (1.5); peripheral vascular disease (1.5); creatinine concentration more than 150µmol/L (1.5). An example is shown in Box 2.1(opposite).
Chapter 2 Preoperative estimation of survival and mortality risk
SUMMARY
INTRODUCTION
Assessing risk
The importance of fitness
Calculating the preoperative risk of dying
Step two: Wealth
Step three: Aerobic fitness

 and carbon dioxide out
  ; the amount of oxygen used to fuel increasing power
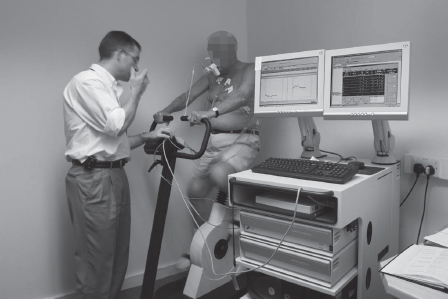
  ; and the threshold above which aerobic respiration alone cannot meet metabolic demand – the ‘anaerobic threshold’ (AT).25–31 Heart rate during exercise and recovery also supply additional prognostic information.32 Changes in the ECG complex, for instance ST depression or elevation, do not usually increase prognostic precision. Patients with hip and knee osteoarthritis or claudication who find walking painful may prefer bicycle CPX to either the ISWT or treadmill CPX. The more complete prognostic information provided by CPX tests is probably of use if it:
Step four: Heart, brain, kidneys and legs
How to use Steps one to four
| Box 2.1 Example of risk assessment process in surgery |
|---|
| What is the (preoperative) risk that a 54-year-old woman, who smokes and is treated for hypertension and type 2 diabetes, who had a heart attack four years ago, and who can reach new level 10 in the ISWT, will die in the next month? |
| Step one: average risk of dying for a 54-year-old woman is 1 in 3418. |
| Step two: estimate unchanged as no socioeconomic information. |
| Step three: estimate multiplied by relative fitness. Average peak power (in old METs) expected for a 54-year-old woman is 14.7 – (0.13 x 54) = 7.7 old METs. This is new level 15 (or old level 13) in the ISWT. She reached new level 10, or about 5.6 old METs. The difference is 7.7 – 5.6 = 2.1 METs. The relative risk is 1.19 x 2.1 = 2.5. So the new estimate is 2.5 in 3418. |
| Step four: estimate multiplied for previous heart attack (1.5) = 1.5 x 2.5 = 3.75 in 3418. |
| In other words, her approximate risk of dying in the next month is 1 in 910, and her approximate chance of survival is 909 in 910. |
Smoking, diabetes, blood pressure and cholesterol
These risk factors for cardiovascular disease do not alter risk if fitness has been measured. Calculation of the preoperative risk of dying is complete with Steps one to four using nine variables: age, sex, wealth, fitness, five diseases (listed on page 25). The effect on survival of the background risk factors that I discuss here, and that occupy the time of primary care, is detected through these nine variables. These variables are only independent risk factors if fitness has not been measured.1,2,33–44 Smoking, diabetes, hypertension and hypercholesterolaemia increase the risk of death, mainly through atherosclerotic disease. I have simplified the relationship between these variables and death. There is no blood pressure, cholesterol ‘threshold’ or smoke exposure for which the risk of death suddenly increases. The relationship is a gradual increase in risk with higher values, or a decrease in risk with lower values.
Smoking
In the United Kingdom about one in four adults smoke. Someone who smokes (or who has stopped in the last five years) is about 1.5 times as likely to die as average. Someone who has not smoked in the last 5 years is about 0.8 times as likely to die as average. The risk of dying increases by 1.2 for every 10 pack-years. One pack-year is smoking 20 cigarettes each day for one year or ten cigarettes each day for two years (and so on).
Diabetes
About one in 20 adults in the UK have a diagnosis of diabetes, of whom 10% have Type 1 diabetes and 90% have Type 2 diabetes. Type 1 diabetes increases the risk of dying 3 times; Type2 diabetes increases the risk of dying 2 times. Non-diabetics have about an average risk of dying.
Hypertension
About one in three adults are either already treated for hypertension, or consistently have a systolic blood pressure (SBP) above 140mmHg when it is measured in primary care. Adults treated for hypertension, or who have a SBP in primary care above 160mmHg, are about 1.5 times as likely to die as average. Untreated adults with systolic blood pressures in primary care below 130mmHg are about 0.7 times as likely to die as average. Adults with SBP between 130mmHg and 160mmHg have an average risk of dying. Use the blood pressure recorded in primary care to guide your risk calculations. Do not use blood pressure measured in hospital to calculate risk. Blood pressures measured in hospital clinics are usually higher and do not correlate with outcome as well as those measured in primary care.
Hypercholesterolaemia
The average adult cholesterol level is about 5.5mmol/L (220mg/dL). Lipidaemic atherosclerotic risk is also measured as the ratio of total cholesterol to high density cholesterol, the average of which is about 4.5. People with total cholesterol concentrations at least 8mmol/L (350mg/dL), or total:HDL ratios at least 7, are 1.25 times as likely to die as average. People with total cholesterol concentrations less than 4.1mmol/L (150mg/dL), or total:HDL ratios less than 3.1, are 0.8 times as likely to die as average. The risk of dying is about average for values in between these. Lipidaemic atherosclerotic risk is calculated on more than one blood sample. So, as with blood pressures, prognosis should use serum lipid measurements taken in primary care.
How to use Steps one, two and four without fitness
If you do not measure fitness (Step three) you have to calculate risk of dying using histories of smoking, diabetes, blood pressure, and cholesterol concentration. This risk estimation will be less accurate than risk estimates using results from the ISWT or CPX.
Step one: Determine baseline risk with age and sex.
Step two: Multiply baseline risk from Step one by 1.5 for poorest, 0.7 for wealthiest.
Smoking, diabetes, blood pressure, cholesterol: Multiply risk from Step two for smoking (1.5) or non-smoking (0.8), diabetes (3 for Type 1 or 2 for Type 2), treated hypertension or SBP more than 160mmHg (1.5) or SBP less than 130mmHg (0.7), and cholesterol high (1.25) or low (0.8).
Step four: multiply this risk for a history of each of the following: myocardial infarction (1.5); heart failure (1.5); stroke (1.5); peripheral vascular disease (1.5); creatinine concentration more than 150µmol/L (1.5).
An example is shown in Box 2.2.
| Box 2.2 Example of risk assessment process in surgery |
|---|
| What is the (preoperative) risk that a 54-year-old man, who smokes and is treated for hypertension and type two diabetes, and who had a heart attack four years ago, will die in the next month? |
| Step one: average risk of dying for a 54-year-old man is 1 in 2235. |
| Step two: estimate unchanged as no socioeconomic information. |
| Smoking, diabetes, blood pressure, cholesterol: estimate multiplied for smoking (1.5), Type 2 diabetes (2) and hypertension (1.5) = 2 x 1.5 x 1.5 = 4.5 in 2235. |
| Step four: estimate multiplied for previous heart attack (1.5) = 4.5 x 1.5 = 6.75 in 2235. |
| In other words, his approximate risk of dying in the next month is 1 in 330, and his approximate chance of survival is 329 in 330. |
Step five: the effect of surgery
In the preceding steps we have calculated the preoperative risk of dying per month, using a measure of fitness and eight other variables, or 12 variables and no fitness measurement. To calculate the postoperative risk of dying (in the month after surgery) we need to estimate what effect, if any, surgery has upon the risk of dying.
Because information is scarce for most operations, the risk estimate we calculate for dying in the month after surgery will be more uncertain than the estimate of the preoperative risk of dying. Most people feel worse for some time after surgery than they did before surgery. Similarly most people are probably more likely to die in the month after elective surgery than if they had not had surgery. Elective operations are performed to prolong life, and make it better, but these effects can only be detected when patients are followed up for longer than one month. How much surgery extends life and improves its quality remains unknown for most operations. Although longer-term quality of life has been assessed in some postoperative patients, particularly after operations for cancer, randomised controlled trials that can determine benefit and harm are largely confined to surgery for coronary artery disease.
The risk of dying is increased more by major surgery than by minor surgery. Major surgery includes operations on arteries and intra-abdominal and intrathoracic viscera. Postoperative inflammatory responses increase oxygen demand, acid production and blood coagulability. This response peaks about two days after surgery and, in uncomplicated cases, gradually diminishes over subsequent days and weeks. The risk of dying parallels these changes, although there are additional risks that may not parallel the postoperative inflammatory response, for instance drug administration errors and hospital-acquired infections. The risk of dying should be the same as being at home if the body’s physiological state is unchanged by surgery, as long as miscellaneous risks from being hospitalised are minimal. Indeed, home is not a risk-free environment and it is easy to imagine someone whose risk of dying may be less, while having elective surgery, than when pursuing their normal activities. On average the risk of dying will be unchanged by minor surgery, such as cystoscopy. The risk of dying increases most, about 12 times, in the month following open abdominal aortic aneurysm repair.45 Other major surgeries, such as anterior resections, may increase the risk about 5 times. The risk following elective knee or hip replacement may increase about 3 times.
Calculate the risk of dying in the month following surgery by multiplying the figure you have calculated (in Steps one to four) by the relative risk associated with the proposed surgery. It is possible that this risk estimation could be made more accurate by factoring in additional anaesthetic or surgical factors, and perhaps some residual patient factors, but it is unclear what factors to include and whether they increase or decrease the relative risk of surgery (see below).
Other scoring systems
The American College of Cardiology/American Heart Association (ACC/AHA) guideline on perioperative cardiovascular evaluation and care for noncardiac surgery references 12 scoring systems.46 I discuss this guideline in more detail in Chapter 5. The ACC/AHA guideline is extensive and well-referenced but it does not provide a template for calculating risk. It is primarily concerned with determining what perioperative interventions to use, such as beta-blockade and coronary artery bypass grafting, when and in whom. In this section I will concentrate on the risk score published in 1999 that the ACC/AHA recommends and that is currently most popular – the revised cardiac risk index (RCRI),47 a revision of the original Goldman score published 22 years previously.48
Revised Cardiac Risk Index (RCRI)
You could use the RCRI in addition to the risk calculation tool I have described. When you use the RCRI remember the following.
• The RCRI cannot be used to estimate preoperative risk – it is a tool for estimating postoperative risks. The RCRI was derived from a population older than 49 with planned admissions of at least two days.
• The RCRI cannot be used to estimate risk in populations having minor or moderate surgery.
• The RCRI cannot be used to estimate the risk of postoperative death – it is a tool for estimating the risk that a patient will experience one or more of four ‘major cardiac complications’: myocardial infarction (MI); complete heart block; ventricular fibrillation or primary cardiac arrest; pulmonary oedema.
• The RCRI estimates the risk of one of these outcomes occurring within five days of surgery and would estimate less well the risk during a longer period (such as a month).
As I have mentioned, the RCRI cannot be used to estimate the risk of dying: the RCRI was not designed to predict the two-thirds of the deaths (31/43) that the authors categorised as not associated with a ‘major cardiac complication’.
• The RCRI assigned the same risk – one point – to each factor. The authors reported that the odds ratios for the six factors ranged from 1.9 to 3.0 in the multivariate analysis. The authors justified using one point, instead of the odds ratios for each factor, because the areas under the receiver operating characteristic (ROC) curves were similar. There are two general problems. Comparison of the ROC curves of six factors cannot be relied upon to detect important differences between the two scoring systems. The second problem is that values of odds ratios (as opposed to risk ratios) are sensitive to the pretest probability: factors that affect the rate of postoperative complications but were not assessed by the authors (or could not be assessed by the authors). Odds ratios cannot be used for other patients unless the effects of these factors are the same, unlike risk ratios.
• The number of participants that contributed to the derivation and validation of the RCRI is far smaller than the populations used to calculate the preoperative risk sequence I have described (above). For instance the RCRI was developed from 108major cardiac complications that occurred in 92 patients in a surgical population of 4315 participants. The national life tables (www.gad.gov.uk) that form Step one in the risk calculation I have described used 1.72 million deaths that occurred over a three-year period (2004–6) in the UK population of 62.3 million.
Keeping in mind these limitations, the RCRI found that ‘major postoperative cardiac complications’ were associated with four preoperative factors:
• Ischaemic heart disease, defined as: previous MI (including Q waves on ECG), positive ECG exercise test, angina, GTN use.
• Heart failure, defined as: previous history, nocturnal dyspnoea, third heart sound gallop, bilateral crackles or CXR pulmonary oedema.
• Cerebrovascular disease, defined as: transient ischaemic attack or stroke.
• High-risk elective surgery, defined as: abdominal aortic aneurysm repair, intrathoracic surgery, intraperitoneal surgery.
Two other variables associated with major cardiac complications in the derivation cohort (2893 participants) were not associated with major cardiac complications in the validation cohort (1422 participants).
• Renal impairment, defined as creatinine concentration greater than 177µmol/L
• Insulin therapy for diabetes.
It is unclear whether one should use these two risk factors to estimate the postoperative risk of a major cardiac complication, but most subsequent researchers have applied the six derivation RCRI variables, not the four validation RCRI variables. The rate of postoperative major cardiac complications was associated with the number of risk factors. The complication rate was 1/200 for participants with no risk factor; 1/100 with one risk factor; 1/20 with two risk factors; 1/10 with more than two risk factors. If you want to use the RCRI you need to remember that this is a score for cardiac complications after major surgery.
Modified Cardiac Risk Index (MCRI)
The starting point for this 1986 score, like the RCRI, was Goldman’s original 1977 score and it was incorporated into the 1997 American College of Cardiology’s guideline for assessing and managing perioperative risk from coronary artery disease.49,50 The MCRI authors added some risk factors and removed others. The MCRI also changed the values assigned to risk factors common to the 1977 score, as the RCRI was to do 13 years later. The MCRI has similar shortcomings to the RCRI and uses a more complicated scoring system. One attractive aspect of the MCRI’s Bayesian methodology is that the risk is calculated by multiplying the pretest (average) probability for a postoperative complication by the MCRI score (or more exactly, the likelihood ratio). Unfortunately, ironically, the ‘pretest’ probability in the MCRI is not a preoperative probability. It cannot help the patient put the risk into context.
Customised Risk Index
This risk index used the RCRI as the starting point and was derived for patients undergoing vascular surgeries.51 This risk score was developed using total mortality within 30 days of surgery (153/2310) as the outcome, instead of cardiac complications, which I think is more useful. This scoring system identified similar mortality risk factors to the other risk indices, but gives more detail of the absolute and relative risks associated with different types of vascular surgeries, from carotid endarterectomy to ruptured aortic aneurysm.
Reducing the risk of dying
Reducing the relative operative mortality risk
Most research has tried to reduce the relative risk of a given operation by preoperative, intraoperative and postoperative monitoring, fluid and drugs. These interventions attempt to reduce the risk calculated in Step five. Although most research only measured survival up to one month following surgery, it seems reasonable to suppose that the measured reductions in mortality would have persisted. The preoperative assessment of risk, as I’ve described above, can help to identify which patients are more or less likely to benefit from such perioperative interventions.
Reducing the preoperative mortality risk
Reducing the relative risk of operations with intensive methods of risk-reduction uses critical care resources that are scarce and expensive, so they will only be used for the highest-risk cases. There are more low-risk than high-risk surgical patients. Although their individual risks of dying are lower, the total burden of postoperative low-risk death is substantial. Lives can be saved more often by making patients fitter before their operations. So what can one do to reduce preoperative and long-term risk? Long-term survival is increased mainly by reducing the risk of atherosclerotic ischaemic disease.
1. Stopping smoking
Preoperative risk is less for non-smokers, although it may take months or years before the risk of dying falls after stopping smoking.
2. Getting fitter
Fitter people live longer. Fitter people have lower blood pressure and lower cholesterol. People who exercise have less ‘sticky’ blood and are less stressed than people who do not.
3. Take drugs if you’re healthy
Drugs can further reduce blood coagulability, blood pressure and cholesterol, such as aspirin, ‘statins’, diuretics, beta-blockers, calcium-channel blockers and ACE (angiotensin converting enzyme) inhibitors. Survival is probably slightly prolonged in any population that takes these drugs. Prescription of these drugs has only traditionally been considered worthwhile in populations that have a risk of a cardiovascular event above 1 in 10 over the next 10 years (a cardiovascular event is stroke, acute coronary syndrome or death due to either). More recently a proposal has been made to prescribe a concoction of six drugs to everyone older than 54 years.
4. Take drugs if you’re unhealthy
People who have had strokes and acute coronary syndromes are much more likely to experience a(nother) cardiovascular event in the next 10 years than people who have not – which is why they are prescribed the drugs I’ve listed above. But kidney failure, heart failure and some cancers may also be made less likely by drugs (and fitness).
It is not clear how long these interventions – stopping smoking, exercise, drugs – take to reduce the preoperative risk of dying. After myocardial infarction (or other acute coronary syndromes) the risk of dying falls within days and is further reduced within days of starting protective drugs. But drugs further reduce risk (compared to placebo) over the following weeks and months. It makes sense to use as much time as is available preoperatively to get people fitter and to optimise their preoperative, long-term, survival in order to reduce postoperative mortality.
CONCLUSION
Postoperative risk of death and morbidity is most effectively prevented by reducing the preoperative risk of death and morbidity. Postoperative risk is best estimated by precisely calculating the preoperative risk, then multiplying by a factor that reflects the severity of the operation. Preoperative mortality risk is most accurately assessed by incorporating a measure of fitness either the ISWT or a CPX test.
Preoperative services can help primary care practitioners ensure that patients are offered the most effective current drug combination. The risk of dying will be least for patients who have had the longest preoperative time getting fitter, not smoking and taking the best drugs.
REFERENCES
1. J. Hippisley-Cox, C. Coupland, Y. Vinigradova, J. Robson, M. May and P. Brindle (2007). Derivation and validation of QRISK, a new cardiovascular disease risk score for the United Kingdom: prospective open cohort study. British Medical Journal 335: 136–48.
2. D.A. Alter, A. Chong, P.C. Austin, C. Mustard, K. Iron, J.I. Williams et al. (2006). Socioeconomic status and mortality after acute myocardial infarction. Annals of Internal Medicine 144: 82–93.
3. J. Myers, M. Prakash, V. Froelicher, S. Partington and J.E. Atwood (2002). Exercise capacity and mortality among men referred for exercise testing. New England Journal of Medicine 346: 793–801.
4. M. Gulati, H.R. Black, L.J. Shaw, M.F. Arnsdorf, C.N.B. Merz, M.S. Lauer et al. (2005). The prognostic value of a nomogram for exercise capacity in women. New England Journal of Medicine 353: 468–75.
5. S. Lai, A. Kaykha, T. Yamazaki, M. Goldstein, J.M. Spin, J. Myers et al. (2004). Treadmill scores in elderly men. Journal of the American College of Cardiology 43: 606–15.
6. T. Yamazaki, J. Myers and V.F. Froelicher (2004). Effect of age and end point on the prognostic value of the exercise test. Chest 125: 1920–8.
7. J.A. Laukkanen, S. Kuri, R. Salonen, R. Rauramaa and J.T. Salonen (2004). The predictive value of cardiorespiratory fitness for cardiovascular events in men with various risk profiles: a prospective population-based cohort study. European Heart Journal 25: 1428–37.
8. S. Mora, R.F. Redberg, Y. Cui, M.K. Whiteman, J.A. Flaws, A.R. Sharrett and R.S. Blumenthal (2003). Ability of exercise testing to predict cardiovascular and all-cause death in asymptomatic women. Journal of the Americal Medical Association 290: 1600–7.
9. M.K. Aktas, V. Ozduran, C.E. Pothier, R. Lang and M.S. Lauer (2004). Global risk scores and exercise testing for predicting all-cause mortality in a preventive medicine program. Journal of the Americal Medical Association 292: 1462–8.
10. M. Prakash, J. Myers, V.F. Froelicher, R. Marcus, D. Do, D. Kalisetti and J.E. Atwood (2001). Clinical exercise test predictors of all-cause mortality: Results from > 6,000 consecutive referred male patients. Chest 120: 1003–13.
11. S. Mora, R.F. Redberg, R. Sharrett and R.S. Blumenthal (2005). Enhanced risk assessment in asymptomatic individuals with exercise testing and Framingham risk scores. Circulation 112: 1566–72.
12. N.M. Byrne, A.P. Hills, G.R. Hunter, R.L. Weinsier and Y. Schutz (2005). Metabolic equivalent: one size does not fit all. Journal of Applied Physiology 99 1112–19.
13. S.J. Singh, M.D.L. Morgan, S. Scott, D. Walters and A.E. Hardmann (1992). The development of the shuttle walking test of disability in patients with chronic airways obstruction. Thorax 47: 1019–24.
14. F.J. Morales, A. Martínez, M. Méndez, A. Agarrado, F. Ortega, J. Fernández-Guerra et al. (1999). A shuttle walk test for assessment of functional capacity in chronic heart failure. American Heart Journal 138: 292–8.
15. M.E. Lewis, C. Newall, J.N. Townend, S.L. Hill and R.S. Bonner (2001). Incremental shuttle walk test in the assessment of patients for heart transplantation. Heart 86: 183–7.
16. T. Win, A. Jackson, A.M. Groves, L.D. Sharples, S.C. Charman and C.M. Laroche (2006). Comparison of shuttle walk with measured peak oxygen consumption in patients with operable lung cancer. Thorax 61: 57–60.
17. R.D. Hagan, T. Strathman, L. Strathman and L.R. Gettman (1980). Oxygen uptake and energy expenditure during horizontal treadmill running. Journal of Applied Physiology 49: 571–5.
18. R.C. Browning and R. Kram (2005). Energetic cost and preferred speed of walking in obese vs. normal weight women. Obesity Research 13: 891–9.
19. R.C. Browning, E.A. Baker, J.A. Herron and R. Kram (2006). Effects of obesity and sex on the energetic cost and preferred speed of walking. Journal of Applied Physiology 100: 390–8.
20. T. Shono, K. Fujishima, N. Hotta, T. Ogaki and K. Matsumoto (2001). Cardiorespiratory response to low-intensity walking in water and on land in elderly women. Journal of Physiological Anthropology and Applied Human Science 20: 269–74.
21. D. Malatesta, D. Simar, Y. Dauvilliers, R. Candau, F. Borrani, C. Préfaut and C. Caillaud (2003). Energy cost of walking and gait instability in healthy 65- and 80-yr-olds. Journal of Applied Physiology 95: 2248–56.
22. P.E. Martin, D.E. Rothstein and D.D. Larish (1992). Effects of age and physical activity status on the speed-aerobic demand relationship of walking. Journal of Applied Physiology 73: 200–6.
23. S.E. Turner, P.R. Eastwood, N.M. Cecins, D.R. Hillman and S.C. Jenkins (2004). Physiologic responses to incremental and self-paced exercise in COPD. Chest 126: 766–73.
24. M. Maeder, T. Wolber, R. Atefy, M. Gadza, P. Ammann, J. Myers et al. (2005). Impact of the exercise mode on exercise capacity: bicycle testing revisited. Chest 128: 2804–11.
25. H. Tsurugaya, H. Adachi, M. Kurabayashi, S. Ohshima and K. Taniguchi (2006). Prognostic impact of ventilatory efficiency in heart disease patients with preserved exercise tolerance. Circulation 70: 1332–6.
26. A. Koike, H. Itoh, M. Kato, H. Sawada, T. Aizawa, L.T. Fu and H. Watanabe (2001). Prognostic power of ventilatory responses during submaximal exercise in patients with chronic heart disease. Chest 121: 1581–8.
27. M. Robbins, G. Francis, F.J. Pashkow, C.E. Snader, K. Hoercher, J.B. Young et al. (1999). Ventilatory and heart rate responses to exercise: better predictors of heart failure mortality than peak oxygen consumption. Chest 100: 2411–17.
28. L.C. Davies, R. Wensel, P. Georgiadou, M. Cicoira, A.J.S. Coats, M. Piepoli et al. (2006). Enhanced prognostic value from cardiopulmonary exercise testing in chronic heart failure by non-linear analysis: oxygen uptake efficiency slope. European Heart Journal 27: 684–90.
29. U. Corrà, A. Mezzani, E. Bosimini and P. Giannuzzi (2004). Cardiopulmonary exercise testing and prognosis in chronic heart failure: a prognosticating algorithm for the individual patient. Chest 126: 942–50.
30. A.K. Gitt, K. Wasserman, C. Kilkowski, T. Kleemann, A. Kilkowski, M. Bangert et al. (2002). Exercise anaerobic threshold and ventilatory efficiency identify heart failure patients for high risk of early death. Circulation 106: 3079–84.
31. M. Guazzi, J. Myers and R. Arena (2005). Cardiopulmonary Exercise Testing in the clinical and prognostic assessment of diastolic heart failure. Journal of the American College of Cardiology 46: 1883–90.
32. T. Bilsel, S. Terzi, T. Akbulut, N. Sayar, G. Hobikoglu and K. Yesilcimen (2006). Abnormal heart rate recovery immediately after cardiopulmonary exercise testing in heart failure patients. International Heart Journal 47: 431–40.
33. P. Brindle, A. Beswick, T. Fahey and S. Ebrahim (2006). Accuracy and impact of risk assessment in the primary prevention of cardiovascular disease: a systematic review. Heart 92: 1752–9.
34. S.G. Wannamethee, A.G. Sharper and L. Lennon (2004). Cardiovascular disease incidence and mortality in older men with diabetes and in men with coronary heart disease. Heart 90: 1398–1403.
35. J.P. Empana, P. Ducimetière, D. Arveiler, J. Ferrières, A. Evans, J.B. Ruidavets et al. (2004). Are the Framingham and PROCAM coronary heart disease risk functions applicable to different European populations? The PRIME study. European Heart Journal 24: 1903–11.
36. P. Brindle, J. Emberson, F. Lampe, M. Walker, P. Whincup, T. Fahey et al. (2003). Predictive accuracy of the Framingham coronary risk score in British men: prospective cohort study. British Medical Journal 327: 1267–73.
37. R.M. Conroy, K. Pyörälä, A.P. Fitzgerald, S. Sans, A. Menotti, G. De Backer et al. (2003). Estimation of ten-year risk of fatal cardiovascular disease in Europe: the SCORE project. European Heart Journal 24: 987–1003.
38. F.C. Lampe, P.H. Whincup, S.G. Wannamethee, A.G. Shaper, M. Walker and S. Ebrahim (2001). The natural history of prevalent ischaemic heart disease in middle-aged men. European Heart Journal 21: 1052–62.
39. D.A. Alter, A. Chong, P.C. Austin, C. Mustard, K. Iron, J.I. Williams et al. (2006). Socioeconomic status and mortality after acute myocardial infarction. Annals of Internal Medicine 144: 82–93.
40. T.C. Clayton, J. Lubsen, S.J. Pocock, Z. Vókó, B-A. Kirwan, K.A.A. Fox et al. (2005). Risk score for predicting death, myocardial infarction, and stroke in patients with stable angina, based on a large randomised trial cohort of patients. British Medical Journal 331: 869–74.
41. H. Hemingway, A. McCallum, M. Shipley, K. Manderbacka, P. Martikainen and I. Keskimäki (2006). Incidence and prognostic implications of stable angina pectoris among women and men. Journal of the Americal Medical Association 295: 1404–11.
42. T.G. Clark, M.F.G. Murphy and P.M. Rothwell (2003). Long term risks of stroke, myocardial infarction, and vascular death in ‘low risk’ patients with a non-recent transient ischaemic attack. Journal of Neurology Neurosurgery and Psychiatry 74: 577–80.
43. P.E. Norman, J.W. Eikelboorn and G.J. Hankey (2004). Peripheral arterial disease: prognostic significance and prevention of atherothrombotic complications. Medical Journal of Australia 181: 150–4.
44. R.J. McManus, J. Mant, C.F.M. Meulendijks, R.A. Salter, H.M. Pattison, A.K. Roalfe et al. (2002). Comparison of estimates and calculations of risk of coronary heart disease by doctors and nurses using different calculation tools in general practice: cross sectional study. British Medical Journal 324: 459–64.
45. J. Carlisle and M. Swart (2007). Mid-term survival after elective abdominal aortic aneurysm surgery predicted by cardiopulmonary exercise testing. British Journal of Surgery 94: 966–9.
46. L.A. Fleisher, J.A. Beckman, K.A. Brown, H. Calkins, E. Chaikof, K.E. Fleischmann et al. (2007). ACC/AHA 2007 guidelines on perioperative cardiovascular evaluation and care for noncardiac surgery: a report of the American College of Cardiology/American Heart Association task force on practice guidelines. Journal of the American College of Cardiology 50: 159–241.
47. T.H. Lee, E.R. Marcantonio, C.M. Mangione, E.J. Thomas, C.A. Polanczyk, E.F. Cook et al. (1999). Derivation and prospective validation of a simple index for prediction of cardiac risk of major noncardiac surgery. Circulation 100: 1043–9.
48. L. Goldman, D.L. Caldera, S.R. Nussbaum, F.S. Southwick, D. Krogstad, B. Murray et al. (1977). Multifactorial index of cardiac risk in noncardiac surgical procedures. New England Journal of Medicine 297: 845–50.
49. A.S. Detsky, H.B. Abrams, J.R. McLaughlin, D.J. Drucker, Z. Sasson, N. Johnston et al. (1986). Predicting cardiac complications in patients undergoing non-cardiac surgery. Journal of General Internal Medicine 1: 211–19.
50. American College of Physicians (1997). Guidelines for assessing and managing the perioperative risk from coronary artery disease associated with major noncardiac surgery. Annals of Internal Medicine 127: 309–12.
51. M.D. Kertai, E. Boersma, J. Klein, H. van Urk and D. Poldermans (2005). Optimizing the prediction of perioperative mortality in vascular surgery by using a customized probability model. Archives of Internal Medicine 165: 898–904.
FURTHER READING
Communicating risks: illusion or truth? British Medical Journal 327 (2003), themed issue 7417.
G. Gigerenzer (2003). Reckoning with Risk: Learning to Live with Uncertainty (London: Penguin).
J. A. Paulos (2001). Innumeracy: Mathematical Illiteracy and its Consequences, 1st edn (New York, NY: Hill and Wang).
P. Older and A. Hall (2002). Preoperative assessment of elderly surgical patients. (In K. Wasserman (ed.), Cardiopulmonary Exercise Testing and Cardiovascular Health. Armonk, NY: Futura Publishing Company.)
P. Older and A. Hall (2003). Myocardial ischemia or cardiac failure: Which constitutes the major perioperative risk? (In J.-L.Vincent (ed.), Year Book of Critical Care and Emergency Medicine. Berlin, Heidelberg, New York: Springer-Verlag.)
P. Older and A. Hall (2007). The role of cardiopulmonary exercise testing in preoperative evaluation of surgical patients. (In Recent Advances in Anaesthesia and Intensive Care 24 Cambridge: Cambridge University Press.)
Related posts:
 The evolving role of the preoperative assessment team Liz Kenny
Developing a competency framework for preoperative assessment Hilary Walsgrove
Audit and evaluation of a perioperative service Ciaran Hurley
The evolving role of the preoperative assessment team Liz Kenny
Developing a competency framework for preoperative assessment Hilary Walsgrove
Audit and evaluation of a perioperative service Ciaran Hurley
 Preoperative pharmacological optimisation Jonathan Thompson and Simon P. Young
 The role of haematology in preoperative assessment Andrew Blann
 Preoperative testing and perioperative management of endocrine and renal disease Sudarshan Ramachandran, David Kennedy and Munirul Haque
Stay updated, free articles. Join our Telegram channel

Full access? Get Clinical Tree


