Fig. 40.1
Lewis Sheiner’Visionary Pharmacologist (1940–2004)
Shafer started closer to San Francisco, enrolling in Stanford Medical School in 1978. In his last year at Stanford, Shafer worked with Stanski, a previous Sheiner fellow, who was building a program in anesthetic pharmacology. Here are the stories of people’exemplars’who changed the world of anesthetic-related pharmacokinetics and pharmacodynamics.
Sheiner trained in internal medicine but never did much clinical work. Following his residency he went to the NIH to study Clinical Pharmacology, focusing on computer programs to individualize the dosing of warfarin [1]. In the late 1960s, computers were expensive, and programs were tediously assembled with punched cards that the computer could read. Applying this cumbersome technology to individualize dosing was a radical concept: it seemed too expensive and difficult to be practical. It was but one of Sheiner’s visions.
Soon after arriving at UCSF, Sheiner developed a collaboration with Barr Rosenberg, economics professor at Berkeley and the entrepreneur founding Rosenberg mutual funds. Rosenberg told Sheiner that the econometrics community used sophisticated techniques to address problems inherent in issues such as warfarin dosing. Sheiner, Rosenberg and Ken Melmon (one of the founders of clinical pharmacology) proposed a general mathematical framework for optimizing drug dosage [2]. Sheiner’s mother encountered problems with regular digoxin overdosing or underdosing, prompting his early study of computer aided digoxin delivery [3].
The “Population Principle”
Such modeling led to Sheiner’s most important contribution, application of the “population principle” to pharmacology. According to the population principle, the behavior of drugs in individuals can be accurately predicted based on knowledge about how drugs behave in a population of patients with similar characteristics. The population principle defined drug behavior using “mixed effect” models combining the roles of “fixed effects” (e.g., dose, weight, height, age, gender), and the roles of “random effects” (things like the unexplained person-to-person differences in clearance, volume of distribution, or sensitivity to a drug) to explain drug behavior (pharmacodynamics). Further, the population principle separated the components of variability into those between individuals (interindividual variability, such as differences in clearance, which account for individual response to drugs) and those within an individual (intraindividual variability, such as assay noise). The aim was to predict drug effect as precisely as possible, taking known variables such as weight, height, gender, age, and other patient factors (e.g., genetics), to accurately predict the pharmacokinetic and pharmacodynamic factors controlling the response to a drug, factors such as clearance, volume of distribution, and potency. Thus, measurement of the right fixed effects should allow prediction of the response to a drug accurately, reducing the previously unexplained subject-to-subject variability. Reduction of residual inter-individual variability, things like assay noise, would require more precise measurements and perhaps refinement of models to more accurately describe the underlying biology.
Sheiner described the population principle in 1977 [4]. One of his insights was that pharmacokinetics in a population of patients could be estimated from routine clinical data. Sheiner’s methods allowed the design of more efficient and informative clinical trials, optimizing dosing recommendations, and, via empirical Bayesian methods, optimizing individual therapy. The work transformed clinical pharmacology [5], the pharmaceutical industry [6,7], and drug regulation [8].
A Fortuitous Bus Ride
Sheiner needed a statistician to develop his ideas, and a programmer to create software that would convert his concepts into research tools. In 1976, while riding on the UCSF commuter bus to Marin County, he fortuitously sat next to Stuart Beal (Fig. 40.2), an aspiring statistician recently recruited to UCSF. Sheiner explained his ideas, piquing Beal’s interest. A friendship and collaboration began that day and lasted a lifetime.
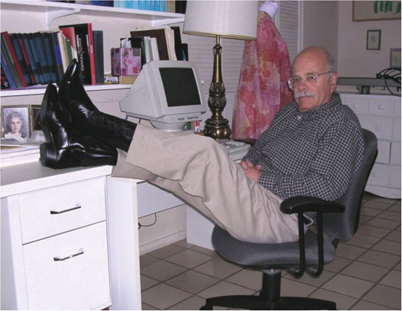
Fig. 40.2
Stuart Beal’Creator of NONMEM (1941–2006)
Beal expanded on Rosenberg’s concepts for dose individualization [9], leading to his developing the statistical basis for mixed-effects modeling. Beal also wrote the program NONMEM, an acronym for non-linear mixed effects modeling. It is arguably the greatest intellectual advance in the history of clinical pharmacology. NONMEM’s methodology opened the “population principle” of drug behavior to clinical pharmacologists, and became the standard modeling technique for the pharmaceutical industry. In the 1980s, Sheiner and Beal validated NONMEM against other popular approaches [10–12]. NONMEM outperformed those approaches.
In 1989, Ted Grasela approached Sheiner with a problem. Someone had sampled blood to determine theophylline concentration in neonates given theophylline to prevent apnea of prematurity. Each patient supplied a few samples. Grasela asked if a pharmacokinetic analysis could be done with such sparse sampling (compared to the standard of 10 samples or more). Sheiner realized that mixed-effects methods could be applied to Grasela’s problem: the pharmacokinetic characteristics could be determined with a sufficient number of subjects (i.e., trading fewer samples per subjects for more subjects). The analysis succeeded [13], spawning a new approach to assessing population pharmacokinetics: study many subjects (thereby learning more about the population) but obtain few samples per patient (still learning about individual characteristics because of the large number of samples). This approach is known as sparse sampling coupled with population (mixed-effects) methods.
The “Effect Compartment”
Another novel Sheiner concept was mathematical modeling of the “effect compartment” in the context of a pharmacokinetic model. Clinicians have always known that a delay exists between drug dosing and drug effect. In 1960, Price described the time delay between thiopental concentration and drug effect [14]. Eger also provided insight into this delay or “hysteresis” for inhaled anesthetics [15]. However, this work did not link the delay to a pharmacokinetic model of the plasma drug concentration.
Stanski came to UCSF from his anesthesia residency at Massachusetts General Hospital. He wanted to develop a model explaining the delay between administration of a muscle relaxant and the resulting muscle paralysis. Immediately after receipt of a bolus dose, the plasma concentration of the muscle relaxant is at its highest concentration, but there is no drug effect. Over time the plasma concentration steadily decreases, and the level of muscle relaxation (“twitch depression”) rises, reaches a maximum, and then recedes. This leads to the curious situation where there are two different plasma concentrations associated with the same twitch: one observed while the drug effect was increasing, and the other while the effect was decreasing. How could markedly different concentrations produce the same twitch depression?
Sheiner argued that the relevant concentration is the one at the neuromuscular junction (Sheiner chose the general term “effect site”). He linked it to the plasma concentration by simple “first order” diffusion down the concentration gradient. Sheiner and Stanski introduced the concept of the effect site” in a manuscript describing the time course of d-tubocurarine [16]. It became Stanski’s most cited manuscript. Interestingly, using the same principle of first order diffusion down the concentration gradient, Chris Hull, a British anesthesiologist in Newcastle, UK, developed an effect compartment model for pancuronium [17]. Although Hull’s publication preceded Sheiner’s, Hull did little to popularize his work, and the Sheiner-Stanski contribution is considered pivotal.
Sheiner’s Legacies
Sheiner pursued other issues: nonparametric approaches making minimal assumptions [18], therapeutic drug monitoring [19], how to handle missing dose data [20], and modeling drug compliance [21,22]. He was a formidable intellect engaging anyone having interesting questions. He loved data. He was never just the visionary. Sheiner formatted the data, wrote NONMEM control streams, fitted the data to models, created the graphs, and analyzed the outputs. Fisher or Shafer would call Sheiner with a question, and his answer was often “Let me see the data, and I’ll get back to you.” He rarely looked anything up in books. It might be faster, but if he forced himself to do the derivation, he would then understand it better. Besides, it was more fun.
Sheiner mentored more than a generation of investigators and clinical pharmacologists. Most clinical pharmacology papers continue to reflect his work. He mentored Carl Peck, former Director of the FDA Center for Drug Evaluation and Research which incorporated Sheiner’s concepts into FDA work. Sheiner was Stanski’s mentor and greatest friend. He mentored Fisher whose papers in the 1990s benefited from Sheiner’s insights.
Beal’s education at UCLA included a BA degree in mathematics with a minor in Logic and Fine Arts, and MS and PhD degrees in biostatistics. He started at UCSF in 1973 as a Senior Statistician in the Office of Information Systems, joining the faculty in 1976, the year of his bus ride with Sheiner.
Sheiner was the front man’meeting people, giving lectures, looking for good questions and informative data, and raising new ideas. Beal was the implementer, the developer of statistics, translating Sheiner’s grand ideas into NONMEM. NONMEM was Beal’s life. He created new methods in NONMEM to handle the challenges raised by Sheiner and others. NONMEM came to encompass all of statistics to Beal.
In 2001, Shafer asked Beal how to perform a repeated measures ANOVA. Not trained as a statistician, Shafer had no idea about the “right” way to approach it, but had coded the problem using NONMEM. Beal laughed. Like Shafer, he could perform a repeated measures ANOVA using NONMEM, but had forgotten how to do it with conventional approaches. Indeed, Beal used NONMEM for t-tests. That conversation speaks volumes about NONMEM’s versatility. Why use anything else, if NONMEM can provide any statistical test?
Beal and Sheiner offered NONMEM for a modest user fee to colleagues in academia and industry. If you didn’t renew your license, then Beal (yes, the same Beal who developed the code) would personally call and ask you to return your magnetic tape or, once that was obsolete, the floppy disks. A week later you got another call, again from Beal.
Sheiner’s colleague, Malcolm Rowland, thought that making NONMEM available inexpensively was a terrible idea: if Sheiner and Beal didn’t make NONMEM profitable, then there would be no posthumous support structure for NONMEM. Eventually Sheiner and Beal accepted Rowland’s wisdom and turned over NONMEM distribution to Globomax (now ICON Development Systems). Rowland’s suggestion proved prescient. Despite Sheiner’s and Beal’s premature deaths, NONMEM has grown in popularity, usability, and statistical power.
Beal and Shafer’A Relationship Built on Questioning
Although many found Beal to be distant and reserved, he and Shafer were unusually close. Their friendship grew from a 1990s disagreement about modeling. Shafer, whose research was in target controlled drug delivery, had numerous reservations about NONMEM. NONMEM could not be used for TCI, which required changing infusion rate every 10 seconds. Shafer had modeled all patients’ responses simultaneously, ignoring inter-subject variability [23]. Beal dismissed the approach as “naïve” but allowed Shafer to deluge him with data, graphs, and analyses. Eventually Beal agreed that the naïve approach had merits, and was sometimes powerful. In the process, Beal showed Shafer how data settle scientific debates. Beal’s patient mentorship led to Shafer’s interest in the role of data in evidential reasoning [24]. Their relationship is evident in a letter Shafer sent to Beal in January, 1995:
“I’m a physician with no formal training in mathematics or statistics. My role in clinical pharmacology is to bring the tools developed by your group to bear on questions important to me as a clinician. Your mentoring has allowed me to perform my work at a more sophisticated level than would otherwise be possible.
“Mentoring takes time and patience, and God knows I’ve sorely tested your store of each. You have been patient with me, careful in your explanations, and considerate of my lack of formal training in mathematics and statistics. With your permission, I’ll continue to pester you with problems, bother you with bugs, quiz you with questions, and irritate you with irreverent e-mail.”
Epilogue to Lewis Sheiner and Stuart Beal
In 2004, Sheiner had a heart attack on a train from Basel Switzerland. He had just received the Rawls Palmer award at the American Society of Clinical Pharmacology and Therapeutics meeting. He was resuscitated but never regained consciousness, dying several days later.
Two years later, without his friend, collaborator, and soul mate, Beal completed his testing and validation of NONMEM VI. He sent it to Globomax with the enigmatic comment that it was nearly done, and that it could be released even without a final OK. A few days later he died.
Sheiner and Beal invented concepts, methodologies, and tools that changed how we understand therapeutics. Every drug is dosed a little better because of their work.
Dennis Fisher and the UCSF group
Fisher (Fig. 40.3) arrived in San Francisco in 1980, his interests quickly attracting him to Sheiner’s circle. A pediatric anesthesiologist, Fisher initially studied pharmacokinetics and pharmacodynamics of muscle relaxants and intravenous anesthetic drugs in children, infants, and neonates. He developed a model describing the kinetics of drugs like atracurium that were degraded in plasma [25]. Burroughs Wellcome (now GSK) repeatedly challenged the model without explaining their rationale. Their stance galled Fisher because they adopted a similar model for cisatracurium, and claimed that they developed the model [26].
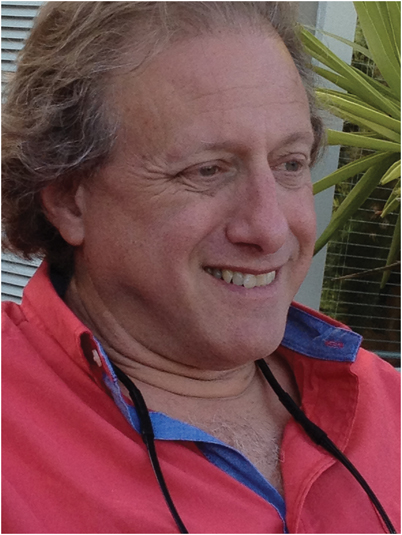
Fig. 40.3
Dennis Fisher. (Courtesy of the author)
Francois Donati obtained simultaneous measurements of twitch depression at the thumb (adductor pollicis) and the laryngeal muscles, leading Fisher to a remarkable insight: with two different rates of onset, both driven by the same plasma drug concentrations, he could estimate the relative potency of the two drugs, and the rate of plasma-effect site equilibration for each with no measurement of plasma concentrations. The manuscript [27] prompted a suggestion by “an anonymous reviewer” (Shafer) to validate the model by repeating the study with plasma sampling and computing the outcome with and without those data. Fisher did, the results confirming his thesis [28].
Fisher presently evaluates many new drugs, most having nothing to do with anesthesia. His software, PLT Tools (in which Shafer also has a commercial interest) provides a powerful environment for harnessing NONMEM. Fisher and Shafer have now taught several hundred pharmaceutical scientists how to model their data with NONMEM. Through his teaching, and development of PLT Tools, Fisher continues the tradition of teaching, innovation, and service to pharmaceutical development that characterized Lew Sheiner.
Anesthesia and Brainwave Pioneers
The EEG has long been used to measure anesthetic effect. In 1875, Caton observed electrical activity in the scalp of rabbits, and found that the currents on one side of the head were influenced by light stimulation of the contralateral retina, suggesting the brain as a site of action [29]. Fifteen years later, Fleischl von Marxow demonstrated that chloroform extinguished the scalp electrical activity that Caton reported [30], confirming that the brain itself was the source of this activity. In the early 1930s, advances in amplification and recording allowed Berger to quantify EEG responses to chloroform-induced changes in consciousness [31]. In 1937, Gibbs observed that anesthetics changed the EEG from a low-voltage high-frequency pattern to a high-voltage, low frequency pattern, suggesting that the EEG could be used to measure the state of anesthesia [32]. In the late 1940s, Bickford at the Mayo clinic demonstrated the EEG effects of nitrous oxide [33]. In 1952, Faulconer correlated the arterial blood concentration of diethyl ether with specific EEG patterns, showing that the EEG responded predictably to a specific anesthetic [34]. Then as today, the finding was controversial. For example Galla and colleagues examined raw EEG signals for 43 patients and found a discrepancy between the clinical signs of anesthetic depth and the concurrent EEG [35]. Martin, Faulkoner, and Bickford, later demonstrated the classic biphasic response of the EEG to sedative/anesthetic drugs [36]. Bickford continued his work for nearly 50 years, publishing his last paper in 1992.
The microcomputer revolution of the 1970s allowed numerous investigators to attempt to link the EEG with anesthesia effect. For example, Levy and colleagues tried to correlate anesthesia drug concentrations with EEG at 50% (median frequency) or 95% (spectral edge) of wave activity, and concluded that the behavior of the EEG prevented any single number from describing the anesthetic state [37,38]. What wise men! Drummond and colleagues calculated median frequency, spectral edge frequency, a frequency band power ratio, total power, and dominance shift during states of patient arousal during anesthesia [39], and concluded that none of these descriptors reliably predicted imminent arousal. But Long and coworkers undertook a similar analysis, and found that an abrupt decrease in delta EEG power always presaged arousal [40]. Dwyer and colleagues found no difference in the EEG power spectrum between patients anesthetized with isoflurane who moved on incision and those who didn’t move [41]. What these investigators did not appreciate is that different drugs used to produce the anesthetic state produce different effects on the EEG. Stanski sorted out that riddle.
Don Stanski
After Stanski (Fig. 40.4) completed his fellowship training with Sheiner, Phil Larson recruited him to Stanford University to continue Stanford’s program in clinical pharmacology, a program founded by William Forrest, Ellis Cohen, and Ty Smith. With Ed Meathe, Stanski used EEG algorithms developed by Ira Rampil [42] to calculate the “spectral edge” [43] of the EEG response to thiopental. Stanski sent his EEG recordings following thiopental administration to engineer Meathe at UCSD, who calculated the spectral edge using Rampil’s algorithm and returned the results to Stanski [44]. Stanski linked the EEG response to the effect site, the concept he developed at UCSF, to provide an integrated pharmacokinetic-pharmacodynamic model of thiopental [45].His work disproved Dundee’s 1950s claim that there was acute tolerance to thiopental [46] and showed that elderly brains are more sensitive to thiopental because of a change in pharmacokinetics, not because of a greater sensitivity to thiopental [47].
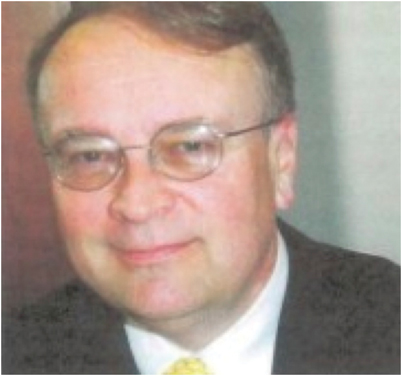
Fig. 40.4
Donald Stanski
Stanski’s success with the 95% spectral edge as a measure of thiopental drug effect was essential to his goal of creating integrated pharmacokinetic/pharmacodynamic models of intravenous anesthetic drugs. However, relying on UCSD to analyze his EEG recordings presented a significant logistical bottleneck. Shafer met Stanski in 1982, a year before Shafer completed medical school. Stanski needed a local programmer, and with help from Stanford Research Institute, Shafer wrote Fortran programs to digitize analog EEG data and calculate the 95% Spectral Edge. Stanski moved the EEG analysis to Stanford, and used Shafer’s software for his subsequent studies on thiopental, benzodiazepines, and intravenous opioids. Stanski paid Shafer the munificent sum of US$ 1,000 at the end of the year for his contribution.
Stanford and “Ratsicles”
Stanski’s work eventually provided integrated pharmacokinetic/pharmacodynamic models for thiopental [48,49], fentanyl and alfentanil [50,51], sufentanil [52], etomidate [53], ketamine [54], and midazolam [55,56]. Stanski’s papers “hit” while Shafer pursued his residency (1984–1986) at the University of Pennsylvania. The papers garnered attention and befuddlement. Shafer was asked: “Do you know Stanski? Do you understand this effect site stuff?” Shafer answered “Yes” and “Maybe”. Stanski recruited Shafer back to Stanford after residency, seducing him with visions of an academic career in computerized delivery of intravenous anesthetics.
Over the next six years, Stanski’s laboratory became a center for clinical pharmacology in anesthesia. Stanski thought that defining the flow of drug to individual tissues could provide insights into the physical processes underlying common empiric pharmacokinetic models. He injected thiopental into rats, injected microspheres to identify regional blood flow then dropped the rats into liquid nitrogen. He dissected the tissues, counted microspheres, and assayed tissue concentrations of thiopental in twelve tissues from the frozen “ratsicle”. From these he constructed detailed physiologic models of drug behavior [57]. It was a colossal effort with a small return on investment. These mathematically complex, detailed models did not provide more insight than simple empiric models consisting of 2 or 3 compartments linked by first-order drug transfer [58].
G187084B Becomes Remifentanil
Stanski’s vision, partly implemented by Shafer, was that modeling and simulation could change drug development. In 1992, fortunate coincidences led Stanski, with Shafer in tow, to a paradigm changing experiment. Glaxo Pharmaceuticals had a new “ultra-fast” opioid, GI87084B, later known as remifentanil. They recruited one of Sheiner’s former fellows, Keith Muir, to lead the remifentanil development program. Muir was well versed in pharmacokinetic and pharmacodynamic modeling. In preparing for his job interview, Muir read a paper by Shafer and Varvel summarizing the pharmacokinetic and pharmacodynamic parameters determined by Stanski for fentanyl, alfentanil, and sufentanil [59]. Muir took the modeling and data from the paper, and proposed to Glaxo that they use the EEG to guide the clinical development program for GI87084B. Fortunately, the FDA assigned Dan Spyker as the medical reviewer for GI87084B. Spyker was a toxicologist, but his PhD in electrical engineering probably drove his abiding interest in pharmacokinetic and pharmacodynamic modeling. He had formed a business, Cedar Systems, in the 1980s to develop software to model drug behavior. Spyker was convinced that Muir’s concept was sound. He also thought it was a revolutionary paradigm change. Muir then contacted Stanski and Shafer with a proposal: use the fentanyl, alfentanil, and sufentanil work as a template for studies of remifentanil, And use those results to simulate how the drug should be used clinically. Stanski and Shafer jumped at the opportunity.
Three Stanford fellows were assigned to the project: Talmage Egan, Charles Minto, and Thomas Schnider. Together they produced the highest resolution pharmacokinetic/pharmacodynamic model that had been created for an intravenous anesthetic [60,61]. They then applied the pharmacokinetics in simulations showing what to expect clinically with remifentanil [62]. These simulations reproduced the concentrations associated with different opioid effects, and provided precise guidance for clinical use.
The experiment worked. There were no failed clinical trials in the remifentanil development program, because the doses, based on simulation, were correct in every trial. The FDA approved the drug a mere 4 years after the patent was granted, a record for a drug not on a fast track (e.g., HIV therapy). And, most critically, it set an example of how modeling and simulation could create a “fingerprint” of a new pharmaceutical [63], resulting in safer, faster, and less expensive clinical development. It was the first demonstration of Sheiner’s vision.
In retrospect, remifentanil was an “easy” demonstration. Remifentanil followed fentanyl, alfentanil, and sufentanil. For each of those opioids the EEG, a surrogate marker of effect, had already been mapped to clinical concentrations. Few other drug classes have such a clear relationship between a surrogate effect (EEG) readily measured in volunteers and the clinical effects.
Stanski Applies Sheiner’s Vision
Stanski wanted to see if Sheiner’s concepts could be more broadly applied. He left Stanford in late 1998 to work at Pharsight Corporation. Pharsight was founded to improve drug development using modeling. Stanski, Shafer, Fisher, and Sheiner were all involved in its early evolution. At Pharsight, Stanski directed a team applying modeling and simulation to drug development. Pharsight made some inroads in the area, but biological challenges (the difficulty of finding useful surrogate effects) combined with decreased FDA enthusiasm for modeling and simulation limited the implementation of Sheiner’s vision. Stanski then went to the Commissioner’s Office at the FDA to help them apply the kinetic/dynamic modeling skills developed at Stanford. In 2005 Stanski left the FDA for a position at Novartis Corporation where he built a team of approximately 80 clinical pharmacologists and modeling scientists. The concepts of quantitative drug development initially advanced by Sheiner and Beal, and refined for nearly 20 years at Stanford by Stanski, are being used today to develop new pharmaceuticals for human diseases. This is the wholesale application of Sheiner’s vision to drug development: multiple programs, ranging from pre-clinical to post-approval, all guided by mathematical models of pharmacokinetics and pharmacodynamics, with specific incorporation of patient covariates and models of intersubject and intrasubject variability. The whole shebang. And it works! In 2011, Stanski was awarded the first Sheiner-Beal Pharmacometrics Award by the American Society of Clinical Pharmacology and Therapeutics.
Stanski is not a mathematician, statistician, modeler, or computer programmer. He has no intuition with equations. Basic statistical concepts do not come naturally. He never programmed a computer or wrote an Excel macro, although he did run an early version of NONMEM using punch cards. Stanski is a visionary. He knows what the tools do, and can match the tools to important questions. He doesn’t need to model drug data. There are propeller heads like Shafer for that. Sheiner said it best, when introducing Stanski for the Rawls Palmer award in 1998: “I would rather hear a good question from Don, than a good answer from anyone else.”
Stanski was Shafer’s primary mentor, a lifetime relationship beginning nearly 30 years ago. Although Stanski is widely recognized for his scientific achievements, Shafer regards mentorship as Stanski’s greatest talent. Stanski mentored dozens of fellows, most having gone on to academic and scientific careers. Shafer regularly gives talks on mentorship. They are always dedicated to Stanski.
Helmut Schwilden and Colleagues
It is easy to compute the infusion rate required to maintain a constant concentration for drugs described by one compartment models: it is the target concentration times the clearance. However, by the late 1960s it was clear that one compartment models describe few, if any, drugs. Distribution of drugs between central and peripheral compartments influences the accumulation of drug in the peripheral compartment and thereby affects the infusion rate required to sustain a constant effect. In 1968, Krüger-Thiemer described the mathematics required to maintain a steady drug concentration for drugs described by more than one compartment [64]. However, the calculations were intractably difficult, and in 1968 nobody envisioned microprocessors. More than a decade passed before implementation of Krüger-Thiemer’s methodology.
Helmut Schwilden (Fig. 40.5) was a physicist who became an anesthesiologist. In the late 1970s, while Sheiner developed mixed-effects modeling and Stanski, modeled plasma-effect site relationships, Schwilden applied mathematics to instantly achieve and then maintain a constant drug concentration in the plasma.
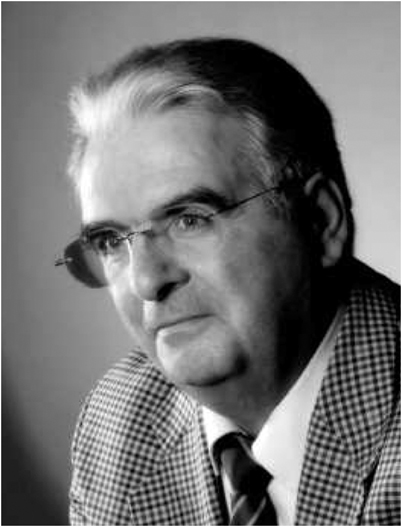
Fig. 40.5
Helmut Schwilden
The Beginnings of TCI
Schwilden published histour du force in 1981 [65]. To implement the Krüger-Thiemer equations required a bolus injection of drug to nearly instantly achieve the desired plasma concentration, followed by an infusion that changed in rate every few seconds to maintain a constant concentration by replacing the drug that left the plasma. Schwilden’s team built CATIA, Computer Assisted Titration of Intravenous Anesthesia [66], the first “Target Controlled Infusion” or “TCI” device. In the 30 years since TCI has become a standard technique to administer intravenous anesthetics worldwide, except in the US.
In the early 1980s, Max Ausems, a junior member of the faculty at Leiden University, created a new implementation of CATIA, “Titration of Intravenous Agents by Computer” or “TIAC” [67]. Ausems proved the accuracy of TIAC delivery of alfentanil [68] in human trials. He then used TIAC to “lock” the plasma alfentanil at a target concentration, and measured the effect of various alfentanil concentrations, thereby establishing concentration vs. response curves in the presence of various stimuli, and for spontaneous ventilation [69]. This pioneering work led to the development of TCI as a method of rapidly achieving a titratable steady state for understanding concentration vs. response relationships for intravenous drugs. It also led to a host of other “home-grown” TCI systems, only two of which are still in use: STANPUMP, developed by Shafer, and RUGLOOP (which was derived from STANPUMP), developed by Struys and De Smet [70].
The EEG and Feedback Control
Schwilden believed that such devices incompletely achieved the correct concentration in each patient. Adding the EEG would supply a continuous measure of drug effect that could be used to fine-tune drug delivery. Of course, there was precedent for this work. Bickford had implemented an EEG based closed loop system for anesthesia in 1950 [71], and Bellville followed suit in 1957 [72]. In 1962, Eger produced a constant EEG anesthetic level (burst suppression) in patients by adjusting and measuring the rate of an intravenous infusion of a 5% solution of ether [73]. Thus he combined a servo (human) titration of the level of anesthesia (pharmacodynamics) with an assessment of uptake (pharmacokinetics).
Schwilden improved on these pioneering efforts, concluding that the median frequency contained the information needed to control an infusion pump [74]. In 1987, he developed a pioneering closed-loop feedback system, using the EEG to titrate methohexital [75]. While many question whether the EEG means anything during clinical anesthesia, two decades ago Helmut Schwilden demonstrated that the EEG alone could be used to successfully guide methohexital anesthesia, convincingly answering the question.
Schwilden was not only a visionary, he was an international ambassador for using mathematics (i.e., computers) to control the delivery of anesthetic drugs. Schwilden ushered in the field in 1981, built the first devices, and demonstrated that they worked. He gave brilliant, insightful, and stimulating lectures. But he showed frustration at the pace of development. He had developed and implemented the mathematical framework for fundamental principles of anesthetic drug delivery. However, it was not until 1995, that TCI became commercially available in Europe. It is now popular worldwide, although it remains unavailable in the US. But the capacity of the EEG to guide anesthesia remains controversial, and closed-loop intravenous anesthesia delivery systems may never appear despite Schwilden’s demonstration in the 1980s, and the pioneering demonstrations by Bickford [66] and Bellville [67] more than 50 years ago.
Paul White
While Don Stanski mentored Steve Shafer, Paul White mentored Shafer’s wife, Audrey Shafer. Following residency, the Shafer’s returned to Stanford as post-doctoral fellows. In her fellowship years with White, Audrey Shafer studied a novel drug, propofol, that ICI Pharmaceuticals thought would be a suitable replacement for thiopental. ICI sought FDA approval for induction of anesthesia, but White had other ideas. In his view, propofol should also be infused to maintain anesthesia. ICI begrudgingly supported this research, which Audrey Shafer assumed as her fellowship project. Her resulting paper on the pharmacokinetics and pharmacodynamics of propofol [76] was the first definitive manuscript on propofol pharmacology.
Three Laboratories
Laboratories, like individuals, have a trajectory and a lifespan. To illustrate the history we provide an admittedly parochial description of three US laboratories contributing mightily to our understanding of the pharmacokinetics and pharmacodynamics of intravenous drugs. These three laboratories were populated by groups that we knew personally, and their selection does not mean that teams of investigators from other institutions (e.g., Emory University, Harvard University, University of Bonn, and the University of Leiden) made lesser contributions.
The Stanford Group
In the 1980s Stanski recruited fellows and investigators to characterize the clinical pharmacology of intravenous anesthetics. By 1986, Shafer, Pierre Maitre and Michael Buhrer from Switzerland, and Bill Ebling, a PhD from Buffalo, New York had joined the laboratory. Maitre was an “expert” in NONMEM by virtue of getting the program to run [77], a superhuman task in 1987. Buhrer studied benzodiazepine effects on the EEG [51,52].
Stanski had a pleasant surprise for Shafer upon his arrival in 1986. While at the University of Alabama, Jerry Reves developed “computer assisted continuous infusion” or “CACI” [78]. Now at Duke University, Reves had joined with a young engineer, Jim Jacobs, to create CACI II [79]. Reves sent Stanski the software and Shafer was directed to test the CACI II device on patients. However, uncertain about the workings of the program, Shafer first tested the CACI II software. The resulting report [80] described numerous problems in the CACI II software, and Shafer was apprehensive about submitting such a critical manuscript for publication. Larry Saidman, Editor-in-Chief ofAnesthesiology, asked Reves to review the submission. Reves was understandably annoyed by Shafer’s criticisms but supported publication, feeling that development of computer controlled anesthetic delivery demanded rigorous evaluation of software. In a rapprochement, Reves, Peter Glass (then a fellow at Duke), and Jacobs spent two days with the Stanford team in Palo Alto. Fellowship mixed with rigorous science, and Shafer found lasting soul mates in Jacobs (someone who loved programming and mathematics), and Glass (an avid clinical investigator).
Related posts:
 History Reflected in the Evolving Approaches to Anesthesia for a Patient Undergoing Cholecystectomy
A History of Intravenous Anesthesia
History Reflected in the Evolving Approaches to Anesthesia for a Patient Undergoing Cholecystectomy
A History of Intravenous Anesthesia
 Major Anesthesia-Related Events in the 2000s and Beyond
 1846–1860: Following the Discovery of Anesthesia
 Major Anesthetic Themes in the 1960s
 The Evolution of Premedication
Stay updated, free articles. Join our Telegram channel

Full access? Get Clinical Tree


