Oxygen Toxicity: Introduction
The importance of the physiology and toxicology of oxygen (O2) breathing have increased in recent years. The past 25 years have witnessed a remarkable upsurge of knowledge and interest in “oxidative stress” throughout all of biology. The use of O2 continues to grow, from critically ill to ambulatory patients and even to recreational use at “oxygen bars.”1 Recent advances in patient care have refocused attention on the optimum use of O2. For example, currently, strategies to protect the lung from mechanical injury during mechanical ventilation emphasize the use of lower tidal volumes. But such strategies may impair gas exchange, resulting in higher requirements for inspired O2 fraction (FIO2).2
Lavoisier initially characterized O2 as “highly respirable air”3 and “vital air” before eventually giving it the name “principle oxygine” (acidifying principle) in 1777. He took the name from the Greek roots “oxy” (acid) and “gen” (to form), because initially O2 was incorrectly believed to be the essential principle in the formation of acids.4 Normobaric hyperoxia may be defined as an inspired O2 tension,  , between 160 and 760 torr (i.e., between 0.21 and 1.0 atmosphere [atm] of pressure), whereas hyperbaric hyperoxia denotes that
  is greater than 760 torr.
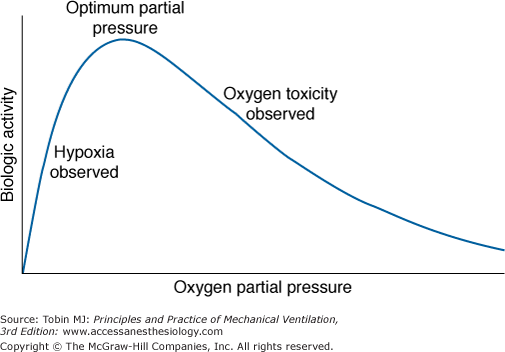
J.B.S. Haldane5 and others6 speculated, and it is now generally accepted, that life on earth began anaerobically when the earth’s atmosphere was virtually devoid of O2. Gilbert6 postulated that in this primordial reducing atmosphere, the first living cells used hydrogen, diffusing into the cell from the environment, as an energy source (e.g., metabolizing carbohydrates to methane and water). Gilbert6 speculated further that because hydrogen would also reduce essential cellular constituents and thereby poison the cell, these early cells also had to develop antihydrogen defenses and actively transport hydrogen ions out of the cell. As the atmosphere was transformed from a reducing to an oxidizing one, O2 replaced hydrogen as an energy source. Therefore, to avoid O2 poisoning, cells then had to develop antioxygen and antioxidant defenses. These observations emphasize that as an energy source for cells, O2 has a dual effect: It is both life promoting and life destroying. This dual nature of O2 (Fig. 45-1) was noted by Priestley in 1775 shortly after his discovery of O2: “though pure [oxygen] might be very useful as a medicine, … as a candle burns out much faster in [oxygen] … so we might … live out too fast.”7 Indeed, even at ambient concentrations, O2 is now considered to play a role in the natural process of aging.8–10 In 1777, Scheele, who independently discovered O2, noted along with Priestley that O2 is toxic to plants. In 1785, Lavoisier, who first recognized the vital role of O2 in the equivalent processes of respiration and combustion, commented explicitly on the dual nature of O2: “when there is an excess of vital air [oxygen], the animal only undergoes a severe illness; when it is lacking, death is almost instantaneous.”6 In experiments carried out with Laplace, he described right-heart and pulmonary congestion in guinea pigs that died in O2 under a bell jar before the O2 was used up.11,12
In 1873, Paul Bert became the first to systematically study O2 toxicity.11 He documented the toxicity of O2, particularly the lethality of hyperbaric hyperoxia, in all forms of life from mammals to viruses. He concluded that “no living thing is exempt from damage that can be produced by oxygen.”13 Grand mal seizures are the most notorious toxic effect of hyperbaric hyperoxia and have been referred to as the “Paul Bert effect.”11 J.B.S. Haldane experienced such seizures himself.11 The pathophysiologic effects of hyperbaric hyperoxia have been reviewed elsewhere.11,13–18 This chapter focuses on the effects of normobaric hyperoxia.
Respiratory Effects of Oxygen Breathing
The best known and most studied effects of normobaric hyperoxia concern the respiratory system. Lavoisier was the first to note changes in the lungs of animals that died from hyperoxia, “…the lung was very flaccid, but bright red, even on the outside, and highly congested with blood….”19 In 1899, J. Lorrain Smith became the first to systematically study the pulmonary pathology of normobaric hyperoxia, specifically, a 4-day exposure to a FIO2 of 0.74 to 0.80 in mammals. The diffuse intense lung damage from O2 toxicity described by Smith, and many others since, has been named the “Lorrain Smith effect.”11
The symptoms and physiologic changes in healthy human volunteers associated with normobaric hyperoxia are the subject of several reviews.11,13,16,17,20–30 Table 45-1 lists the respiratory effects of O2 breathing.
|
The depression in respiratory drive is primarily related to decreased stimulation of the hypoxia-sensitive chemoreceptors in the carotid and aortic bodies. These chemoreceptors are the only known O2 sensors that initiate chemoreflexes.31,32 Dejours et al showed that the O2 chemoreceptor drive of respiration, which may account for 10% to 15% of resting ventilation, disappears above an alveolar partial pressure of oxygen (PO2) of 170 torr, corresponding to a  of 230 torr, or an FIO2 of 0.30.16 When O2 breathing is suddenly initiated, the normal response is twofold.21,33,34 First, there is a nearly immediate, precipitous decrease in ventilation, whose nadir occurs within 20 to 30 seconds (Fig. 45-2), followed by a gradual return to and slightly above baseline (Fig. 45-3). The acute transient depression is mediated by the arterial chemoreceptor reflexes and may be taken as an index of the level of chemoreceptor activity present during normoxia.33,35 The subacute mild sustained ventilatory stimulation appears to be secondary to an indirect effect of hyperoxia on the respiratory centers in the brainstem. That is, hyperoxia causes an increase in tissue carbon dioxide tension (PCO2) secondary to the Haldane effect, or Christian-Douglas-Haldane effect36 (the increase in blood PCO2, at a fixed CO2 content, caused by the release of hemoglobin-bound hydrogen ions and CO2, bound as carbamino compounds, that occurs on the oxygenation of hemoglobin). Ironically, in one of the earliest reports (1921) of this hyperoxia-induced mild hyperventilation, Dautrebande and Haldane37 proposed that hyperoxic vasoconstriction of the central nervous system vasculature produces tissue hypercapnia, which, in turn, directly stimulates the respiratory center.
Figure 45-2
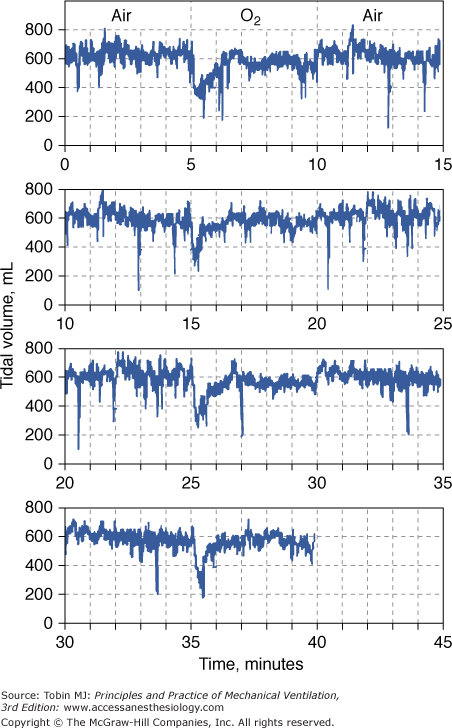
Acute depression of respiration by normobaric hyperoxia illustrated in a healthy conscious dog breathing from a mask as the inspired gas was alternated between air and O2 every 5 minutes for 40 minutes. At the onset of each period of O2 breathing, the continuous record of tidal volume shows a precipitous fall to a mean value of 54% of the normoxia baseline. This decrease in tidal volume is evident by 10 seconds and reaches a nadir at approximately 18 seconds. It is transient, and despite continued hyperoxia, it has returned nearly to baseline by 1.5 minutes. The record is plotted such that the normoxia data at the end of each 15-minute period are repeated on the next line as the beginning of the next 15-minute period to emphasize the repeating, cyclic nature of the alterations in inspired gas and to demonstrate more clearly the response pattern of tidal volume to hyperoxia. (Used, with permission, from Lodato and Jubran.33)
Figure 45-3

Steady-state responses of minute ventilation ( ) and end-tidal partial pressure of carbon dioxide (PCO2) to breathing 100% O2 (hyperoxia) in healthy human subjects (mean ± standard deviation [SD]; n = 14). Poikilocapnic hyperoxia (end-tidal PCO2 was not controlled) produced a mild increase in minute ventilation and a small (4 mm Hg) decrease in end-tidal PCO2. Normocapnic hyperoxia (CO2 was added to the inspirate to maintain constant end-tidal PCO2) produced a marked and progressive increase in minute ventilation. These respiratory stimulant effects of hyperoxia are due largely to the Haldane effect, which results in increased PCO2 in the brain. Note: Before time = 0, subjects were exposed to carbon monoxide in this study of CO elimination. (Used, with permission, from Rucker et al.41)
In normal subjects the mild respiratory stimulation induced in the steady state by hyperoxia results in a mild hyperventilation and a mild decrease in partial pressure of arterial carbon dioxide (PaCO2) by a few millimeters of mercury, which, in turn, limits the degree of hyperventilation. But in the presence of inspired CO2, the paradoxical respiratory stimulant effect of O2 is much more obvious, as noted as early as 1918 by Yamada.38 When the normally modest fall in PaCO2 is prevented, (isocapnic) hyperoxia produces a dramatic increase in ventilation (see Fig. 45-3),39–41 by 21% at FIO2 = 0.30 and by a remarkable 115% at FIO2 = 0.75.39,40 Becker et al40 showed that in both poikilocapnic (nonisocapnic) and isocapnic hyperoxia, the Haldane effect is the most important mechanism of the respiratory stimulant effect of hyperoxia in normals. Rucker et al41 used these observations and showed in normal subjects that, compared with poikilocapnic hyperoxia, isocapnic hyperoxia more rapidly eliminates carbon monoxide and improves cerebral blood flow and O2 delivery (secondary to the vasodilator effect of the higher level of PaCO2) (see Fig. 45-3).
In contrast to the steady-state respiratory stimulant effect of hyperoxia in normals, hyperoxia may instead cause severe respiratory depression in patients with severe chronic obstructive pulmonary disease (COPD). The relative importance of the various mechanisms remains controversial. The conventional view is that hyperoxic hypercapnia is caused by alveolar hypoventilation resulting from reduced hypoxic ventilatory drive secondary to the rise in arterial PO2 (PaO2),42 analogous to “O2 apnea” in patients recovering from general anesthesia.17 Other mechanisms include the Haldane effect, deterioration of ventilation–perfusion ( ) matching in the lung secondary to hyperoxic release of hypoxic pulmonary vasoconstriction, and development of atelectasis (true shunt). O2 may also impair
  matching by release of hypoxia-induced bronchoconstriction.43,44
The data in both acutely decompensated45 and stable46–48 patients with COPD, however, indicate that deterioration of  matching is the predominant mechanism. Using the multiple inert gas elimination technique in COPD patients, Wagner et al49 found no systematic changes in the distribution of
  ratios with 100% O2. But they did not report attempts to correlate individual changes in PaCO2 and changes in
  distribution. In mechanically ventilated patients, Dunn et al50 reported that hyperoxia both worsened
  matching and depressed respiratory drive. For an informative interchange, see Stradling51 and Aubier et al.52
In a more recent study of patients with exacerbations of COPD, Robinson et al44 used the multiple inert gas elimination technique to compare those patients who retained CO2 with O2 with those who did not. In both groups, hyperoxia worsened  matching by increasing perfusion to relatively poorly ventilated lung units (release of hypoxic vasoconstriction). In only the group who retained CO2, however, hyperoxia decreased minute ventilation (by 20%) and increased ventilation to overventilated units (increased alveolar dead space). Later, they53 concluded that in the group that retained CO2, the largest contribution (46%) was from a decrease in minute ventilation, followed closely (43%) by an increase in alveolar dead space, with a much smaller contribution (11%) from the Haldane effect. The modest Haldane effect was likely secondary to only the modest degree of baseline hypoxemia (mean
  = 55 mm Hg). They also showed that the risk of hyperoxic hypercapnia is better predicted by a low baseline
  than by the baseline PaCO2.44
Neff and Petty54 showed that severe chronic respiratory acidosis (mean of PCO2 90 torr, mean pH of 7.32) in patients with COPD is well tolerated. Acute hyperoxic respiratory depression can be avoided by using controlled low-flow O2 administration.55,56 Hyperoxic hypercapnia may also occur in neuromuscular disease57 and near-fatal asthma.58,59
In a prospective randomized controlled trial60 of resuscitation of asphyxiated newborn human infants, those resuscitated with room air had better outcomes (Apgar scores, time to first breath, and first cry) than those resuscitated with 100% O2. These results were attributed, in part, to the respiratory depressant effect of O2.60 The current recommendation is that room air is preferred over 100% O2 for newborn resuscitation.61
Absorption atelectasis during O2 breathing occurs in lung units with sufficiently low  ratios.62 In such units the rate of capillary absorption of O2 exceeds the rate of replenishment of alveolar gas during inspiration. This effect depends on the
  ratio, the pattern of ventilation (e.g., the presence of sighs), the, the duration of the O2 exposure, the intrinsic stability of the lung units (e.g., tissue and surfactant factors), and the sensitivity of the local hypoxic pulmonary vasoconstriction to hyperoxic release (which acts synergistically by further lowering the
  ratio). Using the inert-gas elimination technique in healthy nonsmoking subjects, Wagner et al62 showed that within 30 minutes of breathing 100% O2, eight of the nine subjects had developed small shunts, averaging 0.5% to 3.2%, with the largest at 10.7% (Fig. 45-4). Theoretically, only approximately 6 minutes is required for the development of such shunts.63 Clearly, when 100% O2 breathing is used to quantify a shunt, its magnitude might be overestimated compared to that present during air breathing.
Figure 45-4
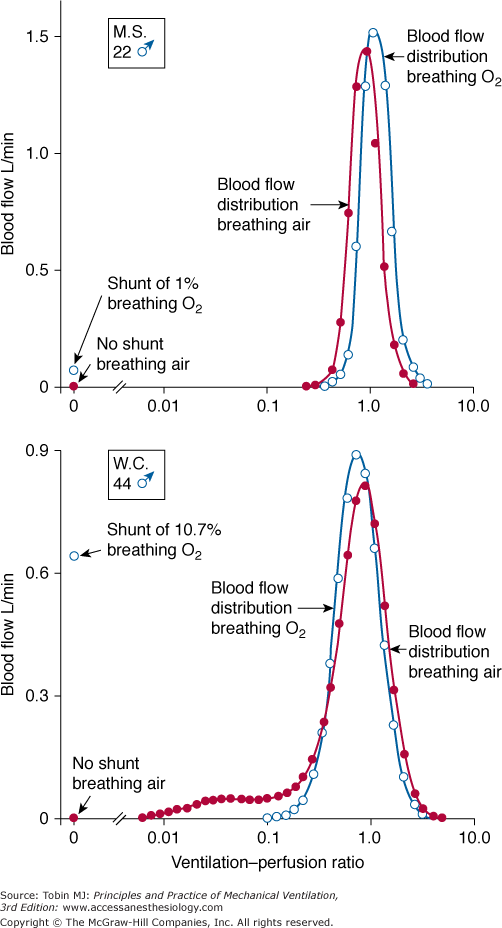
Distributions of blood flow with respect to ventilation–perfusion ( ) ratios in two normal subjects while breathing air (normoxia) and after 30 minutes of breathing 100% O2 (normobaric hyperoxia). Upper panel. In the younger subject hyperoxia produced (a) a 1% shunt, indicating a minor degree of hyperoxia-induced atelectasis, and (b) an overall shift of the main body of the distribution to the right to higher
  ratios, indicating mild hyperoxia-induced hyperventilation in the steady state. Lower panel. In the older subject hyperoxia produced more dramatic changes: The left “shoulder” of the normoxic blood flow distribution (i.e., the blood flow distributed to lung units with low
  ratios) was converted by hyperoxia to a 10.7% shunt, indicating substantial amounts of hyperoxia-induced atelectasis, but the main body of the distribution was little altered. (Used, with permission, from Wagner et al.62)
Hyperoxia also enhances absorption from other gas spaces: middle ear and sinuses (causing headache), and therapeutically in pneumothorax, bowel obstruction or ileus, and subcutaneous emphysema.17
Hyperoxia may also cause atelectasis by interfering with the pulmonary surfactant system,64 both by injury to the alveolar type II pneumocyte, which synthesizes, secretes, and recycles surfactant, and by injury to the alveolar–capillary interface, resulting in the influx of plasma proteins, which inhibit surfactant function. Hyperoxia-induced atelectasis has also been demonstrated in patients with acute lung injury65 using the multiple inert-gas elimination technique.
Comroe et al66 described acute tracheobronchitis in 1945. Normal subjects breathing 100% O2 for 24 hours noted substernal distress, cough, sore throat, nasal congestion, eye irritation, ear discomfort, fatigue, and paresthesia, and had a reduction in vital capacity. Symptoms began within 4 and 22 hours after initiating oxygen breathing. Substernal distress was also noted while breathing 75% O2, but not 50% O2, for 24 hours. Substernal distress is generally the first symptom noted in normal subjects. It is thought to represent acute tracheobronchitis,26 but it may also be the result of atelectasis alone.67 Using fiber-optic bronchoscopy, Sackner et al68 directly observed evidence of such tracheobronchial inflammation (focal areas of redness, edema, and injection of small vessels of the trachea, depression of mucus velocity) in healthy human subjects after 6 hours of breathing 90% to 95% O2.
A decrease in vital capacity66 is considered the best index of O2 toxicity. In humans, this decrease in vital capacity probably results from the inspiratory pain of the acute tracheobronchitis and from absorption atelectasis. In animals, it is more clearly related to parenchymal lung injury. By impairing an important host defense mechanism, acute tracheobronchitis could predispose to nosocomial pneumonia,68,69 but this has not been well studied. In rats, hyperoxia also impairs alveolar macrophage function,70 perhaps adding to the risk of ventilator-associated pneumonia. In healthy subjects with moderate responsiveness to methacholine at baseline, breathing 95% O2 for 12 hours produced no change in methacholine responsiveness, despite signs and symptoms of acute tracheobronchitis.71
Like other toxic drugs, the effects of O2 can be viewed in terms of a classical pharmacologic dose–response curve.13 The dose of O2 can be expressed as the product of and the duration of the exposure (i.e., dose =  × time). When plotted, this relationship is a rectangular hyperbola (Fig. 45-5), which expresses the dose–response in terms of vital capacity decrements. The horizontal asymptote of 50% O2, or 0.5 atm, assumes that at that level of hyperoxia, individuals can be exposed safely for prolonged periods of time.
Figure 45-5

Oxygen tolerance or dose–response curves for pulmonary and central nervous system (CNS) toxicity in healthy human subjects. Each curve in the family of curves for pulmonary O2 toxicity is a rectangular hyperbola and represents equivalent O2 partial pressure-duration “doses” of O2 exposures. These curves are based on the development of the indicated changes in vital capacity in 50% of the individuals subjected to the indicated O2 partial pressure-duration exposures. The horizontal asymptote for the lowest pulmonary toxicity curve is at an O2 partial pressure of about 0.6 atmospheres (atm), indicating that O2 partial pressures below 0.6 atm appear to be “safe” for exposures of indefinite duration. (Used, with permission, from Lambertsen.306)
Carpagnano et al72 reported that breathing 28% O2 for only 1 hour increased inflammatory markers (8-isoprostane and interleukin-6) in exhaled breath condensate in both healthy subjects and patients with COPD. Vital capacity, however, did not change in either group. These results were likely a manifestation of subclinical tracheobronchitis (see above).
The validity of setting at 0.5 atm the threshold  for the development of O2 toxicity, as reflected by a decrease in vital capacity, for exposures of indefinite duration was carefully discussed by Clark and Lambertsen21 and Clark.22 Earlier these authors had suggested a less-conservative threshold of 0.6 atm.73 The rationale for the 0.5-atm
  threshold is based largely on the responses of vital capacity to prolonged hyperoxia in healthy men in the three studies of Comroe et al,66 Helvey et al,74 and Michel et al.75 Figure 45-6 summarizes these exposures and those of two subsequent studies in healthy men.76,77 Comroe et al66 exposed nine normal men to a
  of 0.75 atm for 24 hours, with return to air breathing for 15 minutes every 3 hours. They found that five of the nine had chest symptoms and that the group had a modest decrease in vital capacity (mean decrease < 300 mL). None of six subjects exposed to
  = 0.5 atm for 24 hours had chest symptoms, and the mean decrease in vital capacity was even less (only approximately 210 mL). They concluded that the safe limit of
  lies between 0.5 and 0.75 atm, probably close to 0.6 atm.66 Similar findings were reported by Ohlsson78 (not plotted in Fig. 45-6) in six men exposed to a
  of 0.78 to 0.88 atm for 53 to 57 hours. Helvey et al74 found no change in vital capacity,
  , or chest radiographs after 14 days of exposure to 0.49 atm. Michel et al75 reported no net change in vital capacity during a 7-day exposure of six normal U.S. Navy men to
  = 0.55 atm. Fife et al76 studied three subjects at
  of 0.47 atm for 7 days; none developed chest symptoms or a change in vital capacity.
Figure 45-6
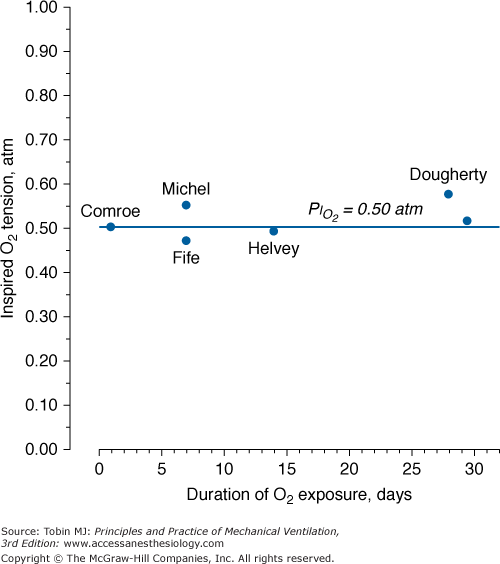
A summary of studies of prolonged exposure of normal human subjects to an inspired O2 tension ( ) near 0.5 atm. The points indicate the
  and duration of exposure for the respective studies. The name associated with each point indicates the original reference. Each of these studies reported that the hyperoxic exposure was generally well tolerated, with little or no symptoms of chest tightness, little or no decrease in vital capacity or other pulmonary function tests, and no long-term sequelae. See text for details. (Data from Comroe et al,66 Helvey et al,74 Michel et al,75 Fife et al,76 and Dougherty et al.77)
At  = 0.5 atm for 45 hours, Griffith et al79 found increased pulmonary clearance of an inhaled tracer and increased albumin in bronchoalveolar-lavage fluid, suggesting the possibility of injury to the alveolar-capillary barrier, or alternatively, only inflamed airways.80
Data from the U.S. Navy’s Shallow Habitat Air Diving (SHAD) program support 0.6 atm  as safe for prolonged O2 exposure.16 Men tolerated well exposures of 0.51 and 0.57 atm
  for 29.5 and 28 days, without changes in pulmonary function.16,77,81 With 9-day exposures to mean
  of 0.61 atm (each day, 16 hours at
  = 0.51 atm and 8 hours at
  = 0.81 atm), only one of the three men showed decreased vital capacity (9.7%) and chest discomfort, both coinciding with the daily 8-hour excursions to
  = 0.81 atm.16,77,81
Several studies examining physiologic parameters and other indices of lung injury have also been carried out in humans with exposures at or near a  = 1 atm (Fig. 45-7). Burger and Mead67 reported chest pain and tightness and decreases in pulmonary compliance after only 3 hours of breathing pure O2 at various ambient pressures including 1 atm. The subjects were instructed to refrain from taking deep breaths, yawning, or sighing during the exposure. Postexposure the decrease in compliance and the chest symptoms readily resolved on deep breathing or sighing, suggesting to them that atelectasis rather than direct O2 toxicity was the etiology. Remarkably, in this study,67 breathing pure O2 at only 0.39 atm ambient pressure (
 of only 0.39 atm) produced symptoms that were qualitatively and quantitatively no different from breathing pure O2 at 1 atm ambient pressure (
 = 1). Yet, breathing with a
  of 1 atm, but in the presence of an equal amount of nitrogen (
 = 1 atm, and total ambient pressure =
  +
+  = 2 atm) was virtually no different from control (air breathing at 1 atm ambient pressure). These findings further convinced these investigators that atelectasis, promoted by the lack of nitrogen, was the mechanism of both the chest symptoms and the compliance changes.
Figure 45-7
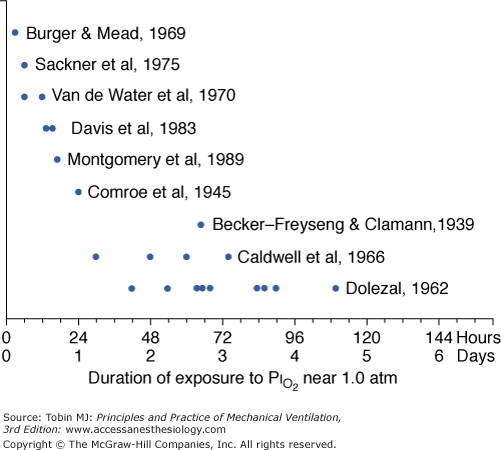
A summary of studies of prolonged exposure of normal human subjects to an inspired O2 tension ( ) near 1 atm. The horizontal arrays of points indicate the various durations of exposure within a given study. The names associated with each horizontal array of points indicate the original references. See text for details. (Data from Burger and Mead,67 Sackner et al,68 Van de Water et al,82 Davis et al,83 Montgomery et al,80 Comroe et al,66 Becker-Freyseng and Clamann,84 Caldwell et al,85 and Dolezal.88)
As already noted, Sackner et al68 found bronchoscopic evidence of tracheitis in each of ten normal subjects inspiring a  of 0.90 to 0.95 atm for 6 hours. None had substernal distress or changes in pulmonary function tests. Tracheal mucus velocity was depressed at 3 hours but was restored by a β2-adrenergic agonist. They speculated that the effect on mucus velocity could predispose to bacterial superinfection.68 In men exposed to 6–12 hours of
  = 1 atm and taking a deep breath every 20 minutes, Van de Water et al82 found no chest symptoms or changes in pulmonary function or oxygenation.
In fourteen subjects exposed to a  of 0.95 atm for a mean of 17 hours, Davis et al83 found that nine had substernal discomfort and six had “mild erythema” on bronchoscopy. Bronchoalveolar lavage fluid showed increased albumin, transferrin, and total protein, consistent with alveolar–capillary leak, but no change in inflammatory cells. In contrast, despite chest pain in subjects breathing
  = 1 atm for 17 hours, Montgomery et al80 found no changes in pulmonary function tests, solute permeability, or systemic or pulmonary endothelial injury (as reflected by plasma fibronectin and factor VIII). They suggested that the increased albumin and transferrin in bronchoalveolar lavage fluid reported by Davis et al83 and Griffith et al79 may not indicate lung parenchymal injury, but may instead have come from the inflamed airways.
Comroe et al66 studied men exposed to  = 0.99 atm for 24 hours and found no changes in chest radiographs or oxygenation. Burger and Mead67 found that breathing pure O2 at ambient pressure of 0.5 atm, such that
  = 0.5 atm and
  = 0, produced no symptoms but decreased vital capacity.
In 1939 Becker-Freyseng and Clamann84 reported exposures of two men to a  of 0.9 atm for 65 hours, or 2.7 days. Both had decreased vital capacity. One developed nausea, vomiting, tachycardia, a febrile tracheobronchitis, dyspnea, and pain in the elbows and knees. The etiology of nausea and vomiting is not clear but could be related to the absorption of bowel gas owing to the absence of nitrogen.17
Caldwell et al85 studied four subjects exposed to =  0.98 atm for, respectively, 30, 48, 60, and 74 hours (i.e., 1.25, 2.0, 2.5, and 3.1 days). They were instructed to take five deep breaths and a cough every 2 hours throughout the day but not at night. In addition to chest pain and cough, three of the four had paresthesia, and three had anorexia. They noted decreases in lung volumes, diffusing capacity, but not in the ratio of forced expiratory volume in 1 second to forced vital capacity, and a modest increase in alveolar-arterial (A-a) PO2 gradient (89 Torr). Chest radiographs were clear. The authors could not exclude atelectasis as the etiology of the decreased vital capacity. The subject with the longest (74 hours) exposure, however, was hospitalized for 2 days postexposure “until his sense of well-being and appetite returned.” This subject had dyspnea on exertion for 3 to 4 days postexposure, and his vital capacity did not return to baseline until 24 weeks postexposure.85 In humans, normobaric hyperoxia does not produce airway obstruction,71 but may do so in dogs11,86 and primates.87 Hyperbaric hyperoxia may produce airway obstruction in humans.25
The longest voluntary human exposures to 100% O2 are by Dolezal.88 Twelve subjects were exposed to the limit of tolerance. The mean exposure was 74 hours (3.1 days), with a range from 42 hours (1.75 days) to a remarkable 110 hours (4.6 days). PCO2 of the exposure chamber remained high, approximately 7 to 8 torr (1%). In addition to retrosternal pain and cough, the subjects eventually experienced dyspnea, loss of gustatory sensation, anorexia, nausea (after 48 to 60 hours) and vomiting, general weakness, and vertigo (beyond 60 to 72 hours). Three developed fevers of 38.5°C to 39.3°C (101.3°F to 102.7°F). As evidence of additional systemic (nonrespiratory) toxicity, nine of the twelve noted paresthesias and hypesthesias of the finger tips in both hands and feet, which did not resolve until 14 to 21 days postexposure. Vital capacity decreased by 17%, minute ventilation progressively increased by 39% throughout the exposure, and a mild respiratory alkalosis developed. Remarkably, arterial O2 saturation remained at or near 100% throughout the exposure and was normal postexposure. Dolezal interpreted this intact oxygenation as evidence that pulmonary edema and “hepatization foci,” as seen in animal studies, had not developed.88
Taken together, these reports seem to imply that evidence for major sustained parenchymal lung injury, or the equivalent of acute respiratory distress syndrome (ARDS), has been much more readily observed in animals than in normal humans.
Most patients who receive prolonged high have severe parenchymal lung injury (e.g., ARDS). Intriguing data are available, however, from human patients without major lung disease. In eighteen patients postoperative from cardiac surgery, Singer et al89 confirmed that short exposures to 100% O2 for a mean of 24 hours (range 15 to 48 hours) have no demonstrable adverse effects. They found no change in shunt, compliance, dead space, radiologic atelectasis, or clinical course compared to a group who received only the FIO2 (mean: 0.32) required for adequate oxygenation. Singer et al89 also reported two additional patients who were ventilated with 100% O2 for 5 and 7 days, respectively. Throughout the 5-day and 7-day periods, these patients showed progressive improvement in PaO2, from 368 to 430 torr and from 155 to 404 torr, respectively. The first patient was extubated on the fifth day and subsequently discharged from the hospital. The second patient died on the seventh day of massive pulmonary hemorrhage related to a greatly prolonged bleeding time on anticoagulants.
In a companion paper by the same group, Barber et al90 reported the effects of ventilating patients with massive cerebral trauma and resultant irreversible, ultimately fatal brain damage, with either 100% O2 (n = 5) or air (n = 5). Ventilation with the respective gases continued until death, which occurred within 31 to 72 hours, or 1.3 to 3 days (mean: 2.2 days), in the O2 group and within 50 to 216 hours, or 2.1 to 9 days (mean: 4.3 days), in the air group. None had preexisting lung disease. None had spontaneous respirations. All received tidal volumes greater than 800 mL, periodic tracheal suctioning, frequent changes in body position, and treatment with corticosteroids. After 2 days, the O2 group had a lower mean  (120 vs. >400 torr, tested on 100% O2 in both groups), greater shunt and dead space, but no difference in compliance. The O2 group also had greater worsening of chest radiographs, progressing to multilobar infiltrates, consolidation, or collapse. At autopsy the O2 group also had greater lung weights. Perhaps the most striking finding was that at autopsy no histologic differences between the groups were apparent. Both had varying degrees of bronchopneumonia, intraalveolar and interstitial edema, atelectasis, congestion, hemorrhage, and intravascular coagulation. Hyaline membranes, however, were “conspicuously absent” in both groups. It seems likely that hyperoxia-induced atelectasis (and perhaps ventilator-induced lung injury, with an 800-mL tidal volume), could explain many if not all of their findings, especially in such patients with no spontaneous respiratory effort.
Hyde and Rawson91 reported the effects of inadvertent exposure to 83% to 91% O2 for 12 to 32 days in five intubated patients with neuromuscular disease. The authors made a presumptive diagnosis of hyperoxic pneumonitis based on scattered patchy infiltrates on chest radiographs, fever, and leukocytosis. The postmortem examination of the one patient who died (a depressed patient who was found dead with the respirator disconnected) showed “thickening of the alveolar septa by edema and fibroblastic proliferation … fibrin deposition and increased numbers of lining cells in the alveolar lumina.” No hyaline membranes were described. However, interpretation of their findings is confounded by the fact that these patients also had copious secretions, “a major degree of atelectasis” (four of the five patients), and pneumonia (four of five), which are common complications of such patients even in the absence of hyperoxia. Furthermore, unlike ARDS, these patients responded rapidly to minimizing the FIO2, “vigorous tracheal aspiration (and) meticulous tracheal toilet,” and antibiotics. In fact, after these changes in management, all four were weaned from mechanical ventilation within 2 to 5 days.
Perhaps the longest reported exposure of a patient to hyperoxia was that of a 32-year-old man with myasthenia gravis, who was ventilated with 80% O2 (which could not be lowered for technical reasons) for 150 days, at which time he developed blindness bilaterally with retinal artery constriction and retinal atrophy.92 Hyperoxia constricts retinal arteries in adults as well as neonates.93 During the exposure his  remained 250 to 300 torr. He remained another 130 days on 60% O2 (
 120 to 160 torr) before weaning from mechanical ventilation on day 280, after which his
  remained normal (80 to 100 torr). Except for the elevated P(a-a)O2 gradient, consistent with atelectasis, inadequate control of secretions, or pneumonia, no signs or symptoms of pulmonary O2 toxicity were reported.
In a brief communication Smith et al94 reported the absence of any evidence of O2 toxicity, as determined by radiographs, pulmonary function, bronchoscopy, or histopathology, in forty-one patients treated with high-frequency jet ventilation using a mean FIO2 of 0.92 (range: 0.80 to 0.95) for a mean of 4.1 days (range: 8 hours to 12 days). They suggested that their lack of O2 toxicity may be secondary to the lack of “stretching and shearing forces” encountered in conventional mechanical ventilation.
More recently, Capellier et al95 retrospectively studied seventy-four patients with FIO2 ≥0.90 continuously for at least 48 hours. They found that the duration of this exposure in the seventeen survivors was surprisingly long (mean: 5.6 days) and not different form the fifty-seven nonsurvivors (5.9 days). One survivor had exposure to FIO2 ≥0.90 for 15 days and was eventually discharged, breathing spontaneously with a normal PaO2 on room air. The majority of deaths were related to sepsis and multiorgan failure rather than to progressive hypoxemic respiratory failure. Of the thirty-seven patients exposed to FIO2 ≥0.90 for at least 4 days, only 5 (14%) died with hypoxemia. These authors concluded that the lungs of patients with acute respiratory failure appear relatively resistant to prolonged hyperoxia, that high plateau pressures may be more injurious than high FIO2, and that a prospective trial may be helpful in clarifying the optimum management of FIO2 for such patients.95
In 1958 Pratt96 was the first to note in patients pathologic changes attributed to hyperoxia. The pathology of pulmonary O2 toxicity has been reviewed by a number of authors13,16,20,23–26,28,97,98 and is the subject of a monograph.11 Because of preexisting lung disease in most human studies, the most persuasive data come from animals. A few studies, however, of hyperoxic pulmonary pathology in humans without preexisting lung disease are available,99–101 and the findings are consistent those in animals. The histologic pathology of hyperoxia-induced acute lung injury is that of diffuse alveolar damage.98 Diffuse alveolar damage is a descriptive term for the predictable but nonspecific features of acute lung injury from a variety of toxins, including infectious agents, other inhalants, pharmaceutical agents and other ingestants, radiation, and the multiple causes of ARDS, including trauma and sepsis.98 Hyperoxia has in common with all other causes of diffuse alveolar damage an initial injury to both the alveolar endothelial and epithelial cells.
Diffuse alveolar damage can be divided into two stages, as first defined by Nash et al,102 and detailed in Table 45-2.97 The first is an early acute or exudative stage within the first week, characterized by interstitial and intraalveolar edema, intraalveolar hemorrhage and fibrin deposition, sloughing of the alveolar lining cells (type I pneumocytes) with denudation of the alveolar basement membrane, and hyaline membranes, which represent cytoplasmic and nuclear debris from sloughed cells mixed with fibrin.98 Late in the first week an inflammatory cell infiltrate into the interstitium is evident. The small pulmonary arterioles and alveolar capillaries may show fibrin thrombi. Also by the end of the first week, proliferation of type II pneumocytes appears along the alveolar lining, representing a reparative phase; the type II pneumocytes can later differentiate into type I pneumocytes.98
| Changes | Time of Occurrence |
|---|---|
| A. Exudative | |
| 1. Capillary congestion, focal intraalveolar edema, few cases with fibrin thrombi in capillaries and small arteries | Less than 3 days |
| 2. Interstitial edema | After 3 days |
| 3. Hyaline membranes lining alveolar septa | 22 hours to 7 days, decreasing or focal thereafter |
| 4. Interstitial mononuclear cell infiltrate (lymphocytes, plasma cells, unclassified cells) | Less than 1 week |
| B. Proliferative | |
| 1. Alveolar lining cell hyperplasia | Focal at 3 days, diffuse at 1 week |
| 2. Interstitial fibrosis | Focal at 3 days, diffuse at 8 days, severe by 2 weeks |
The second stage of diffuse alveolar damage98 is a proliferative or organizing stage and is noted beyond the first week. Fibroblastic proliferation in the interstitium and focal intraalveolar fibrosis appear. Whereas the edema and hyaline membranes have largely resolved, the interstitial inflammatory infiltrate and the alveolar lining cell hyperplasia are still present. A striking interstitial fibrosis develops in association with extensive interstitial deposition of collagen.
The issue of just how sensitive the human lung is to hyperoxic lung injury is still somewhat open to question. Remarkably, as noted above, in patients without prior lung injury who received 100% O2 for up to 7 days, typical histologic lesions were not found.89,90 These observations prompted Katzenstein98 to suggest that humans may be susceptible to significant hyperoxic lung injury only after their lungs are first damaged by other insults. Other authors have concluded simply that no consistent evidence shows that hyperoxia (FIO2 >0.60) is dangerous in acute lung injury or ARDS.103
Bronchopulmonary dysplasia was initially described in 1967104 and has been reviewed in detail by Balentine11 and Truog.105 It is a form of chronic lung disease that follows therapy for idiopathic respiratory distress syndrome of the newborn, or hyaline membrane disease. Bronchopulmonary dysplasia develops in very low-birth-weight infants (≤1500 g at birth). Its incidence and prevalence have risen substantially in recent years because of the markedly increased survival of these infants.105 It has become the most common cause of chronic lung disease in infants.106 Its pathologic features include fibrosis and destruction of acinar structures with a resultant combination of scarring and emphysematous changes. It appears to have three contributing mechanisms: (a) ventilator-induced lung injury,107 (b) hyperoxia, with increased O2 radicals in the presence of an immature antioxidant defense system,108 and (c) peribronchial pulmonary edema secondary to the birth-related increased pulmonary blood flow through an immature and injured pulmonary microcirculation.105 Because high levels of both mechanical ventilation and hyperoxia virtually always occur together in patients with idiopathic respiratory distress syndrome, the relative roles of these two etiologic factors is unclear. Churg et al109 have described the equivalent of bronchopulmonary dysplasia, including “honeycombing,” in three adult patients who also had received the combination of high ventilator pressures and high FIO2 for 3 to 7 weeks. Baboon and other animal models for bronchopulmonary dysplasia exist.110,111
In recent years, the risk and severity of bronchopulmonary dysplasia have decreased with the use of antenatal glucocorticoids, less aggressive mechanical ventilation, including limiting the FIO2 and the use of continuous positive airway pressure,112,113 and postnatal surfactant.112–114
Nonrespiratory Effects of Oxygen Breathing
The nonrespiratory effects of hyperoxia have been extensively reviewed elsewhere.11,13,28,115 The best-recognized effects include hemodynamic changes, suppression of erythropoiesis and serum erythropoietin,116 the Haldane effect (see the section Respiratory Depression and Stimulation, Pulmonary Vasodilation, and Hypercapnia), retinopathy of prematurity (previously called retrolental fibroplasia), and, only at O2 pressures exceeding 2 atm, seizures.
Retinopathy of prematurity results from hyperoxic vasoconstriction and injury to the exquisitely susceptible, growing retinal capillaries of premature neonates (<26 weeks gestation).11,117,118 The resulting paradoxical “hyperoxic hypoxia” and tissue ischemia induces neovascularization within the retina and adjacent vitreous. This retinovitreal neovascularization eventually results in retinal detachment and blindness,118 a process similar to that in diabetic and sickle-cell retinopathies.117 Both the incidence and severity of retinopathy of prematurity correlate with the duration of exposure to  greater than 80 torr.119 The pathogenesis of retinopathy of the newborn has two phases.120 The first phase (20 to 30 weeks postmenstrual age) involves hyperoxia and decreased vascular endothelial growth factor (VEGF) levels, whereas the second phase (31 to 44 weeks) involves hypoxia and increased VEGF levels. Activation of the VEGF receptor VEGFR-1 can prevent the hyperoxia-induced retinal vascular degeneration of retinopathy of prematurity.121 More recently, it has been reported that intravitreal bevacizumab (anti-VEGF) benefitted infants with retinopathy of prematurity.120 The optimum oxygenation is unclear. The recent SUPPORT trial in premature infants reported that a lower target range of arterial oxyhemoglobin saturation (
 ) (85% to 89% vs. 91% to 95%) increased mortality but decreased severe retinopathy in the survivors.112,113
The acute hemodynamic effects of normobaric hyperoxia in healthy humans have been studied by a number of investigators115,122–134 and summarized by Lodato,28,115,130 who also found virtually identical responses in conscious dogs.115,130
Related posts:


Stay updated, free articles. Join our Telegram channel

Full access? Get Clinical Tree


