40 Neuroimaging
 Methods
Plain Radiographs
Plain radiographs can be acquired rapidly and inexpensively but are of limited value in studying patients with suspected central nervous system (CNS) pathology. In the initial evaluation of patients with traumatic injuries, plain radiography of the head and neck may be useful when a surgical or unstable injury such as a depressed skull fracture, vertebral fracture, or subluxation is identified. Because plain radiographic studies are unable to identify intracranial injuries or exclude spinal injuries, CT is required whenever aspects of the clinical presentation suggest the presence of significant injury. Retrospective studies suggest that when patients have such minor trauma or symptoms that cervical spine plain radiography is ordered, instead of CT, the images are of little clinical benefit.1
Computed Tomography
Computed tomography (CT) is the most widely used imaging modality for evaluating critically ill patients. CT is widely available, rapid, and accurate and has virtually no contraindications in the acute setting. The utility of CT is increased by multiple modifications, including the use of contrast, windowing techniques, and image-reconstruction techniques. Iodinated contrast agents given intravenously (IV) visualize lesions that disrupt the blood-brain barrier as well as normal and abnormal vascular structures. Varying the grayscale “window level” improves the evaluation of osseous and soft-tissue structures. Concerns about the long-term risks of malignancy from CT radiation exposure need to be considered in young patients and those likely to require repeated neuroimaging studies.2
Xenon CT tracks the diffusion of inhaled xenon gas to measure cerebral perfusion. Rapid CT scanning has also led to the development of CT perfusion studies that track IV contrast, providing estimates of cerebral blood volume (CBV), cerebral blood flow (CBF), and mean transit time. Although bolus tracking techniques are less quantitative than nuclear medicine studies such as xenon CT, positron emission tomography, and single-photon emission computed tomography (SPECT), they are more widely available. Perfusion studies are increasingly used to evaluate vascular injuries3 and may have applications in the study of other diseases.
Magnetic Resonance Imaging
Magnetic resonance imaging (MRI) uses an intense magnetic field and radiofrequency pulses to produce images without the use of ionizing radiation. There are numerous MRI “sequences” for which imaging parameters are varied to highlight different tissue characteristics, identifying both anatomic and physiologic variations from normal. The availability of increasingly powerful MRI magnets and more refined methods for signal collection and processing have reduced imaging times and increased image clarity, sensitivity, and specificity.4 Gadolinium-based, noniodinated IV contrast agents are used to assess vascular integrity. Arterial spin labeling and contrast bolus tracking methods can be used to create MR angiography (MRA) and MR perfusion-weighted images (PWI).
Functional MRI (fMRI) can detect changes in blood flow and map the performance of cognitive tasks to areas of increased or decreased brain activity, but its use outside of research is limited to the presurgical workup of patients with tumors or focal epilepsy. Diffusion-weighted imaging (DWI) evaluates the directional movement of water molecules to assess tissues for increased diffusion, as occurs with decreased cell density (encephalomalacia) or increased extracellular water content (vasogenic edema), or decreased or restricted diffusion, as occurs with increased water content within injured cells (cytotoxic edema) or between layers of injured myelin. DWI is very useful for early identification of acute ischemic stroke, for the differentiation of necrotic tumor from pyogenic abscess, and in evaluation of the cellularity and grade of tumors.5–7 PWI studies are used to look for an ischemic penumbra around an area of infarction that might remain viable and respond to reperfusion or neuroprotection. Patients with an area of poor perfusion much larger than their area of diffusion restriction (DWI/PWI mismatch) are more likely to respond favorably to interventional thrombectomy,8 but there is still little agreement as to how to measure core and penumbral tissues.9
Magnetic resonance spectroscopy (MRS) can noninvasively measure brain metabolites in a small volume (voxel) of tissue. Carbon and phosphorous spectroscopy have shown promising applications in research, but proton spectroscopy is more commonly used. Current applications include assessing the severity of traumatic and ischemic injuries, characterizing tumors and differentiating them from infections, demyelination, and postradiation injury, and evaluating patients with metabolic disorders.10,11 Diffusion tensor imaging (DTI), which measures the diffusion of water molecules along a higher number of planes than conventional DWI in order to assess the directionality of fiber tracts, is an emerging technology for visualizing the relationship between mass lesions and large, projecting fiber tracts, such as the visual and corticospinal tracts, and for monitoring the severity and evolution of axonal injuries.12
The disadvantages of performing MRI on critical care patients include the need for preprocedural preparation and screening. Patients must be screened carefully for the presence of implanted devices and ferromagnetic metal fragments or prostheses that may preclude their exposure to the powerful magnetic field used in MRI.13 The website www.MRIsafety.com is a useful resource for checking the MRI compatibility of particular medical devices. Respirators and physiologic monitors must also be MRI compatible. Only oxygen and nitrogen tanks composed of aluminum can enter the magnet suite. All these precautions and modifications can significantly delay imaging. There are protocols to rapidly evaluate patients with suspected acute stroke, but most routine MRI studies take approximately 45 minutes to perform, and studies of the entire neuroaxis with and without contrast can require more than 90 minutes. Critically ill patients are often unable to tolerate MRI until they are more hemodynamically stable.
Nuclear Medicine Studies
Nuclear medicine techniques provide somewhat quantitative physiologic imaging of the brain. PET measures the distribution of radioisotope-containing compounds (e.g., 8F-fluorodeoxyglucose [FDG]) that are given IV and can study cerebral perfusion as well as cerebral energy metabolism. SPECT can study the distribution of isotopes incorporated into other biologically active compounds, allowing measurement of other aspects of tissue metabolism.14 PET studies provide higher-resolution images that can more easily be co-registered with MRI, but PET can only be done in hospitals with their own cyclotrons, as the isotopes used have shorter half-lives than those used for SPECT. The most common application of PET is in the diagnosis, staging, and monitoring of tumors, although other applications are undergoing evaluation.15,16 SPECT using technetium-99m hexamethylpropyleneamine oxime (99mTc-HMPAO) is often used to assess overall CBF as a confirmatory test in the determination of brain death.17
Angiography
Percutaneous transfemoral catheterization is used to evaluate cerebral and spinal vascular anatomy. It is an invasive procedure but has a fairly low rate of complications in experienced centers, with most complications being minor and transient, such as groin hematoma, asymptomatic femoral artery or carotid artery dissections, and minor allergic reactions.18 Permanent neurologic complications such as cerebral infarction due to thromboembolism are rare with diagnostic procedures but occur more often in older patients, with prolonged study times, and when angiography is used for interventional procedures such as intraarterial thrombolysis or thrombectomy, balloon angioplasty for patients with subarachnoid hemorrhage–associated vasospasm, and occlusion of aneurysms and arteriovenous malformations.19
 Brain
Brain
Patterns of Disease
Edema
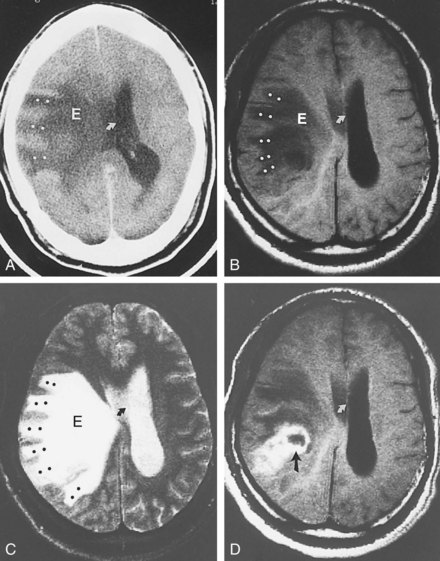
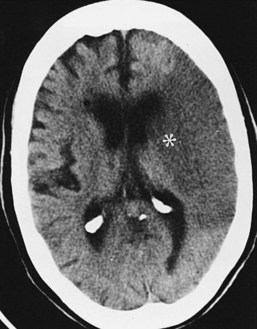
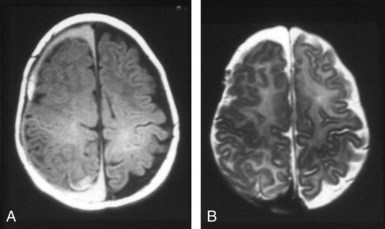
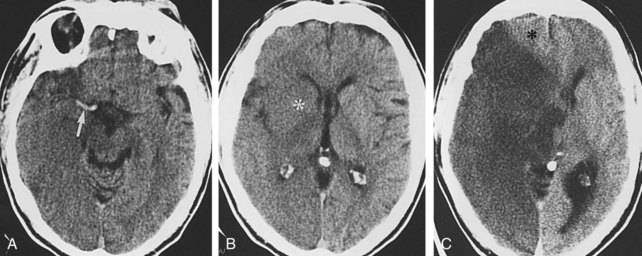
Except for location, the CT and MRI appearance of all types of edema is similar. Increased water content appears dark on CT because of hypodensity. It also appears dark on T1-weighted imaging (T1WI) but bright on T2-weighted imaging (T2WI) sequences, including fluid-attenuated inversion recovery (FLAIR) studies in which CSF in the ventricles, cisterns, and arachnoid spaces is made to appear dark. Vasogenic edema within the white matter extends along fiber tracts, creating “fingers” that extend toward the cortical gray matter (Figure 40-1). This pattern has a nonvascular distribution and is associated with mass effect. Cytotoxic edema can involve gray and white matter, follows a vascular distribution when associated with ischemic injury, and produces less mass effect for its size (Figure 40-2). DWI can distinguish between the increased diffusivity of vasogenic edema and the resticted diffusivity of cytotoxic edema. Interstitial edema may be limited to a narrow rim that abuts the ventricular wall and fades gradually into the surrounding white matter and is best seen on MRI, particularly with FLAIR sequences.20 Engorgement caused by increased arterial or venous CBV, often localized when associated with an arteriovenous dural fistula, can mimic edema on routine imaging studies but is apparent on cerebral perfusion studies.21
Hemorrhage
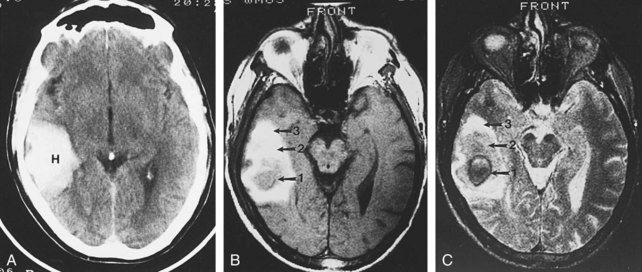
The imaging appearance of hemorrhage depends on the stage of clot formation and lysis, location, and the degree to which it is mixed with other fluids. On CT, hemorrhage may be isodense to brain parenchyma and difficult to visualize in the hyperacute stage, but it typically becomes hyperdense within several hours (Figure 40-3, A) before again becoming isodense over days to weeks and then hypodense over several weeks (Table 40-1). Acute hematomas may continue to appear isodense in the acute stage in anemic patients with a hemoglobin (Hb) below 8 to 10 g/dL or in patients with a coagulopathy who fail to produce clot retraction.22,23 The final CT appearance of resolved hemorrhage may show no residual abnormality or demonstrate a focus of low attenuation or calcification.
On MRI, the evolving appearance of a hemorrhage is largely explained by Hb having different paramagnetic properties as it is deoxygenated and metabolized. In the hyperacute to acute stages, diamagnetic oxyhemoglobin is predominant and appears slightly hypo- to isointense on T1WI and iso- to hyperintense on T2WI. As Hb becomes deoxygenated, it becomes paramagnetic and very hypointense on T2WI. In the subacute stage, Hb breakdown to methemoglobin begins peripherally and advances toward the center of the clot. Intracellular methemoglobin appears hyperintense on T1WI and hypointense on T2WI. As red blood cells lyse and release methemoglobin into the extracellular space, its signal becomes hyperintense on T1WI and T2WI. In the chronic stage, beginning within 2 weeks and lasting for years, methemoglobin undergoes phagocytic degradation to hemosiderin, which appears hypointense on T1WI and T2WI.7 The evolution of a hematoma is influenced by many factors, and there may be simultaneous overlap of two or more of these stages (see Figure 40-3, B and C). The widespread use of the gradient-recalled echo (GRE) sequence, and the increasing use of susceptibility-weighted imaging (SWI) sequences, has greatly increased the sensitivity of MRI for extravasated blood.24
Most intraparenchymal hematomas are associated with a surrounding area of vasogenic edema and evolve somewhat more quickly (owing to higher tissue thromboplastin concentration and lower oxygen tension) than extraaxial blood collections. Intraparenchymal hematomas expand significantly, usually within 3 hours from onset, in about one-third of patients,25 and contrast extravasation into the hematoma on CT is predictive of expansion.26 Vasogenic edema surrounding an intraparenchymal hematoma can also expand over several days, causing a significant increase in mass effect.
Mass Effect, Shift, and Herniation
Cerebral lesions may lead to brain herniation, either as a direct result of lesion growth, as with tumor growth or hematoma expansion, or secondary to intralesional cytotoxic edema, perilesional vasogenic edema, or obstructive hydrocephalus.27 Two relatively fixed dural partitions are present within the skull and create compartments across which the brain may herniate. The falx cerebri separates the cerebral hemispheres, and the tentorium cerebelli separates the cerebral hemispheres from the posterior fossa structures. Herniation is described in terms of location.
Subfalcine herniation occurs when the medial surface of a hemisphere, usually the cingulate or supracingulate gyrus, is compressed against and displaced beneath the falx. With CT or MRI, early signs may appear as compression or distortion of the lateral ventricles (see Figure 40-1). Later stages are recognized by deviation of the falx, identification of the hemispheric structures that are crossing the midline, and ischemia from compression of the anterior cerebral artery.
Masses arising on either side of the tentorium can result in transtentorial herniation. Descending transtentorial herniation involves a supratentorial mass pushing the medial temporal lobe through the incisura. On CT or MRI, the herniated brain pushes against and rotates the brainstem. This produces widening of the ipsilateral brainstem cistern and effacement of the contralateral cistern (Figure 40-4). Associated findings may include dilatation of the contralateral temporal horn secondary to ventricular trapping. Ascending transtentorial herniation is caused by an infratentorial mass displacing the pons, vermis, and adjacent portions of the cerebellar hemispheres upward through the incisura. On CT and MRI, the brainstem cisterns are symmetrically effaced as the cerebellar vermis bulges up through the incisura. This is often associated with acute hydrocephalus caused by compression of the cerebral aqueduct.
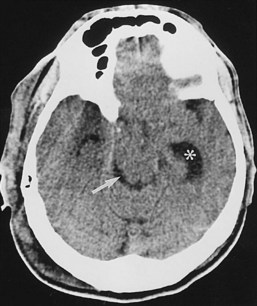
Figure 40-4 Right descending transtentorial herniation in patient with large right parietal subdural hematoma.
Specific Disease Processes
Traumatic Brain Injury
Noncontrast head CT continues to be the primary modality for the initial evaluation of patients with traumatic brain injury (TBI).28 Its advantages include fast examination time, wide availability, fracture detection, lack of contraindications, and high accuracy. Although MRI is more sensitive in detecting intracranial injuries, it is limited by longer examination times, need for sedation in uncooperative patients, and difficulties with monitoring potentially hemodynamically unstable patients. Once patients have been stabilized, MRI becomes the modality of choice for fully elucidating the nature and extent of the injury and for informing prognosis.29
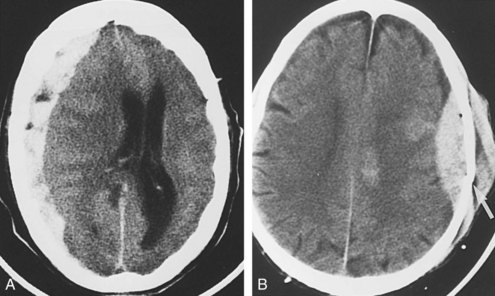
Damage to the brain coverings may lead to hemorrhage into the epidural, subdural, and subarachnoid (and, by extension, intraventricular) spaces. On CT, intraventricular and subarachnoid hemorrhage is identified by replacement of the normal low-density CSF by high-density blood. When subtle, subarachnoid hemorrhage can be mistaken for generalized edema, with loss of the basal cisterns. Subdural hematomas typically appear as crescentic mixed or hyperdense collections that cross suture lines but not dural attachments (Figure 40-5, A). Epidural hematomas typically appear as biconvex hyperdense collections that cross dural attachments but not suture lines (see Figure 40-5, B). With rapid accumulation of blood, unretracted semiliquid clot may be present. In this situation, CT demonstrates hypodense areas within the hyperdense hematoma, the so-called swirl sign.30 Distinction between epidural and subdural hematomas is important, because epidural hematomas often have an arterial source, expand rapidly, and require emergent drainage to avoid herniation.31
Abusive head trauma (AHT) is a significant cause of neurodevelopmental morbidity and mortality in children younger than 2 years old.32 Mechanisms that have been proposed include blunt trauma, axonal shearing from shaking, and secondary ischemic injury from strangulation, arterial dissection, suffocation, or brainstem injury leading to respiratory arrest. Intracranial injuries commonly encountered include skull fracture, subdural hematoma, subarachnoid hemorrhage, and shear injuries. Subdural hematoma is regarded as one of the most characteristic CNS lesions encountered in the “shaken baby” syndrome. In fact, subdural hematomas in young children are more often associated with AHT than with accidental trauma.32 The CT appearance of AHT in children is similar to that in adults. However, subdural hematoma is more common along the posterior interhemispheric fissure and appears as increased attenuation along the falx. Other common locations include the anterior interhemispheric, tentorial, and parieto-occipital regions. MRI can determine the age of the blood products and provide an estimate of when the hemorrhage occurred, as discussed earlier. Coexistence of blood products of different ages (Figure 40-6) is suggestive of recurrent bleeding and repeated abuse but must be interpreted with great caution.7
Vascular Lesions
Ischemia, Hypoxia, and Infarct
Although CT demonstrates only about half of infarcts within the first 48 hours, it remains the imaging modality of choice in the acute evaluation of patients with transient or persistent focal neurologic deficits that may be associated with cerebral ischemia, because rapid exclusion of a hemorrhagic etiology is critical in determining whether a patient can be treated with thrombolytic agents.33 CT can in some cases confirm the thromboembolic etiology of an ischemic stroke by showing subtle cerebral edema in a vascular distribution or by showing hyperdense clot within a thrombosed artery. It can also be immediately helpful in demonstrating mass lesions such as tumors, infections, and vascular lesions that can produce symptoms that mimic stroke and may require emergent surgical treatment.5 Small lacunar infarcts and infratentorial strokes are more difficult to visualize by CT.34
The CT appearance of an ischemic injury evolves over time. In the hyperacute stage (first 24 hours), the CT scan may be normal or demonstrate a subtle decrease in density and loss of gray-white differentiation (Figure 40-7). An artery obstructed by thromboembolism may appear hyperdense. During the acute stage (within the first week), the infarct becomes more pronounced owing to the mass effect and decreased density related to cytotoxic edema (see Figure 40-2). The infarct is better defined, involves gray and white matter, and corresponds to a known vascular territory. During the subacute stage (1–3 weeks), the edema and mass effect begin to resolve. Chronic infarcts demonstrate parenchymal replacement, with well-defined, sharply marginated zones of cystic encephalomalacia and gliosis. The infarct behaves like a contracting rather than an expanding mass.
< div class='tao-gold-member'>
Stay updated, free articles. Join our Telegram channel

Full access? Get Clinical Tree


