Rationale
Mechanical ventilation can be delivered with two extreme approaches: (a) by dictating a flow, volume, pressure, or respiratory timing (or some combination), or (b) by delivering assistance synchronized to and regulated by the patient’s neural breathing efforts. Whereas the former approach is advantageous in patients who do not breathe, the latter approach is advantageous in spontaneously breathing patients.
Almost 50 years ago, Gunaratna1 demonstrated that the problem of patients fighting the ventilator during controlled ventilation could be overcome by the use of patient-triggered ventilation. The patient-triggered ventilation was associated with immediate relief of the respiratory distress, apprehension, and agitation.
Since the 1970s, numerous modes of mechanical ventilation that aim to synchronize the ventilator and the patient have been introduced. Patient-triggered or cycled modes of ventilation are controlled by airway pressure, flow, and/or volume measured in the respiratory circuit. Significant limitations of these signals to trigger and cycle-off the assist have been documented for decades.2–12 Despite the term patient-triggered ventilation, severe patient–ventilator asynchrony occurs in at least 25% of ventilated patients13–15 and is associated with prolonged duration of ventilation. Patients with frequent ineffective triggering also tend to receive excessive levels of ventilator support13 and/or sedation.16 In newborns, compared to controlled ventilation, patient-triggered ventilation is associated with shorter duration of ventilation.17–20 Excessive assistance can cause muscle fiber injury and atrophy of the diaphragm.21,22 Conventional ventilation can induce loss of inspiratory muscle force, as much as 75%.22,23–27 Promoting spontaneous breathing28–33 and reducing sedation,34–39 alone or together,40 shortens the duration of mechanical ventilation.
Last, but not least, regulation of spontaneous breathing constitutes a very complex interaction between motor-nerve output and sensory feedback.
In summary, conventional modes of ventilation have limitations with regards to (a) synchronizing assist delivery to the patient’s neural breathing efforts; (b) bedside monitoring of patient respiratory drive and/or interaction with the ventilator; (c) adjusting the level of assist in response to patient demand; and (d) taking advantage of intrinsic lung protective reflexes.
An ideal approach, therefore, is to connect the patient’s respiratory centers to the ventilator, as naturally as the respiratory muscles are connected to the brainstem via the phrenic nerves. This notion is what set the spirit for developing the mode known as neurally adjusted ventilatory assist (NAVA).41
Basic Principles and Physiology of Electrical Activity of the Diaphragm
Figure 13-1 (left) describes schematically the hierarchy of the steps involved in generating a spontaneous breath. Respiratory neurons originating in the brainstem of the central nervous system send their signals to the diaphragm via the phrenic nerves. After neuromuscular transmission, diaphragmatic excitation occurs, where action potentials propagate along the diaphragm muscle fibers. This is the source of the diaphragmatic electrical activity (Edi) (see “Electrical Activity of the Diaphragm” below). The Edi is generated by the neural respiratory output signal and is modulated by input from multiple respiratory reflexes feeding back to the respiratory centers. The Edi signal is the primary signal used to control NAVA (Figure 13-1, right side).
Figure 13-1
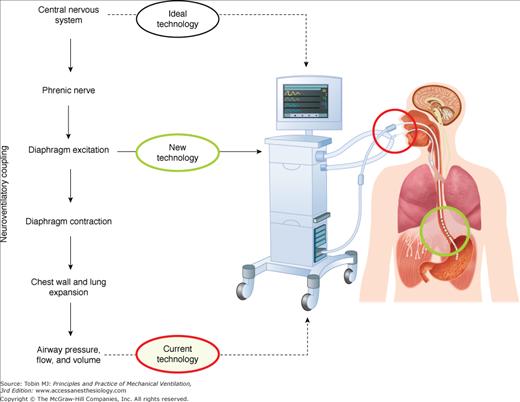
Overview of neurally adjusted ventilatory assist (NAVA). Left: Chain of events involved in spontaneous breathing, beginning with the respiratory centers in the central nervous system, then phrenic-nerve transmission, diaphragmatic electrical activity, diaphragmatic contraction, and ending with airway pressure, flow, and volume (the neuroventilatory coupling). Also indicated are the different levels of signals for ventilator control. During NAVA, electrical activity of the diaphragm is used to control the ventilator. Right side: Schematic of setup for NAVA. A feeding catheter equipped with an array of miniaturized electrodes is passed down the esophagus, where the electrical activity of the diaphragm is recorded (green circle). Diaphragmatic electrical activity is processed into a waveform, and is used for monitoring neural respiratory drive (in all modes) and for controlling the timing and magnitude of ventilator-delivered pressure during NAVA.
The latency time from stimulation of the phrenic nerve in the neck to the onset of the diaphragmatic compound muscle action potential in healthy subjects is approximately 6 to 8 milliseconds.42–45 Diaphragmatic excitation stimulates contraction of muscle fibers and causes shortening. The result of diaphragmatic contraction is expansion of the thorax, which causes lung distension and lowers pleural and alveolar pressures, thereby lowering airway pressure creating inspiratory flow. These “pneumatic” signals (pressure, flow, and volume) are used today to control conventional patient-triggered ventilation.
The time between central respiratory output to the generation of inspiratory flow in a healthy subject is approximately 26 to 28 milliseconds.42–44 Factors such as intrinsic positive end-expiratory pressure (PEEP), increased respiratory load, impaired respiratory muscle function, and reduced respiratory drive (secondary to sedation), alone or in combination, will weaken the flow signal. A weakened flow signal is more problematic to detect by the ventilator, increases the time delay to trigger the assist, and, in the worst case, fails to trigger the ventilator.
In summary, an impairment occurring at any of the steps in the hierarchy described in Figure 13-1 may result in delays, dampening, or even full blockage of the signals used to control the ventilator.
Figure 13-2 demonstrates a schematic diagram of the major neural feedback systems to the respiratory centers. Neural feedback to the respiratory centers controls respiratory motor output, and hence the Edi.
Figure 13-2
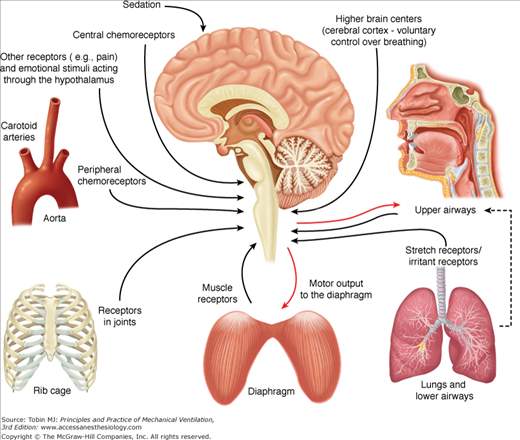
Respiratory inputs and reflexes important for NAVA. Schematic of the respiratory inputs and reflexes that can affect neural respiratory drive, and hence the motor output to the diaphragm (electrical activity of the diaphragm). The respiratory centers in the brainstem continuously receive information from the peripheral and central chemoreceptors (upper left side), receptors in the rib cage and diaphragm (lower left and lower center), stretch and irritant receptors in the lungs and lower airways (lower right), and receptors in the upper airways (top right).
For a detailed description of the lung reflexes, the reader is referred to Widdicombe46,47 and Undem and Kollarik.48
Important for NAVA is that the lungs host receptors sensitive to stretch and respond to both lung distension and deflation. Based on the response to sustained lung distension these receptors are divided into slowly adapting receptors and rapidly adapting receptors. The classic experiments by Josef Breuer and Ewald Hering in the mid-nineteenth century49 showed that lung distension shortens inspiration, or prolongs expiration, the so-called Hering-Breuer inspiratory sensitive reflex.49 They also noted that deflation of the lungs at end-expiration shortens exhalation and stimulates inspiration, the Hering-Breuer deflation-sensitive reflex.49 These reflexes are caused by slowly adapting receptors, and rapidly adapting receptors, respectively.
The rapidly adapting receptors are also stimulated by chemical stimuli and changes in lung compliance. When stimulated, the rapidly adapting receptors cause tachypnea, cough, and augmented breaths. Pulmonary edema, mediators of inflammation and immune responses, inhaled irritants, and direct tissue damage stimulate the bronchial C-fiber receptors, causing apnea, rapid shallow breathing or both, and cough. The above-described reflexes disappear with vagotomy.
Afferent feedback from the respiratory muscles exists and affects neural drive to the different individual muscles.50–52 Electrical stimulation of the phrenic nerve afferents elicits changes in phrenic efferent activity, breathing pattern, and ventilation, the so-called phrenic-to-phrenic reflex.53,54 Stimulation of the phrenic afferents can also change neural drive to the intercostal muscles, the so-called phrenic-to-intercostal reflex.55,56 Golgi tendons and muscle spindles are present in the diaphragm, albeit sparse, and provide feedback related to muscle tension and length, respectively.57 Respiratory muscle feedback partially controls respiratory drive during unloading58 and likely influences the sensation of breathing.59
Receptors in the costovertebral joints have been suggested as a primary determinant of a load-compensating reflex.60
Receptors sensitive to the concentration of oxygen, carbon dioxide, and the pH in the arterial blood are constantly modulating the breathing pattern. Activation of either the hypoxic or hypercapnic chemoreflex elicits hyperpnea (increased respiratory drive and, hence, increased Edi).61,62
The larynx contains receptors sensitive to pressure, temperature, and irritants; the laryngeal mucosa also contains C-fiber receptors or J receptors,46,47 which, when stimulated, cause cough, apnea, bronchoconstriction, and mucus secretion. Recent work by Praud et al63 suggests that feedback exists from the lungs to the laryngeal muscles.
Increases in sedation and/or analgesia depresses respiratory motor output.64
Petit et al were the first to present, in 1959, a “new technic for the study of functions of the diaphragmatic muscle by means of electromyography in man.”65 Taking advantage of the anatomy of the crural diaphragm, which forms a scarflike structure around the lower esophageal sphincter, these investigators cleverly obtained the Edi with electrodes on a catheter that was passed down the esophagus.
Considering that nearly all ventilated infants and most intubated adult patients in the intensive care unit are equipped with nasogastric feeding tubes, it was logical to follow up on refining esophageal measurements of Edi for today’s clinical use. Some of the obstacles that needed to be overcome included the development of standardized and automated methods to reduce artifacts and filtering effects related to electrode configuration and electrode positioning. Even though Lourenco et al66 had demonstrated in dogs that the crural electromyogram (EMG) and costal EMG were related to phrenic nerve activity, it was necessary to validate that measurement of Edi with an esophageal electrode relates to global inspiratory effort in ventilated patients.5
The Edi signal used for monitoring respiratory drive and for controlling the ventilator during NAVA is an “interference-pattern EMG signal,” and constitutes a temporospatial summation of motor-unit action potentials, which, in turn, represent a summation of single-fiber action potentials.
A single-fiber action potential is the extracellular potential generated by movement of ions across the sarcolemma during depolarization of a single muscle-fiber membrane. This current flow can be measured as a voltage difference over time, and when displayed as a waveform, is known as the action potential. Action potentials are “all or none” in terms of the voltage transient they generate, and they propagate along the muscle-fiber membrane to initiate contraction.
Action potentials occur because of voltage-dependent sodium-potassium channels in the muscle-fiber membrane. In humans, the propagation velocity of an action potential ranges between 2 and 6 meters per second,67 and depends on the capacitance per unit length (dependent on circumference) and the internal resistance, all passive properties of the muscle fiber. The active properties (e.g., membrane excitability) depend on ion-concentration differences and ion-channel properties, the latter affected by temperature, pH, and electrical field strength. The action potential propagation velocity is dependent on temperature, fiber diameter, pH, fatigue, and ion concentration.67–71
Given the muscle innervation scheme, single-fiber action potentials are activated in groups because a single nerve fiber innervates multiple muscle fibers (Fig. 13-3). Thus, a motor-unit action potential represents many single fiber action potentials, which secondary to synchronized initiation, results in mainly a spatial summation of their amplitudes. Motor-unit action potentials are affected by the same factors as single-fiber action potentials, but also the number of muscle fibers within the motor unit, length of the motor unit terminal, fiber-to-fiber differences in action-potential conduction velocity, and dispersion of the motor-unit fibers.72,73
Figure 13-3
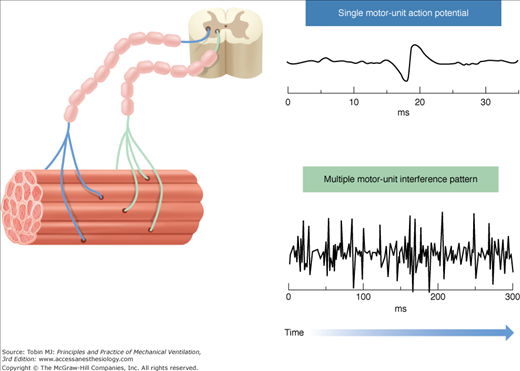
Skeletal muscle structure and the origin of the interference-pattern EMG. Left side: Representation of the structure of skeletal muscle and motor units. Two motor units are demonstrated for simplicity. A motor unit is a single motor neuron and all of the muscle fibers it innervates. Electrical activation of a single motor unit produces a motor unit action potential (top right). A spatial and/or temporal summation of the motor-unit action potentials, resulting in an interference-pattern EMG signal (bottom right), occurs when several motor units are recruited and/or their firing rate increases. The Edi signal measured during NAVA is an interference-pattern measurement of asynchronously firing diaphragmatic motor units.
Neural breathing effort modulates motor-unit firing rate and recruitment. Hence, when resulting action potentials are summed up in time (temporally) and in space (spatially), the cumulated motor-unit action potential activity (i.e., the interference-pattern EMG) yields a signal where individual motor-unit action potentials can no longer be distinguished (see Fig. 13-3). All factors affecting the individual motor-unit action potentials will influence the interference-pattern EMG, as well as the number of individual motor-unit action potentials, their synchronization, and eventual cancellation of opposite phase potentials.72,74
Optimal Edi signals depend on the use of electrodes with appropriate configuration, maintenance of electrode position and orientation relative to the muscle, and avoidance of signal disturbances.
In the context of NAVA, the Edi is measured with an array of electrode pairs placed on a nasogastric or orogastric catheter. The catheter is placed in the esophagus at the level of the gastroesophageal junction such that the direction of the electrode array is perpendicular to the crural diaphragmatic muscle fibers.75
The Edi is filtered depending on the electrode’s position with respect to the diaphragm75 (Fig. 13-4). If the electrode pair is centered at the level of the diaphragm (both electrodes receive a similar signal), the frequency increases and the power of the Edi decreases because of a cancellation effect (bipolar electrode filtering). If one of the electrodes of the pair is located at the level of the diaphragm and the second is away from the diaphragm (electrode pairs 3 and 5 in Fig. 13-4), the differential recording will be least influenced by bipolar electrode filtering and muscle-to-electrode distance filtering effects.75 For the electrode pairs even further away in either direction (channels >6 and <2 in Fig. 13-4), there will be lower signal amplitude, because of muscle-to-electrode distance filtering. Given the sequential configuration of electrodes pairs with respect to the differential amplifiers (indicated by + and – signs in Fig. 13-4, top right panel) and the fact that the diaphragm constitutes an electrical sheet with a direction perpendicular to that of the electrode array, signal waveforms obtained above the diaphragm become inversed to those below the diaphragm (Fig. 13-4 top left panel).
Figure 13-4
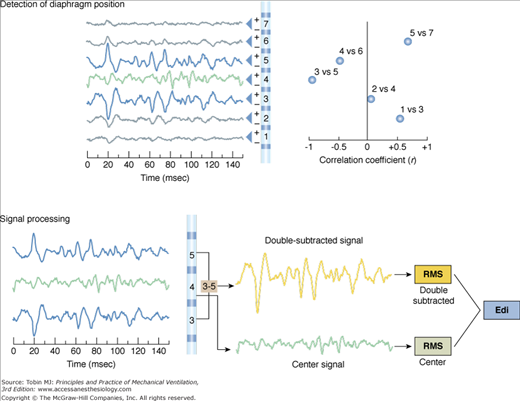
The double subtraction method. Top: Detection of diaphragm position along the array of electrode pairs. Left: Raw signals from each electrode pair (electrode array is illustrated in center). Right: The electrode pairs closest to the diaphragm are determined by cross-correlating signals from every second pair of electrodes (1 vs. 3, 2 vs. 4, 3 vs. 5, 4 vs. 6, 5 vs. 7, and 6 vs. 8, if eight electrodes are present), and the correlation (r) values are plotted (x axis) for each combination (y axis). Today, the cross-correlation algorithm is applied every 16 ms and eight electrode pairs are used. The two most negatively correlated electrode pairs are tagged (in blue, left side) for use in the double subtraction (in this example, electrode pairs 3 and 5). The “center signal” is also tagged (in green). Bottom: Signal processing. Left: The same signals that were tagged in the cross-correlation method as being above and below the diaphragm are displayed (blue) as well as the center signal (green). Right: Signal obtained after subtraction of signal from the most negatively correlated signals (electrode pair 5 and 3 in this example) yields the “double-subtracted signal” (orange tracing). The root-mean-square is calculated every 16 ms for this signal (orange), as well as the waveform at the center (green), and the two root-mean-square (RMS) values are summed (double subtracted + center values) to yield the Edi used during NAVA (grey). (Adapted, with permission, from Sinderby et al.77)
The specific design of the electrode configuration and the signal processing techniques used with NAVA have been developed and tested since the late 1980s so as to overcome the inherent difficulties associated with EMG measurements in general, as well as anatomical considerations.76
The most significant advance in the development of esophageal measurements of Edi was the use of bipolar electrodes in a sequential order and an automated processing technique to track the displacement of the diaphragm.77 Implementation of a cross-correlation technique (for every second pair of electrodes) every 16 milliseconds determines the position of the diaphragm along the array (Fig. 13-4), and subtraction of opposite phase signals above and below the diaphragm results in a new signal, the “double-subtracted” signal, free from distance filtering, and enhanced signal-to-noise ratio (Fig. 13-4).77 The root-mean-square (RMS) of this signal is calculated every 16 milliseconds, and added to the RMS of the center signal (i.e., from the electrode pair closest to the muscle78,79), as demonstrated in Figure 13-4. The resultant RMS values for every 16 milliseconds sample can be graphically connected, resulting in the Edi waveform (Fig. 13-5).
Figure 13-5
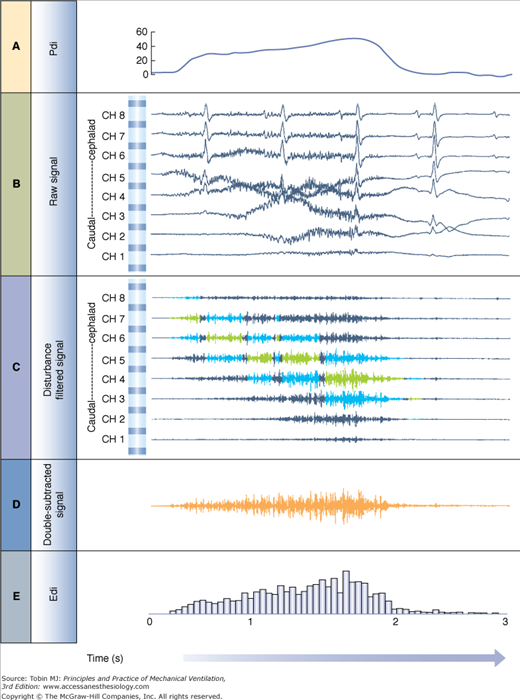
Edi signal processing during NAVA. A. Transdiaphragmatic pressure (Pdi) waveform obtained in a healthy subject performing an inspiration to total lung capacity. B. Raw signals obtained from the eight electrode pairs on the esophageal catheter during the same inspiration to total lung capacity. The electrode pair at the top is the most cephalad, whereas the one at the bottom is the most caudal (in the stomach). Note the presence of the electrocardiograms (ECGs) and slow-wave motion artifacts. C. Filtered raw signals after processing and removal of ECG and motion artifacts. Blue signals show electrode pairs above and below the diaphragm as detected by the cross-correlation algorithm described in Figure 13-4. Signals highlighted in green are the center signal as described in Figure 13-4. Note that the intensity of the signals increases throughout inspiration and moves downward with respect to the electrode pairs. D. Double-subtracted signal (orange) for the same inspiration to total lung capacity. E. Root-mean-square (RMS) values from the double-subtracted signal are plotted for every 16-millisecond segment. Note that the RMS values are plotted for the double-subtracted signal in this example from an earlier publication. Presently, the center signal RMS values are also included (as described in Fig. 13-4). (Adapted, with permission, from Sinderby et al.78)
The RMS is linearly related to how much the muscle is activated, that is, the number of motor units recruited and their firing rate,80 and under isometric, nonfatiguing conditions, reflects diaphragmatic force (up to 75% of its maximum).
Several artifacts can potentially influence the Edi waveform and need to be controlled for to avoid misinterpretation of the signal, or in the case of NAVA, miscontrolling the ventilator. Today, this is achieved automatically by the processing of the signal, and the user only needs be made aware of the artifacts’ potential impact.
As the diaphragm can move as much as 13 centimeters during spontaneous breathing at large tidal volumes,81 muscle-to-electrode distance filtering could play a role in amplitude measurements of Edi.82 Signal processing techniques and design of catheter configuration have enabled automatic control over this factor.
Motion artifacts, induced by physical movement of the electrode, are low in frequency but large in amplitude. Signals that are common to both electrodes in the differential recording (e.g., electrical noise) will be suppressed because of the bipolar electrode configuration and the double-subtraction technique.77 Esophageal recordings of Edi are particularly affected by the electrocardiogram (ECG) and the artifact should be removed from the Edi waveform, especially for the purpose of controlling the ventilator. The ECG is detected with an adaptive threshold level, and replaced by a value predicted from the previous Edi value. To further reduce electrical noise disturbances (e.g., 50 or 60 Hz) and motion artifacts and to minimize ECG and electrical activity from the esophagus, the signal is filtered with a cascade of filters.
The interelectrode distance affects the Edi signal, and hence catheters of different sizes and interelectrode distances are designed to suit different patient ages and sizes.75
A long-lived delusion was that changes in diaphragmatic configuration and length affect the Edi waveform.83 Studies now confirm that diaphragmatic length71 and chest wall configuration80,82 do not affect the Edi waveform, or its frequency content, as long as control is achieved over the above-mentioned influences.
Electrical Activity of the Diaphragm as a Monitoring Tool
The Edi waveform, as any other waveform on the ventilator, such as airway pressure or tidal volume, can be characterized by its amplitude and timing, for both the inspiratory phase and the expiratory phase. The Edi waveform has the units of microvolts (μV), generally ranging between a few μV during resting breathing to above 100 μV during maximal inspiratory efforts. Figure 13-6 provides examples of the Edi waveform in a premature infant and in an adult patient.
Figure 13-6
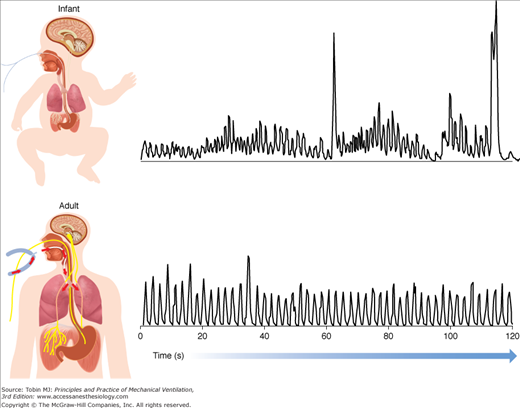
Examples of the diaphragmatic electrical activity (Edi) waveform in an adult patient and in a premature neonate. Top panel: Processed Edi waveform obtained in a nonintubated premature infant. Bottom panel: Processed Edi waveform obtained in an intubated adult. The Edi waveform in infants is characterized by larger variability in timing and amplitude, with a distinct amount of changes in the baseline, so-called tonic activity of the diaphragm. The Edi waveform in adults is generally less variable with minimal tonic Edi.
Increased Edi amplitude on inspiration (“phasic Edi”) indicates greater activation of the diaphragm. The amplitude of the Edi waveform has been shown to be related to global diaphragmatic activation80 and diaphragmatic power output84 in healthy subjects, outpatients with chronic obstructive pulmonary disease,78 and ventilated patients.5 Edi amplitude increases with worsening of respiratory status,78 reduced ventilator assist,5 reduced sedation,85 increased demand for ventilation such as exercise,79 and increased dead space.86 The opposite holds true: Edi decreases within a given subject with respiratory improvement, increased sedation, increasing levels of assist, and reducing the partial pressure of arterial carbon dioxide (PaCO2).
In a given subject, the amplitude measures of the Edi waveform can be reliably monitored and quantified, for example, during treatment and interventions. Because of anatomical differences (affecting the muscle-to-electrode distance filtering in particular), absolute Edi values can vary between subjects.78 When trending Edi values over time, it should also be kept in mind that changes in ventilator settings and sedation level influence the magnitude of Edi. The published literature on Edi monitoring and NAVA using the commercially available Servoi ventilator demonstrates peak Edi values in the range of 8 to 18 μV in adults under a variety of conditions. In one study, values as low as 2 μV and as high as 50 μV were reported when PaCO2 was manipulated by extracorporeal membrane oxygenation.87 Only one study to date has reported Edi values in children (mean values of 7 μV during NAVA).88
Edi values can be expressed relative to a maximum inspiratory effort (e.g., maximal inspiration without assist) in patients capable of performing the maneuver.78,89 Sinderby et al78 demonstrated that patients with impaired respiratory mechanics require a larger fraction of the maximum Edi to achieve the same mechanical output as healthy subjects (Fig. 13-7). Statistically, the increase in Edi with respiratory impairment also holds true for absolute values in the same type of patients.90 In patients with neuromuscular disorders, the Edi during spontaneous breathing, normalized to a maximal effort, can reveal the patient’s neural activation reserve, where a ratio at or above 0.5 would indicate extremely little reserve.78,91 In the same patient group, the absolute Edi observed during a maximal effort can provide information about changes in the total motor-unit pool, that is, a reduced maximal Edi (in μV) as the disorder progresses or vice versa. In patients with late-stage Duchenne muscular dystrophy, the absolute Edi values are low because of a reduced number of available motor units, but in relative terms, they represent approximately 50% of their maximum Edi.91
Figure 13-7
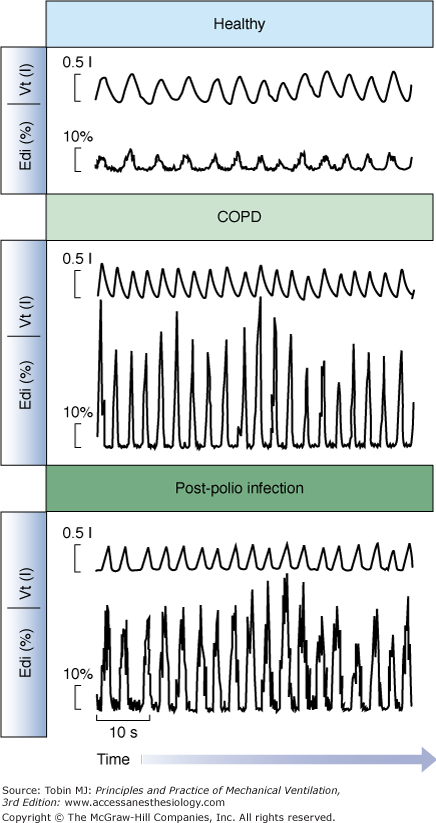
Examples of the Edi waveform and tidal volume in a healthy subject and in patients. Tidal volume and the Edi waveform are presented for a healthy subject (top), a patient with chronic obstructive pulmonary disease (middle), and a patient with prior polio infection (bottom), all breathing at rest with a mouthpiece (not on a ventilator). Note that all three subjects are breathing with a tidal volume of approximately 500 mL, although diaphragmatic activity required to achieve this tidal volume is eight times higher in the patients than the healthy subject. A higher Edi per milliliter indicates a worsened neuroventilatory efficiency. (Adapted, with permission, from Sinderby et al.78)
If the Edi persists after the end of an inspiration, the amplitude of the Edi waveform can be quantified (the so-called tonic Edi).92 The presence of tonic Edi indicates continuous and elevated activation of the diaphragm between respiratory cycles (see Figs. 13-6 and 13-8). Studies in infants and animals suggest that elevated tonic Edi is a reflex response induced by lung derecruitment or removal of PEEP.92–94 Experimental vagotomy abolishes this reflex.93,94 Healthy subjects and adult mechanically ventilated patients show little, if any, tonic Edi.78,95,96
Figure 13-8
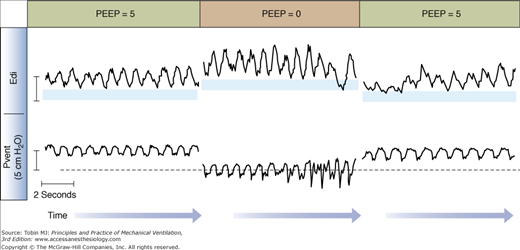
Impact of removal of positive end-expiratory pressure (PEEP) on tonic Edi. Example of tracings of ventilator-delivered pressure (Pvent) and diaphragmatic electrical activity (Edi) obtained in one intubated and mechanically ventilated infant on synchronized intermittent mandatory ventilation (only the spontaneous breaths in between mandatory breaths are displayed). The amount of tonic Edi (blue horizontal bars) increases with brief removal of PEEP (center). (Reproduced, with permission, from Emeriaud et al.92)
Besides amplitude parameters, the Edi waveform can be used to quantify the timing of the neural breathing pattern, such as neural inspiratory time, neural expiratory time, and neural respiratory rate.
If the catheter position has been deemed appropriate and functioning, a flat Edi waveform at zero μV indicates no diaphragmatic activation. This could be caused by numerous pathologies, including central apnea (no respiratory motor output, or suppressed respiratory drive secondary to mechanical ventilation-induced hyperventilation or sedatives), phrenic nerve damage, or neuromuscular transmission failure.
Monitoring Patient–Ventilator Interaction in Conventional Modes of Ventilation Using the Electrical Activity of the Diaphragm
The Edi waveform is considered the reference standard for monitoring patient–ventilator interaction.4,5,9,15,97,98 During conventional ventilation, when the Edi waveform is simultaneously displayed and superimposed with the airway pressure waveform, it provides immediate bedside information about the interaction between the patient and the ventilator.
An extreme case of poor patient–ventilator interaction is when a patient makes a neural inspiratory effort (Edi waveform starts to increase) and the ventilator does not deliver a breath (Fig. 13-9, top left)—often termed “wasted inspiratory efforts.” In the example provided, wasted efforts occurred frequently (red arrows) during pressure control (PC) ventilation.
Figure 13-9
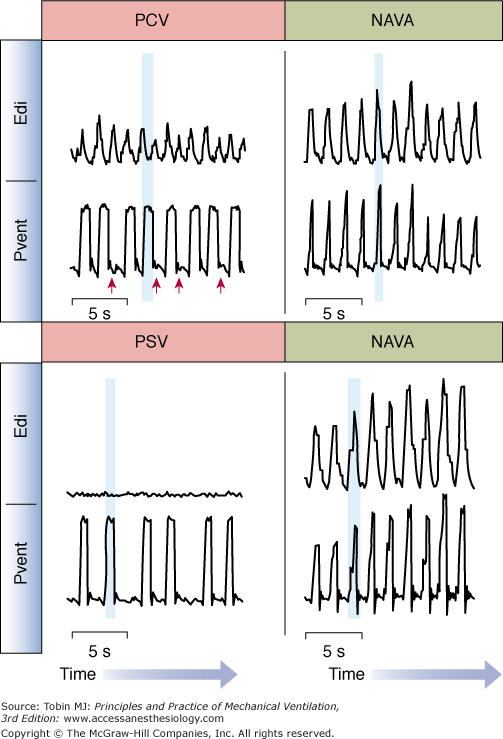
Patient–ventilator interaction during conventional ventilation and during NAVA. Top: Waveforms for Edi and ventilator-delivered pressure (Pvent) for an intubated adult patient breathing on pressure-control ventilation (PCV, left) and neurally adjusted ventilatory assist (NAVA, right). During PCV, there was a significant amount of wasted efforts (indicated by red arrows). During PCV, the delivery of assist (shaded vertical blue bar) occurred during neural exhalation, indicating poor patient–ventilator interaction. During NAVA (right panel), there were no wasted efforts and the assist was delivered during neural inspiration (vertical blue shaded bar). Bottom: Waveforms for Edi and ventilator-delivered pressure (Pvent) for an intubated adult patient breathing on pressure-support ventilation (PSV, left) and neurally adjusted ventilatory assist (NAVA, right). During PSV, too sensitive trigger settings, and too high levels of assist resulted in ventilator-induced hyperventilation and elimination of the Edi. The assist continued to be triggered and delivered (blue shaded vertical bar), despite no activation of the diaphragm. During NAVA (right panel), Edi controls the ventilator, and cannot be suppressed by ventilator-induced hyperventilation. (Adapted from Sinderby et al,85 with the kind permission of Springer Science+Business Media.)
At the other extreme of poor interaction is delivery of a ventilator breath when the diaphragm is not active. In Figure 13-9 (bottom left), the diaphragm is not activated during the delivery of pressure-support ventilation (PSV). This situation can be a result of too-sensitive trigger settings and too-high levels of assist.
The differences in timing between Edi and ventilator pressure can be quantified for the start (triggering delay) and end (cycling-off delays) of the assisted breaths. Trigger delays are defined as the time interval between the onset of neural inspiratory effort and the onset of the ventilator breath. In Figure 13-9 (top left), the assist (shaded) can be seen to begin long after the start of neural inspiratory effort. Trigger delays can result from patient characteristics (such as hyperinflation) or ventilator characteristics (trigger sensitivity, trigger algorithms, valve performance).
Cycling-off of a ventilator breath, in healthy subjects, should coincide with the end of neural inspiration. Cycling-off is asynchronous when the ventilator breath terminates while the subject is neurally inspiring (premature cycling-off) or if it cycles-off long after the onset of neural exhalation (delayed cycling-off) (Fig. 13-9, top left). In PSV, pneumatic cycling-off algorithms are designed to sense a decrease in flow relative to the peak inspiratory flow. This makes the ventilator cycling-off dependent on the ratio of the time constant of the respiratory system to neural inspiratory time, and the ratio of the pressure support to maximal inspiratory pressure.99
Double-triggering can also be detected with the Edi,98 and can be defined as the delivery of two ventilator breaths for one neural effort. During volume control ventilation or PSV, double-triggering results in the delivery of two full breaths, and could result in “breath stacking” and delivery of higher-than-targeted volumes or pressures.100


