(14.1)
Fig. 14.1
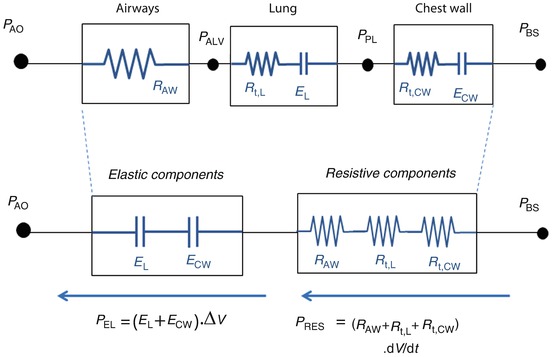
Model of the entire respiratory system (see text for details). Pressures are indicated at specific points, circles represent pressure generators, rectangles represent passive components, and arrows indicate pressure differences. In this electric- or hydraulic-like representation, the total pressure acting on elements in series is the sum of the pressures acting on the single components, while the flow and volume changes are the same across the system. P BS body surface pressure, P AO airway opening pressure, P VENT sum of the driving pressure necessary to move air into the thorax (ΔP), and the positive end-expiratory pressure (PEEP), PALV alveolar pressure, PPL pleural pressure P MUS pressure generated by the respiratory muscles
P VENT, in turn, is the sum of the driving pressure necessary to move air into the thorax (ΔP) and the positive end-expiratory pressure (PEEP). PMUS is the pressure generated by the respiratory muscles, with the inspiratory muscles producing a decrease in intrathoracic pressure and expiratory muscles an increase.
Considering a mechanical model of the respiratory system, the pulmonary system (composed of the airways and the lung) and the chest wall have to be considered as structures arranged in parallel, while if an electrical (or hydraulic) model is considered, like the one shown in the figures of the present chapter, they are in series. This means that, at least as a first approximation, the pulmonary system and the chest wall share the same volume (V) and volume variations (dV/dt), and the total pressure applied to the respiratory system (P RS) is subdivided into the “transpulmonary” pressure (P TP, i.e., the pressure difference from airway opening to pleural space) and the “thoracic” pressure (P CW, i.e., the pressure difference from pleural space to body surface) (Fig. 14.2).
(14.2)
Fig. 14.2
Model of the passive components of the entire respiratory system, divided into the pulmonary system (in turn, composed by airways and lung) and the chest wall. P PL pleural pressure, P ALV alveolar pressure, P TP transpulmonary pressure, P CW thoracic pressure, RPULM pulmonary system resistance, R AW airway resistance, R t, L. lung tissue resistance, R t, CW chest wall tissue resistance, EPULM pulmonary system elastance, E L lung elastance, E CW chest wall elastance, CPULM pulmonary system compliance, C L lung compliance, and CCW chest wall compliance
See legend of Fig. 14.1 for all the other symbols
Although the significance of Eq. 14.2 is very important, it is often disregarded and is barely considered in the clinical practice when managing ARDS patients. The relevant distending pressure for the lung is PTP [5], but also the chest wall, through the pressure in the pleural space (P PL), plays a significant role in determining lung expansion and stress as well [6, 7]. As shown in Eq. 14.2, if P PL is known, P TP and P CW can be determined. While measuring P AO is relatively simple (all that is required is a lateral pressure tap in a mouthpiece or a section of ventilator tubing, see below), however, measuring P PL in living patients is not. P PL has been estimated in the human physiology laboratory for more than 50 years from measurements of esophageal pressure (P ES) [8, 9]. Most of the existing literature in which P ES is used to estimate P PL, however, reports data obtained with the subject under analysis either in seating or standing position. When the analyzed subject is in supine or prone position, artifacts caused by mediastinal weight and postural effects have to be considered.
Transpulmonary pressure is the sum of the pressure drop across the airways (P AW, i.e., the pressure difference from airway opening to alveolar space) and lung pressure (P L, i.e., the lung “transmural” pressure, pressure difference from alveolar space to pleural space):
(14.3)
Under dynamic conditions, namely, when airflow is present and dV/dt is different than zero, PAW is different than zero. Only under static conditions P AW = 0, and therefore P TP = P L.
P RS depends on the mechanical properties of the respiratory system, namely, resistance and elastance, while the “inertance,” i.e., the capability to store some energy in the kinetic, form is usually considered negligible, with the exception of the case of high-frequency forced ventilation, where it might play a significant role.
The elastic behavior of the respiratory system is everything that makes it spontaneously returning to an equilibrium position. It is described by elastance or its inverse, the compliance, and it depends mostly on the elastic properties of lung and chest wall tissues. Lung tissues consist mainly of elastin and collagen, structural proteins that have different responses to deformation. The former react to deformation as springs and, up to a certain degree of extension, show a linear behavior. The latter are sort of “safety cables,” which are entangled in a disordered way in the lung at rest. Collagen fibers do not play any role in the mechanical behavior of the lung at lung volume close to rest, while with increasing lung volume, more and more fibers reach their maximal length, determining a firm increase of lung elastance. The chest wall, namely, all the structures and tissues surrounding the lung and moving with it (rib cage and abdomen), also contributes to the elastance of the respiratory system [4]. The sum of all the elastic forces acting on the respiratory system is expressed by the elastic pressure.
Pel, which is proportional to volume V (deviation from the equilibrium position, i.e., deviation from equilibrium volume V 0) by means of elastance ERS.
With resistance of the respiratory system (R RS), all those phenomena that oppose to deformation of the respiratory system, thereby dissipating a given amount of energy, are considered. Dissipation means that the energy supplied to the system (work performed by the respiratory muscles) or stored as potential energy (e.g., during mechanical ventilation) is lost as heat. The main source of resistance corresponds to the flow of air through the airways. Due to the viscous effects, most energy provided to the system to ventilate is actually lost as heat in the air. R RS, however, is due not only to the flow resistance of the airways but also contains a significant contribution from the lung (R t, L) and chest wall (R t, CW) tissues. When lung and chest wall tissues are stretched, in fact, their constituent fibers, cells, and fluids move against each other and this internal friction produces heat representing another form of dissipation [4].
The sum of all the resistive forces acting on the respiratory system is expressed by the resistive pressure P RES, which is proportional to volumetric flow rate dV/dt (also known as volume flow rate, rate of fluid flow, or volume velocity) by means of resistance R RS.
In summary, the total pressure acting on the respiratory system, P RS, is given by the sum of the elastic pressure (P EL), resistive, (P RES) and inertial (P INERT) components (Fig. 14.3). Being P INERT ≈ 0, it follows that
(14.4)
Being the pulmonary system and the chest wall mechanically in parallel, total respiratory system elastance and resistance are equal to the sum of pulmonary and chest wall elastances and resistances:
(14.5)
Lung compliance (C L), defined as the change in lung volume per unit change in P L, is of particular importance in ARDS and is sometime referred as either “static” or “dynamic,” depending on the method of measurement adopted to obtain it (see below). Nevertheless, compliance represents a property that is only static, i.e., it expresses the distensibility of the lung. Lung compliance in ARDS is decreased due to diffused alveolar damage and loss of cellular integrity of the alveoli which are filled with proteinaceous edema fluid that also results in dilution and dysfunction of pulmonary surfactant, leading to alveolar collapse [10], and causes compliance to decrease in inverse proportion to the fraction of lung volume that has been lost by derecruitment, i.e., the fraction of the lung to become blocked from receiving ventilation.
Transpulmonary pressure is the relevant distending pressure for the lung [5]. This concept, however, is often disregarded, and the effect of the chest wall in determining lung expansion and stress is barely considered in the clinical practice [6, 7].
Nevertheless, in ARDS patients, it is common that not only the lung but also the chest wall compliance is abnormally low due to the presence of obesity, increased abdominal pressure, chest wall deformities, and resuscitation with large fluid volumes [11, 12, 13].
It must be noted again that only if the pressure in the pleural space (P PL) is estimated by measuring P ES, C L and C CW can be determined separately. When P AO is measured, the parameters E and R pertain to the entire respiratory system, which includes both the lungs and the chest wall, and therefore it is impossible to identify the separate contribution of the lung and chest wall to the stiffer respiratory system.
Due to several mechanisms, the elastance and compliance of both the lung and the chest wall and, therefore, of the respiratory system are not the same at different lung volumes, in other words the elastic behavior is not linear. The presence and amount of surfactant molecules at the air–liquid interface cause surface tension to vary with lung volume in determining lung hysteresis (i.e., the pressure at a given lung volume is different during inflation compared to deflation) and significant nonlinear mechanical behavior.
14.3 Methods for Assessing Respiratory Mechanics
The methods employed to assess respiratory mechanics in ARDS patients can be classified into two categories: static, or quasi-static, and dynamic.
14.3.1 Static Methods
Static, or quasi-static, methods are based on specific maneuvers that require to discontinue the patient from the normal setting of mechanical ventilation and to provide an estimation of compliance, and eventually resistance. Traditional techniques like the super syringe or the constant flow for P–V curve assessment and end-inspiratory occlusion can be classified under this category. Because these methods are able to estimate only a single value of compliance and resistance, they need to be repeated periodically in order to have the information regarding variations occurring over time in a given ARDS patient.
In a sedated ventilated patient, the pressure developed by the respiratory muscles (P MUS) is equal to zero, and therefore PRS is only given by the pressure generated by the mechanical ventilator (P VENT) and Eq. 14.1 becomes
Therefore, bringing the respiratory system to a given volume by applying a given pressure, compliance can be determined by measuring the pressure that under static conditions (e.g., by interrupting the flow at end-expiration) equals P EL and by applying Eq. 14.4 in a situation where P RES = 0.
The resistance can be determined, in turn, by calculating the pressure (P RES) that has to be added to PEL to reach peak inspiratory pressure just before interrupting the flow.
The measurement of esophageal pressure (P ES), used as an estimate of pleural pressure (P PL), is the only way to distinguish between the pulmonary system (comprising the airways and the lung) and the chest wall. When P ES measurement is available during an end-inspiratory occlusion maneuver, its plateau pressure can be used to evaluate chest wall elastance (E CW) (Fig. 14.4), which can be significantly high in patients with ARDS as a result of intra-abdominal hypertension, pleural effusion, massive ascites, thoracic trauma, and edema of the intrathoracic and intra-abdominal tissues as a result of fluid resuscitation [14. 15, 16, 17].
Fig. 14.4
(a) Representative example of airway opening pressure (P AO), flow, and volume tracings obtained during a standard breath (volume-controlled mode with a constant flow) followed by an occlusion maneuver. Rapid interruption of airflow at the airway opening is performed using a mechanical ventilator equipped with facilities for end-inspiratory occlusion. Total respiratory system compliance (C RS) is obtained as the ratio between tidal volume (ΔV) and elastic pressure P EL (difference between plateau pressure Pplat, measured after a few seconds of occlusion, and PEEP). Total respiratory system resistance (R RS) is obtained as the ratio between resistive pressure PRES (difference between peak inspiratory pressure, PIP, and Pplat) and inspiratory flow V’ INSP. The patients are sedated and paralyzed (P MUS=0, respiratory muscle generator switched-off in the figure). (b) Representative example of airway opening pressure (P AO), esophageal pressure (P ES), and flow and volume tracings obtained during an occlusion maneuver. Chest wall compliance (C CW) is obtained as the ratio between tidal volume (ΔV) and elastic pressure of the chest wall P EL, CW (difference between PES plateau pressure and P ES at end-expiration. The patients are sedated and paralyzed (P MUS=0, respiratory muscle generator switched-off in the figure)
It must be noted that adjusting the ventilator settings only on the basis of P AO may be incorrect [18], being P TP the real “lung-distending” pressure promoting alveolar recruitment and lung inflation.
Moreover, in patients with ARDS, the reduced chest wall compliance, the presence of edema, or abdominal distension makes Pes very often elevated. Therefore, the calculated P TP can be negative at end-expiration, this indicating closed airways, or flooded or the atelectatic lung, and in this case, PEEP must be increased until P TP becomes positive to keep the airways open.
Super-Syringe Technique
The static reference method is the super-syringe method (Fig. 14.5a) [19]. Fixed increments of gas volume up to a total volume of 1.5–3 liters are applied to the patient. After each increment, the static airway pressure is measured during a pause of a few seconds when there is no flow, and the pressure is the same in the entire system from the super syringe to the alveoli. The lung is then deflated in a similar way, and the inflation and deflation P–V curve is plotted. Oxygen consumption is constant during the whole procedure (i.e., inflation and deflation), which takes 45÷120 seconds. During inflation carbon dioxide removal from the alveoli is null, and its partial pressure in the blood increases. During deflation, carbon dioxide removal is therefore lower than baseline, and this causes expired volume to be less than inspired volume and the P–V curve has a marked artifactual hysteresis. In ARDS patients, alveolar recruitment taking place during the stepwise inflation to a high pressure will also cause hysteresis [20, 21].
Fig. 14.5
(a) The super-syringe technique is a static method consisting of inflating the lungs in volume steps (ΔV in the figure) of 50–100 ml up to 1.5–3 liters, starting from the functional residual capacity (FRC). The volume of gas administered (with fractional inspired oxygen of 1.0) is determined by the displacement of the piston. Airway opening pressure (P AO) is measured at the connection of the endotracheal tube by a pressure transducer, with zero referred to the atmospheric pressure. The patients are sedated and paralyzed (P MUS = 0, respiratory muscle generator switched-off in the figure). The pressures and the volumes are recorded simultaneously, and the pressure–volume curve is constructed from the different plateau pressures that correspond to the administered volumes. The entire procedure takes about 60 s. A similar maneuver can be performed during deflation in successive steps (not shown in the figure). (b) An alternative, simple technique to obtain a pressure volume curve from an ARDS patient without having to disconnect the patient from the ventilator is to inflate the respiratory system by a constant flow delivered by the ventilator [23, 24]. This quasi-static technique can be performed on any intensive care ventilator that is equipped with a constant flow generator. (c) Several studies have been performed to compare the quasi-static technique at constant flow with the static technique [25–27]; the results showed that the compliances obtained by the two methods are very similar. An important parameter to be defined is the value of delivered constant flow. High constant flows (between 20 and 60 L/min) reliably estimate only the slope of the P–V curve, while upper and lower inflection points are overestimated because of the resistive effect (Fig. 14.2) [23, 24]. While very low flow allows accurate estimates, long measurement periods are required to inflate the lungs, which may result in a loss of lung volume during the maneuver because of oxygen uptake by the lungs
Multiple Occlusion Technique
The multiple occlusion technique [22, 23] uses a sequence of different-sized volume-controlled inflations with an end-inspiratory pause to allow semi-static pressure measurements. Intrinsic PEEP is determined before each inflation to ensure that the lung volume and the end-expiratory pressure are stable. Pressure and volume are plotted for each end-inspiratory pause to form a static P–V curve. If expiratory interruptions are also done, a static expiratory P–V curve is obtained. Because the pressure and volume values are obtained during standard, but varying breaths, the artifacts caused by gas exchange do not occur, and no hysteresis is found even in ARDS patients. Although the largest tidal volumes used with this technique may cause recruitment, this is limited because the time at high pressure is very short. The entire set of measurements may take 5÷10 min.
The inspiratory occlusion technique offers the advantage of avoiding disconnection of the patient from the ventilator, and it allows measurements from any level of PEEP. Since the beginning of the 1990s, this technique has been extensively used to determine the lower and upper inflection points on the P–V curve [24, 25] and to quantify the effect of PEEP on alveolar recruitment in patients with ARDS [26]. The sudden change in pressure occurring with interruption of flow is accompanied by rapid damped oscillations and a subsequent further transient change in pressure to a stable plateau. These two phases have been interpreted on the basis of two-compartment models of respiratory mechanics [27, 28].
Low-Flow Inflation Technique
In the low-flow inflation technique [29, 30], a very low constant inspiratory flow is provided to the patient to generate a large total volume (Fig. 14.5b). The low flow causes a minimal but recognizable pressure decrease over the endotracheal tube, which means that the pressure–volume curve obtained under this “quasi-static” (dynamic, in truth) condition is shifted to the right with respect to a “true” static P–V curve (Fig. 14.5c). The amount of this shift depends on the resistance offered by the respiratory system, plus the resistance of the endotracheal tube, and the selected flow level. A high flow reduces the time required to obtain the curve, but it increases the shift. The slope of the curve, however, can be considered parallel with the true static P–V curve, under the hypothesis that airway resistance is constant throughout the inspiration, which is not true as resistance decreases with the lung volume. A low flow allows to reduce the shift, but the duration of the inspiration becomes long and the gas exchange artifacts above described for the super-syringe technique become significant. Other drawbacks of the low-flow inflation method are that this technique does not allow to obtain the deflation curve, it requires resetting the ventilator, and only volume-controlled ventilation can be used.
Related posts:


Stay updated, free articles. Join our Telegram channel

Full access? Get Clinical Tree


