Monitoring during Mechanical Ventilation: Introduction
Patients are admitted to an intensive care unit (ICU) for two main reasons. One is for delivery of mechanical ventilation, the varied aspects of which are the subject of this book. The second is to observe a patient more closely than is possible on a hospital ward; that is, to avail of specialized devices used for the monitoring of vital functions (and of staff who have expertise in their operation).
The literature published on these two subjects constitutes the unique corpus of knowledge required for the expert practice of intensive care medicine. Management of some critically ill patients is based on knowledge outside these two areas, such as patients with acute gastrointestinal bleeding or acute renal failure. The principles for managing such conditions have been developed by physician-investigators within the relevant subspecialties rather than by intensive care physicians. Beyond the areas of mechanical ventilation and monitoring, an intensivist seeking the most authoritative writing on a subject must turn to articles and texts published by nonintensivists.
Patients receiving mechanical ventilation are exposed to the full range of monitoring devices. An in-depth discussion of each device would require as much space as the rest of this book. For such discussions the reader is referred to the companion text, Principles and Practice of Intensive Care Monitoring.1 Rather than attempting a synopsis of each individual monitoring technique, this chapter provides a bird’s-eye view of the subject. We map out the territory of monitoring through discussion of its goals, the principles of measurement, usefulness of monitoring in various settings, the forms of clinical reasoning used in interpreting generated data, evaluation of the benefit of monitors, and the problems in designing studies that attempt such evaluations. To give a sense of the detailed contours of the terrain being traversed, we offer specific examples of how the general topics relate to the everyday use of monitors.
What Is Monitoring?
An unsatisfactory—and embarrassing—aspect of writing about monitoring is the absence of a generally accepted definition. A definition tries to set criteria that demarcate the boundaries between concepts (or things) so as to prevent overlapping or confusion, and has the goal of providing order or a clear understanding.
The word monitor comes from the Latin monere, which means “to warn.” This meaning connotes one goal of monitoring, to provide an alert, an alarm. But monitors serve other functions. Monitors replicate many of the characteristics of diagnostic testing, and interpretation of the generated data must comply with the scientific principles developed for use of diagnostic tests. Thus, it might seem reasonable to define monitoring as the serial performance of diagnostic tests at frequent intervals. But how should we demarcate the frequency at which measurements are repeated? Certain signals have such a high-frequency content that obtaining fifty measurements in a second is insufficient to capture a critical data point.
Goals of Monitoring
The major goals of monitoring are to continuously measure key variables that enhance understanding of a patient’s underlying disease state, to aid with diagnosis, and to guide management.1 To accomplish these goals, the monitor should measure a variable that is pertinent to the disease process, be technically accurate, provide interpretable data, be practical for use, and not cause harm.1,2 The ability of today’s monitors to meet these goals depends largely on two factors: whether a monitor is capable of accurately measuring the function or disease manifestation in question, and whether the recorded information will help improve patient outcome. Inextricably linked to these two factors is the caregiver’s ability to interpret data, integrate data from multiple sources, discard data that are not important, and then make a wise judgment about diagnosis and therapy.
Accuracy of Measurements
Advances in electronic and computer technology over the last 30 years have generated several monitoring systems that are accurate and easy to use. To know how to operate a machine and interpret the provided data, a physician needs much more than a manufacturer’s manual. The physician needs to know the principles of the monitoring device, how to operate it, the reliability of the measurements, indications and contraindications, complications with use of the device, and how to troubleshoot problems as they arise.
To determine whether the data generated by a monitor are valid, a physician needs to have a basic understanding of measurement theory and its applications. For an extensive review of the science of measurement, the reader is referred to the chapter by Chatburn3 in the companion book, Principles and Practice of Intensive Care Monitoring.4
Every measurement has errors. Accordingly, the observed measurement is a mixture of the true value and the error. Errors can be systematic or random. Systematic error (also termed bias) is the difference between the mean value of repeated measurements and the true value. Systematic errors occur in a predictable manner; they cause measurements to either consistently underestimate or consistently overestimate the true value (Fig. 48-1A). These type of errors are not affected by repeated measurements but can be reduced by proper calibration.
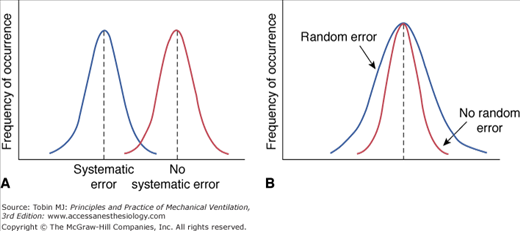
Random error (a measure of the imprecision of a measurement) is the difference between the mean of the sample and the measurement of individual values. Random errors occur in an unpredictable manner because of uncontrollable factors; they cause measurements to both underestimate and overestimate the true value (see Fig. 48-1B). Increasing the number of measurements can reduce random errors.3 Figure 48-2 illustrates the effects of bias and imprecision (systematic and random errors) on measurements.
Figure 48-2
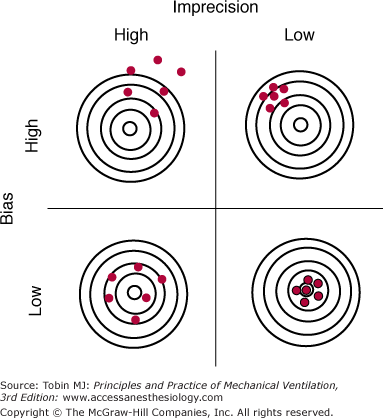
The effects of bias and imprecision (systematic and random errors) on measurements using the analogy of target practice at a rifle range. When bias is low, measurements (red circles) group around the true value (bull’s-eye). When imprecision is low, the cluster of measurements is tight and the random error of repeated measurements (rifle shots) is small. Ideally both bias and imprecision are low, resulting in a small total error for repeated measurements. (Used, with permission, from Chatburn.3)
Accuracy is the ability of a measuring device (or monitoring technique) to capture the true value of a quantity. When assessing accuracy, researchers commonly compare a new method with an established method to determine whether the new method can replicate the established method (Fig. 48-3).
Figure 48-3
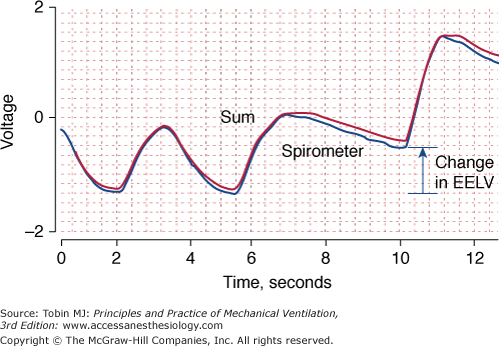
Changes in end-expiratory lung volume measured simultaneously with a calibrated respiratory inductive plethysmograph (red) and a spirometer (blue), the reference instrument. The two signals are almost superimposed upon one another indicating good agreement between the two techniques. EELV, end-expiratory lung volume.
Accuracy is usually expressed as a percentage of the full scale. In today’s ventilators, pressure-measuring systems have an accuracy of ±2 cm H2O plus 4% of the signal. In other words, if the true pressure is 25 cm H2O, the displayed pressure could be anything between 22 and 28 cm H2O.5 In contrast, the accuracy of flow sensors within ventilators varies much more—from ±1% to ±20% of the setting, depending on the ventilator.6 Despite their common use, remarkably little information on the accuracy of flow-measuring and pressure-measuring devices has been published in peer-reviewed journals; in general, users must resort to data on accuracy provided by the manufacturers.
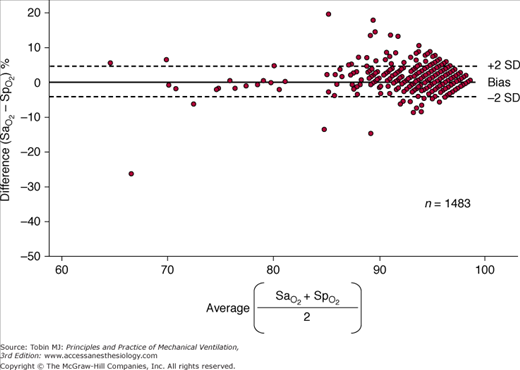
The monitoring device that has been studied the most in critically ill patients is the pulse oximeter. Compared with the measurement standard (a multiwavelength Co-oximeter), pulse oximeters have a mean difference (bias) of less than 1% and a standard deviation (precision) of less than 2% when arterial oxygen saturation ( ) is 90% or above (Fig. 48-4).6–8
Figure 48-4
Differences between arterial oxygen saturation ( ) measured by a blood-gas analyzer and oxygen saturation measured by pulse oximetry (
 ) plotted against the average O2 saturation in 102 critically ill patients. The solid line is the bias and the dashed lines are 95% confidence intervals. Mean difference (bias) between two measurements is small. SD, standard deviation. (Reproduced, with permission, from Van de Louw A, Cracco C, Cerf C, Harf A, Duvaldestin P, Lemaire F, et al. Accuracy of pulse oximetry in the intensive care unit. Intens Care Med. 2001;27:1606–1613. With kind permission from Springer Science and Business Media.)
Precision is the ability of a monitor to display the same value repeatedly assuming that the actual quantity has not changed; that is, the degree of consistency between repeated results. Precision is usually expressed in terms of variance, standard deviation, or confidence intervals. In ventilated patients, the precision (quantified as standard deviation) of pulse oximetry in measuring oxygen saturation,  ) is less than 1.2% when
  is greater than 90%, and it increases to 2.7% when
  drops to 90% or less.6–8
Reproducibility is the ability of the monitoring technique (or device) to maintain its precision during long-term use. Knowing the reproducibility of a measurement is important for judging whether a change is truly of clinical significance. The reproducibility of the thermodilution technique in measuring cardiac output, quantified as the ratio of standard error to average cardiac output, varied between 2% and 5% when measurements were repeated (an average of three times), and varied between 2.5% and 8.7% for single measurements.9 Thus, before concluding that a change in cardiac output is clinically significant, a clinician would need to observe a 12% to 15% difference between repeated determinations (three measurements per determination).
A technique may yield reproducible measurements at one sitting, but be unreliable when employed by a different investigator or on a different day. In ventilated patients, a single investigator obtained highly reproducible measurement of maximal inspiratory pressure at a single sitting: The coefficient of variation for triplicate efforts was 11%.10 When different investigators undertook the measurements, however, the coefficient of variation was 32% ± 4%, despite the measurements being obtained in the same patient and on the same day.
A device is considered linear when a plot of output data from the device (the measured values) versus the input data (the known values) can be fitted with a straight line. Occasionally, a system measures pressure accurately only over part rather than the entire range of pressures; that is, the system is alinear (Fig. 48-5). Alinearity may occur because the given transducer is not designed for use over the entire range or because it is not functioning properly.
Figure 48-5
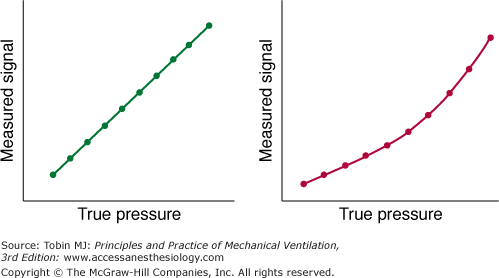
A measured pressure signal plotted against a reference measurement of pressure (“true pressure”) in a linear (left panel) and nonlinear (right panel) pressure-measuring system. (Used, with permission, from Gallagher.5)
Calibration is the process of adjusting the output of a device to match a known input value. Thus, systematic error is minimized. Calibration is considered static when pressure is changed in steps and each step is maintained long enough to achieve a stable signal output. For a linear measurement system, calibration is a simple two-step procedure (Fig. 48-6). First, the readout is set at zero while no input signal is applied to the instrument. If an offset error occurs, it is adjusted. For a flow-sensing device, the flow sensor is occluded and a reading of no flow should result. If some flow is registered, the readout is adjusted to zero to correct for the offset error. Next, sensitivity (gain or slope) is set by applying an input signal of known value (say 12 L/s from a rotameter), preferably at the upper end of the output range; the readout on the flow sensor is then adjusted to read 12. If the system is linear, the readouts for all input values between these two calibration points will be accurate.
Figure 48-6
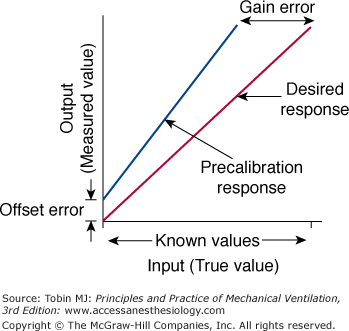
The two-point calibration procedure. First, the readout on the instrument is adjusted to read zero to overcome offset error. Then, the gain is adjusted to read the desired response. See text for details. (Used, with permission, from Chatburn.3)
The dynamic response of a measurement system, such as a pressure transducer, is typically tested using a square wave (or sinusoidal) pressure generator. A step change in pressure is followed by a brief delay before the measured pressure begins to change.11–14 The amplitude of the test should be within ±5% of the amplitude of the reference system at the highest frequency tested. The phase lag is the temporal difference between the two systems.
A major challenge in interpreting data from monitors is to determine which data constitute truth and which constitute artifact. Although both systematic and random errors can cause artifact, the major source of error in biologic research is systematic errors.15
Zero offset error occurs when the zero point is not correctly set during calibration but the gain is correct. Consequently, the instrument will read consistently either an inaccurately low or an inaccurately high value over the entire scale. Drift error is a form of time-dependent offset error in which the changes occur over time. The zero point can also change secondary to patient movement without staff being aware.
Range errors occur when the true value of the input system is beyond the operating range of the device. Signals that are either below or above the calibrated scale value may be clipped (the displayed value is different from the true value) (Fig. 48-7).
Figure 48-7
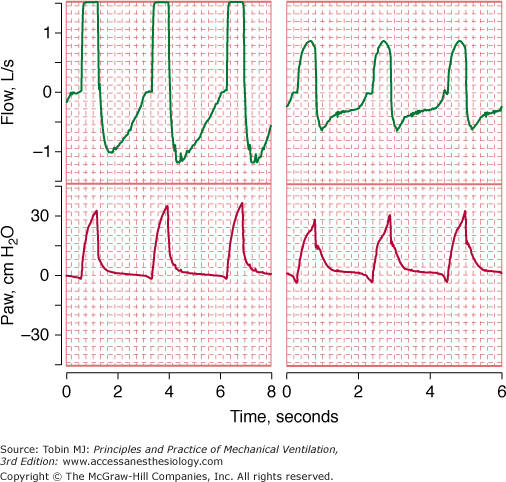
Flow and airway pressure in two patients receiving assist-control ventilation at a flow rate of 60 L/min. For the patient in the left panel, the flow signal is “pinned” or “clipped.” The clipping of the flow signal in the left panel was caused by clogging of the pneumotachograph with secretions.
Response time is the time that a monitoring device takes to respond to a step change in a recorded physiologic variable. The 90% response time is the time from the step change in pressure until the measured signal settles within 10% of its final value. The response time for a pulse oximeter probe varies with its location. Probes placed on the ear respond more rapidly than probes on the finger.16–18 During calibration of a monitoring device, a slow response time causes error if the user does not allow sufficient time for the instrument to stabilize at the known value.
Frequency response is an instrument’s ability to accurately measure an oscillating signal. When the frequency of a signal increases, a measurement system will generate either an underestimate (attenuation) or overestimate (amplification) of the true amplitude of the signal. An optimally damped system will measure all signal frequencies within the working range with equal amplitude (Fig. 48-8).
Figure 48-8
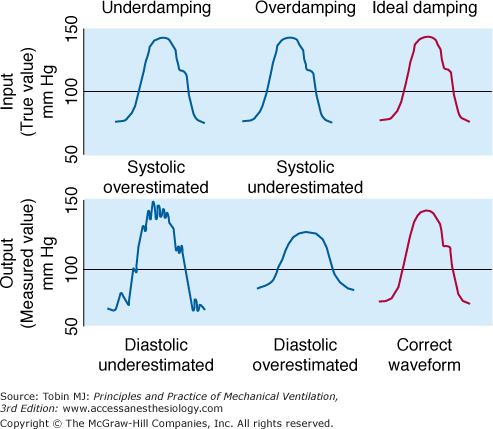
Effect of three different blood pressure transducers, which exhibited different damping characteristics, on the measurement of blood pressure. (Used, with permission, from Chatburn.3)
A system is considered damped when some of the signal-component frequencies are attenuated. Overdamping causes systolic pressure to decrease and diastolic pressure to increase. In a system for measuring vascular pressure, sources of overdamping include air bubbles in the transducer or pressure tubing, clot or fibrin at the catheter tip, and a kinked or partially occluded catheter. Underdamping amplifies the higher harmonics, producing oscillations, which obscure systolic and diastolic values. As such, underdamping causes systolic pressure to increase and diastolic pressure to decrease. Common sources of underdamping include an increase in heart rate interfering with the natural frequency of the pressure-transducer system; a “catheter whip,” commonly observed with a pulmonary artery (PA) catheter, can produce an underdamped signal (see Fig. 48-8).
PA waveforms generally contain more high-frequency information than do systemic arterial waveforms, and small errors in pressure assume more clinical significance. Poor dynamic frequency response and overdamped pressure tracings accounted for over half the technical problems encountered in measuring PA wedge pressure.19 A simple test for assessing the dynamic response of a vascular pressure catheter system is the rapid-flush test.20
Alignment of Signals. When employing two different signals to quantify lung mechanics (flow and pressure), it is important to ensure the absence of a phase lag between the two signals. A lag can induce large errors in measurement of resistance and compliance.5 Phase lags also cause major errors when dynamic intrinsic positive end-expiratory pressure (PEEPi) is measured using an esophageal balloon-catheter system. If a phase lag causes the esophageal signal to occur before flow, PEEPi will be overestimated or considered present when it is truly absent. If a phase lag causes the esophageal signal to occur after flow, PEEPi may be underestimated (Fig. 48-9).
Figure 48-9
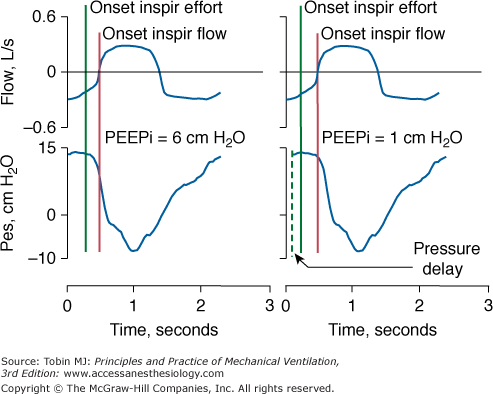
Left panel. Flow and esophageal pressure (Pes) signals are properly aligned. Intrinsic PEEP (PEEPi), measured as the difference between the onset of inspiratory (Inspir) effort and onset of inspiratory flow, is 6 cm H2O. Right panel. Flow and Pes signals are not properly aligned in terms of phase: flow precedes Pes, causing underestimation of PEEPi.
Variable Conditions between Calibration and Data Collection. If a measurement system is used under conditions that differ from the conditions of calibration, and no correction is made, systematic errors may result. Flow or volume readings on a ventilator are inaccurate if the temperature or humidity during the recording differs from those present during calibration.21,22 During calibration, volume may be measured under conditions of ambient temperature, with gas fully saturated with water vapor. If appropriate corrections are not made, subsequent readings of volume, under conditions of normal body temperature and with pressure saturated with water vapor, will underestimate the true volume of gas moving through the lungs. A mass of gas that is 1000 mL at 21°C (69.8°F) can become 1095 mL at 37°C (98.6°F).
Pneumotachographic measurements during mechanical ventilation will become inaccurate if the dimensions of the ventilator tubing during data recording differ from the dimensions used during calibration. The differences in air turbulence and the distribution of flow through the resistive element under the two conditions can lead to measurement errors. When a pneumotachograph was initially calibrated under ideal conditions (with tubing that provided optimized flow characteristics) and then subsequently attached to commonly used ventilator tubing, flow was underestimated by as much as 10% and volume by as much as 15%.23
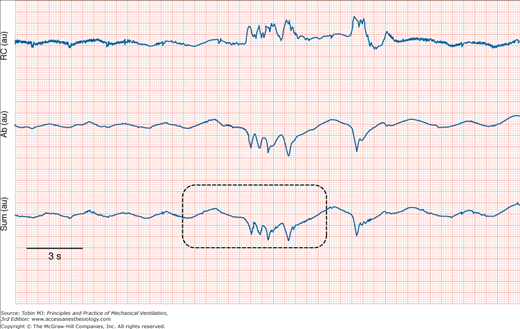
Noise. All measurements are subject to some degree of rapidly changing interference, termed noise or artifact (Fig. 48-10).24 The source of noise can be difficult to trace. Noise distortions occur randomly, so their effects are lessened if measurements are repeated sufficiently. The distortions are not reduced by calibration. The efficiency with which the signal can be distinguished from background noise is defined as the signal-to-noise ratio. Unless the ratio exceeds 1, the signal will be undetectable.
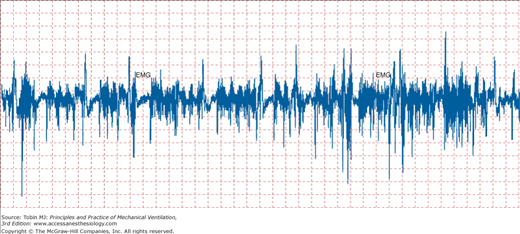
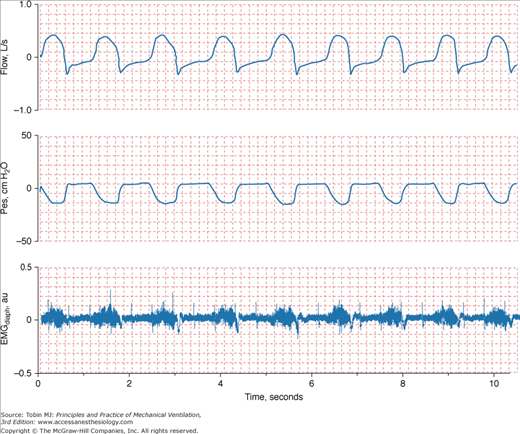
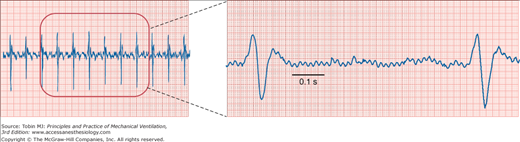
Noise is particularly troublesome when weak signals are highly amplified. Noise is then amplified along with the signal, which eventually limits the sensitivity of the measurement. Cardiac contractions can distort an esophageal pressure signal such that pressure swings appear greater than they truly are. Likewise, the electromyogram signal can be contaminated by the electrical activity from other muscles (Fig. 48-11). As a signal is being transmitted to an amplifier, it is subjected to electrostatic and electromagnetic noise from nearby power lines (Fig. 48-12).25 Radiofrequency noise may also be added from cellular phones. Finally, physical movement of the catheter cable changes its capacitance and may add low-frequency noise.
Physiologic factors, such as a patient coughing, can lead to error or noise (Fig. 48-13). Physical factors such as slippage of transducers or improper placement of electrodes are also sources of noise. A pulse oximeter probe slipping off the patient’s skin accounted for 35% of false alarms recorded in an ICU.26 Patient movement disturbs the electrode-skin interface and causes electrocardiogram (ECG) noise.27 “Ringing” after flushing an arterial catheter can interfere with the blood pressure signal and cause faulty readings.28
A particularly annoying consequence of signal noise is false alarms.29–31 Investigators prospectively waited at the bedside for 298 hours in an adult ICU. Of 2942 alarms, 2525 (86%) were false.26 In a pediatric ICU, 68% of alarms were false.30 A high rate of false alarms causes noise pollution, wastes nursing time, and contributes to staff burnout.32
Nonlinearity. Nonlinearity introduces unpredictable error that varies over the operating range. With measurements of O2 consumption, nonlinearity of the O2-sensing system causes a progressive increase in error as fractional inspired oxygen concentration (FIO2) is increased from 0.21 to 1.0.33,34 Thus, error in measurements of O2 consumption increases from 2.6% at room air to 17% at an FIO2 of 0.80.33
Human Error. Human mistakes in acquiring data are another source of error. Depending on the angle at which the needle on an analog scale is read, different people can perceive different values for the same actual plateau pressure. Measurements that require patient cooperation introduce another source of error. Use of the end-expiratory airway occlusion method to measure PEEPi requires a cooperative patient who does not resist the occlusion.35 Of 283 attempts in ventilated patients, PEEPi could be quantified in only eighty-six (30%); most of time PEEPi could not be quantified because the patient made an expiratory effort during the occlusion maneuvers (Fig. 48-14).36
Figure 48-14
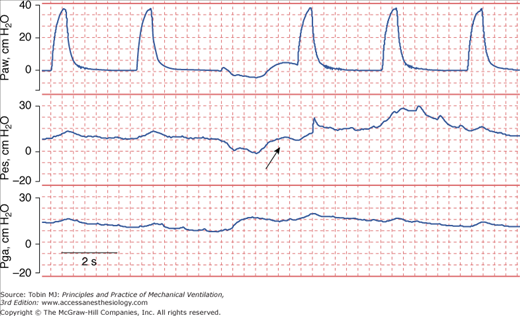
Airway pressure (Paw), esophageal pressure (Pes), and gastric pressure (Pga) in a patient with chronic obstructive pulmonary disease being ventilated with assist-control ventilation. The airway was occluded during expiration in order to quantify intrinsic PEEP (PEEPi). The patient made an expiratory effort during the occlusion (arrow), and thus the recorded pressure overestimated the true PEEPi.
Patient cooperation is also needed for reliable measurement of maximal inspiratory pressure, a measure of respiratory muscle strength.37 In patients with low respiratory drive, coaching patients to make vigorous inspiratory efforts led to a 28% increase in pressure.38
Fidelity of Recordings
Figure 48-15 shows the typical configuration of a data collection system used for bedside monitors in the ICU.39 The physiologic quantities being measured are referred to as signals. A signal (blood pressure, respiratory rate) is converted from a mechanical format to an electrical format using a transducer. The signal is then amplified and conditioned. Next, it is converted from an analog signal to a digital signal with an analog-to-digital converter. Once digitized, the signal is transmitted through a microprocessor. The signal then appears on the monitor screen as a waveform or digital display.39
Figure 48-15
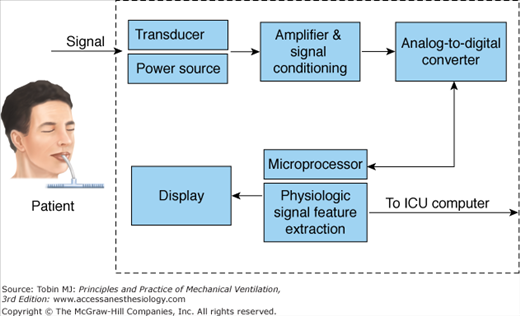
Schematic of a bedside monitor data-acquisition system. (Modified, with permission, from Gardner.39)
Numbers appearing on the screen of a monitor do not provide all of the information needed to care for a critically ill patient. Studies have revealed that data from bedside monitors account for only 13% to 22% of the data needed to make medical decisions in the care of a critically ill patient.40
Of the other data used in clinical decision making, 21% to 22% is derived from observations of a patient by physicians, nurses, and other staff, 38% to 41% from laboratory data, and 13% to 23% from information on medication usage. Caring for a critically ill patient requires the incorporation of all of these data into clinical judgments. Ignoring data that are not important or simply noise is one of the major tasks for a caregiver in the ICU.
Acquiring high-fidelity (minimal amount of noise) data involves the following three factors. First, the transducer and data collection equipment needs to be well designed. For example, to detect the development of dynamic hyperinflation by means of monitoring of changes in end-expiratory lung volume, one cannot employ a pneumotachograph that exhibits baseline drift (Fig. 48-16). To help in the design of reliable equipment, several standards have been established by organizations such as the Association for the Advancement of Medical Instrumentation (AAMI) and the American National Standards Institute (ANSI).
Figure 48-16
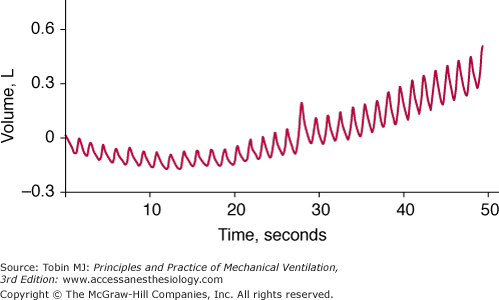
Breath-by-breath measurements of volume obtained with a pneumotachograph in a spontaneously breathing patient. The drift in the baseline of the signal means that the pneumotachograph does not provide a reliable measure of breath-by-breath change in end-expiratory lung volume, which is desired for detecting the development of dynamic hyperinflation.
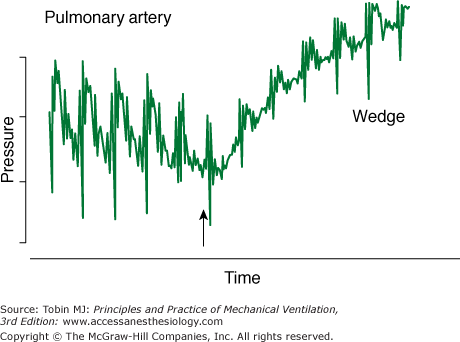
Second, the clinical staff must properly carry out certain procedures. A perfect catheter, transducer, and flush system can be set up to measure PA wedge pressure. If the catheter, however, is not positioned in the proper location in the PA, overwedging or incomplete wedging can occur, leading to erroneous readings (Fig. 48-17).
Third, rigorous and appropriate processing of the signals generated by a well-designed transducer can eliminate noise in physiologic signals. When signal extraction technology was employed in a pulse oximeter, a 22-fold reduction in noise secondary to gross motion and tremors was observed.41
Other Barriers to Accurate Data Gathering
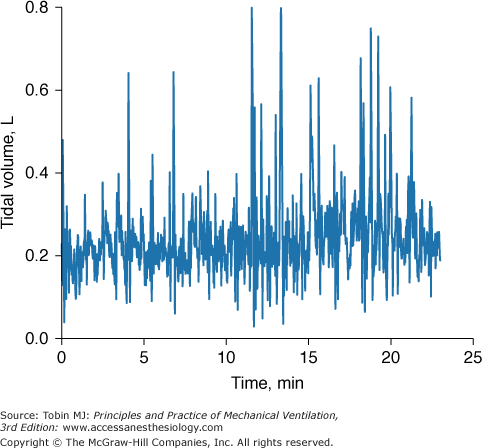
Even when a patient is in a steady state, variables monitored in the ICU may not be consistent. To know if a new recorded value of a variable is truly different from an earlier recorded value, it is necessary to know the normal physiologic variation of the variable (Fig. 48-18).19 Breathing pattern varies considerably. Breath-to-breath variability in tidal volume, as reflected by coefficient of variation, was 33.0 ± 14.9% (SD) in forty-seven young healthy subjects (ages 21 to 50 years) and significantly higher in eighteen healthy older subjects (ages 60 to 81 years), 44.0 ± 14.7%.42 The substantial variability in breathing pattern between subjects, which is further magnified by the considerable breath-to-breath variability within subjects, poses a problem in selecting settings during mechanical ventilation. In a patient being ventilated with the volume-cycled form of assist-control ventilation, if tidal volume is set at the average value during unassisted breathing (approximately 5 to 7 mL/kg), the wide breath-to-breath variation in ventilatory demand means that around half of the delivered tidal volumes will be lower than the patient’s demand and may lead to dyspnea.43
Arterial pressure varies throughout the respiratory cycle. Minute-to-minute variation in systolic pressure (quantified as standard deviation) is approximately 4 mm Hg, and diastolic pressure varies 2 to 3 mm Hg. In healthy subjects, arterial pressure differs by as much as 20 mm Hg between the two arms.44 Consequently, a difference of 20 mm Hg between the two arms does not necessarily indicate an underlying disorder such as aortic dissection.
No machine, including a monitor, is 100% reliable. Despite its undisputed popularity, pulse oximetry fails to provide valid measurements of  in a variety of settings.45 The incidence of overall failure (defined as at least one continuous gap in data that exceeded 10 minutes) in anesthetized patients in an operating room was 9%.46
Many users of monitors have a limited understanding of how a machine functions and the implications of its measurements. Iberti et al47 found that 47% of physicians (77% of whom were in training) were unable to interpret a straightforward recording of a PA wedge pressure. On average, physicians incorrectly answered ten of thirty-one questions dealing with insertion and complications, cardiac physiology, and interpretation and application of data. More respondents had difficulty with questions regarding data interpretation and patient treatment than with questions related to catheter insertion or cardiac physiology.
Modern ventilators provide a continuous online display of physiologic signals (such as flow, volume, and airway pressure) and numeric computations (resistance, compliance, and work of breathing). The complexity of the physiologic principles that underpin respiratory mechanics, however, has impeded the use of the measurements in clinical practice. The poor understanding of lung mechanics by medicine residents was highlighted in the recent survey.48 Some 35% of residents were unable to select a ventilator setting that would decrease PEEPi in a patient with chronic obstructive pulmonary disease (COPD) who had become hypotensive immediately after intubation (Table 48-1).
| Test items | % Incorrect |
|---|---|
| Appropriate use of PEEP in hypoxemia | 44 |
| Identifying patient’s readiness for a weaning trial | 38 |
| Managing auto-PEEP correctly | 35 |
| Identifying candidate for noninvasive mechanical ventilation | 27 |
| Diagnosing tension pneumothorax | 14 |
The mountains of data generated by monitors make it extremely difficult to differentiate relevant from irrelevant information. More than 230 new data points may be available for review in a single patient on morning ICU rounds.49 Psychologists have shown that the human mind is capable of assimilating no more than seven variables simultaneously.50 When the same variable is measured by more than one machine (heart rate recorded by an ECG monitor and a pulse oximeter), the problem is compounded.
A major purpose of monitoring is to measure key variables that enhance understanding of underlying pathophysiology. Because of technical limitations, however, we tend to monitor that which we can rather than seeking the information we need.2,51
The primary goal of mechanical ventilation is to rest the respiratory muscles. Thus, activity of the respiratory muscles is the single variable most needed when monitoring a ventilated patient. Ventilator settings, however, are usually adjusted on the basis of arterial blood gases. Yet, arterial blood gases provide zero information about whether the respiratory muscles are being adequately rested. Consider synchronized intermittent mandatory ventilation, which has always been adjusted according to arterial blood gases. The failure of arterial blood gases to provide insight into work of breathing probably accounts for the gap of 20 years between the introduction of this mode and recognition of its harmful effects.52–54
Investigators recently have argued that calculations derived from the arterial pressure waveform provide a reliable continuous estimate of cardiac output (Fig. 48-19).55–57 In patients with sepsis, Monnet et al58 compared the accuracy of calculations based on the arterial pulse contour against a new transpulmonary thermodilution technique (the reference measurement) in detecting short-term changes in cardiac index (<1 hour). The contour technique was reliable in detecting a 15% increase in cardiac index induced by volume expansion (area under the receiver operating characteristic [ROC] curve, 0.87) or by norepinephrine (area under ROC curve, 0.92). Although promising, the ability of the arterial pressure contour to reliably estimate cardiac output needs further investigation in a more heterogenous group of ICU patients (not just sepsis) and over a longer period of observation (>1 hour).
Figure 48-19
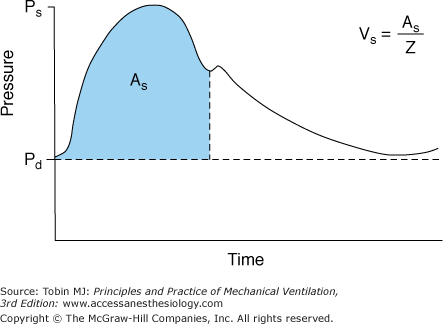
Schematic of the arterial pressure waveform versus time. Ps represents the systolic pressure, Pd the diastolic pressure, and As area under the systolic portion of the pressure-time curve. The heart’s stroke volume Vs is related to As and the vascular impedance (Z). (Used, with permission, from Mahutte.57)
Thinking in terms of ventricular preload, knowledge of end-diastolic volume is pivotal for logical assessment of hemodynamic performance in a critically ill patient.59 No simple method is available, however, to measure end-diastolic volume. Many clinicians use central venous pressure to assess preload despite numerous studies showing that central venous pressure is extremely unreliable in estimating end-diastolic volume in critically ill patients.60–65
In the ICU, different techniques can be used to measure the same physiologic function. The resulting differing numbers, however, may suggest different clinical states. Arterial oxygenation can be assessed by measuring O2 saturation with a pulse oximeter or partial pressure of oxygen (PO2) by blood-gas analysis. In a study of patients with acute respiratory distress syndrome (ARDS), change in  moved in an opposite direction to the change in PaO2 in 25% of the measurements. In some patients, a decrease in partial pressure of arterial oxygen (PaO2) of 20 mm Hg was accompanied by a simultaneous increase in
  of 20%.66 Therapeutic decisions based on
  alone differed from decisions based on PaO2 on 16% of occasions.
Clinical Applications
The range of options for monitoring a ventilated patient is enormous and beyond the scope of this chapter. A few examples are provided. For a comprehensive review of the clinical applications of ICU monitoring, the reader is referred to the companion book, Principles and Practice of Intensive Care Monitoring.4
To properly interpret information—medical or nonmedical—a person must take into account the relevant context. To properly understand the results of a diagnostic test, a clinician requires a good understanding of pertinent pathophysiology.
Related posts:


Stay updated, free articles. Join our Telegram channel

Full access? Get Clinical Tree


