Used on a data set [1] for propofol this becomes

Furthermore, as clinicians we are not really interested in plasma levels but with effects. The hysteresis (delay) between plasma levels and effect adds further complexity (and another exponential equation). A common way of dealing with the complexity of the relationship between drug dosing and effect is to develop standard recipes or sequences of drug dosing. These are empirically derived (essentially trial and error) but are frequently handed down to new trainees as ideal solutions.
Demonstrating the Relationship Between Dose and Effect
A range of tools have been developed to illustrate the relationship between drug doses and plasma and effect-site concentrations in various settings. The role of these systems, including StanPump, TIVAtrainer, Rugloop, and IVA-SIM, has been summarized [2]. To these can be added a plethora of home grown solutions. These tools have been used for research and for teaching and demonstrating drug kinetics both in real time and for “off-line” teaching. More recently various “apps” have been developed which allow users to carry kinetic simulations in their pocket making these simulations available for everyday use by the enthusiast.
For individual drugs, commercial TCI systems are an attempt to address this complexity in ways that can be used and understood by all users. The displays of TCI devices often illustrate the history and predictions of both plasma and effect-site levels, giving the user an insight into the underlying kinetics and potentially allow better matching of drug delivery to changing requirements, at different stages of a surgical procedure.
Anaesthesia Involves Multiple Drugs—and Multiple Effects
Anaesthesia is not about single drugs . Most general anaesthetics involve administration of at least two classes of drugs, typically a hypnotic and an opioid. The interactions between these groups of drugs have been well demonstrated [3, 4] and shown to be synergistic [5].
To further complicate matters, anaesthesia “depth” is not a single dimension [6]. Glass describes three endpoints [7]
- 1.
lack of explicit recall, primarily mediated in the cortex
- 2.
lack of response to noxious stimuli (both motor and sympathetic response), primarily mediated in the spinal cord
- 3.
providing optimal operating condition
It is difficult enough to appreciate the time course of effect of one or more bolus doses of an individual drug, it is equally difficult to get a true perception of the potency of synergy. As an example a single bolus of 1.5 mcg/kg of fentanyl will reduce MAC (a measure of the amount of a volatile agent required to block the motor response to a given noxious stimulus) by around 50 % for 5 min.
Over recent years the technique of response surface modeling [8, 9] has allowed interactions between drugs to be quantified over a wide range of doses for each drug. Most of this work has been performed by two groups, one based at the University of Utah and the other based in Switzerland, Belgium and the Netherlands. These groups have used response-surface methodology to investigate a wide range of opioid–hypnotic interactions [10–16].
In 2004 Schumacher and Bouillon described the concept of an interaction display [17] while the drug kinetic display described by Syroid et al. in 2002 [18] which incorporated a graphic of individual drug effects was easily adapted to incorporate response surface models.
These two prototypes, incorporating the results of ongoing work, became the basis for the two commercial devices released in the past 10 years.
These devices, Navigator Application Suite (GE Healthcare, Helsinki, Finland) and SmartPilot View (Dräger Medical GmbH, Lübeck, Germany) have made PK/PD interaction available to the more casual user. In both systems “lack of consciousness” is defined as no response to “shake-and-shout”, or an Observer’s Assessment of Alertness/Sedation (OAA/S) score [19] ≤ 1.
Both devices collect information on volatile anaesthetic delivery and measured concentrations from anaesthesia machines and monitors. Many types of infusion pumps can be directly connected to allow continuous input of infusion data. This is especially useful with TCI pumps as the infusion rates can change frequently. Bolus drug doses and infusions not directly logged can be entered manually.
Although there is much that appeals about these devices, to date there is little published work to help determine the true place in routine clinical practice. Much of the rest of this chapter are personal observations based on the use of both systems, but predominantly Navigator, in a large number of anaesthetics over the past six years by an enthusiast for this technology [20] (Figs. 39.1 and 39.2) [21].
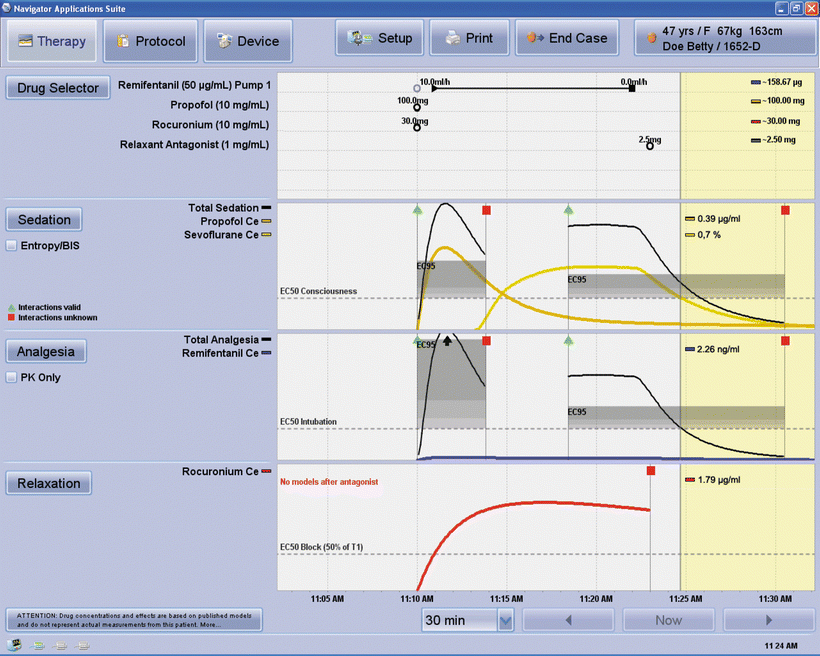
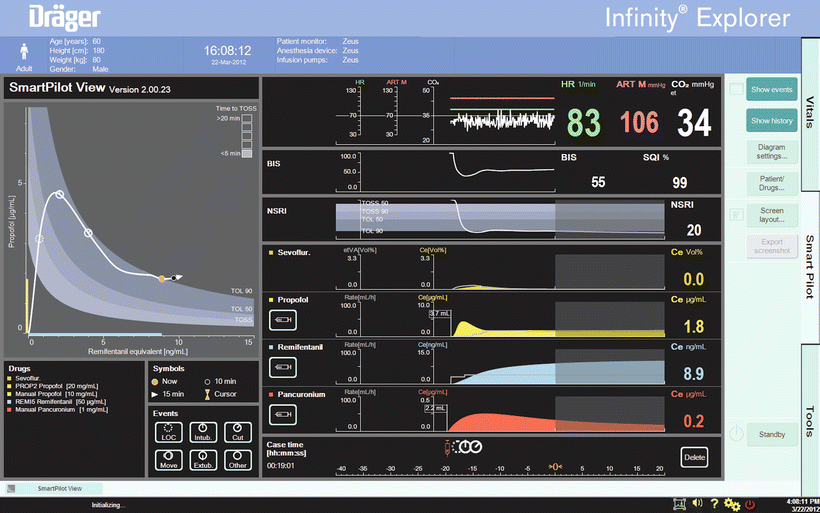

Fig. 39.1
The standard demonstration example of the Navigator (GE) screen. In this example induction was with boluses of propofol, remifentanil and rocuronium. Anaesthesia was maintained with a remifentanil infusion and sevoflurane. Delivery of both drugs stopped at around 11:22. The top pane shows drug dosing with totals on the right. The second pane is labelled “sedation” and is based on response to shake-and-shout (OAA/S ≤ 1) and the third “analgesia” (response to intubation with a positive response being gross movement or a rise in pule rate or blood pressure >20 % above baseline). The bottom pane relates to neuromuscular blockade. Coloured lines in the three drug panels are the modeled effect-site levels of individual drugs based on the drug doses, which can be entered manually or directly from up to three syringe drivers, and the patient anthropomorphic data shown in the top right of the screen. The division between the white background and yellow background is the current time, with lines to the right representing forward predictions. Current effect-site levels for the individual drugs are shown on the right of each panel. From top to bottom these are propofol, sevoflurane, remifentanil, and rocuronium. In the second (sedation/consciousness) and third (analgesia/noxious stimulus) panes the black lines represent the combined, or synergistic, effect of the opioid and hypnotic on that effect. The shaded areas show the band in which 50 % (lower) to 95 % (upper) of subjects will not respond to the stimulus (shake-and-shout or intubation). The combined effects (black lines) are plotted on the same effect scale as individual drugs. In this example, the sevoflurane effect-site concentration is above the EC95 from around 11:16 until 11:22. At the current time (11:25) about 50 % of subjects would be unresponsive to this level of sevoflurane but given the (reducing) remifentanil levels it will be a further 1–2 min before the combined effect reaches this 50 % likelihood of response level. Although opioid levels are plotted in the “analgesia” pane, they seldom get far above the baseline as very large doses of opioids alone are needed to block the response to intubation. The check box labeled “PK only” allows display of individual opioid concentrations, but without the interaction effect. The break in the shaded areas and black lines is a zone where the algorithm is unable to calculate a combined effect because of moderate levels of both propofol and sevoflurane. Once either agent drops below a threshold that agent is ignored. Image provided by and printed with permission of GE Healthcare, Helsinki Finland

Fig. 39.2
A standard demonstration SmartPilot View Screen. The interaction between hypnotic and opioid drugs is shown on the two-dimensional plot on the left. The white line illustrates progression of the patient through time. The orange dot is the current time; the black dot and the arrowhead represent 10 and 15 min, respectively, in the future. Various events in the past are marked by the white circles on the 2-D surface and on the time line. The likelihood of tolerance to stimulus (TOL = tolerance of laryngoscopy, TOSS = tolerance of shake-and-shout) response (or the absence of response) is indicated by the shaded bands. “TOSS” = 50 % likelihood of response to shake & shout, “TOL 90” and “TOL 50” the level at which 90 % and 50 % of patients would tolerate laryngoscopy. The coloured bands on the axes indicate the current hypnotic (expressed as propofol or sevoflurane equivalents) and opioid (in remifentanil equivalents) effect-site levels. The boxes in the top right of the 2-D display estimate the time to 50 % response to shake-and-shout, if drug delivery stopped, in this case < 5 min. This display is equivalent to the decrement time (the time to fall from the current value to a preset concentration) displayed by many TCI systems, typically preset to a propofol concentration of 1 mcg/ml. Individual drug dosing and effect-site levels are plotted over time. Dosing is shown with grey lines and the coloured areas the effect-site levels. The shaded background represents future “predictions” while the values shown are estimates of the current levels. In addition to the monitored variables shown in the upper two panels, “NSRI” or noxious stimulus response index [21] is plotted. NSRI is a modification of the hypnotic–opioid interaction to allow for intensity of stimulus. NSRI has been shown to be a better predictor of response to noxious stimulus (the “analgesic” component of anaesthesia) than EEG based measures. (Used with permission from Dräger. Source: ©Drägerwerk AG & Co KGaA, Lubeck. All rights reserved. No portion hereof may be reproduced, saved, or stored in a data processing system, electronically or mechanically copied or otherwise recorded by any other means without our express prior written permission.)
What These Devices Show Us
SmartPilot View and Navigator have much in common although the systems display the information in quite different ways . Although promoted as demonstrations of drug interactions these devices show the user a wide range of other information, some of which are discussed below.
Displaying Effect-Site Concentration : Making the Effect Site Normal
The systems start by calculating and displaying past, present, and future effect-site concentrations. Both systems have chosen to display only effect-site concentrations which is appropriate as, to some extent, the dosing and plasma levels that produce the effect are of limited interest and value.
Seeing the Time Course of Individual Drugs
We often only see binary effects of drugs such as propofol (the patient goes to sleep). It is difficult to appreciate the actual time course of effect (Fig. 39.3) [22]. Interaction displays present this information to the user every time a bolus is given (see Figs. 39.1 and 39.2) and help users develop an understanding of the relationship between dose and effect .
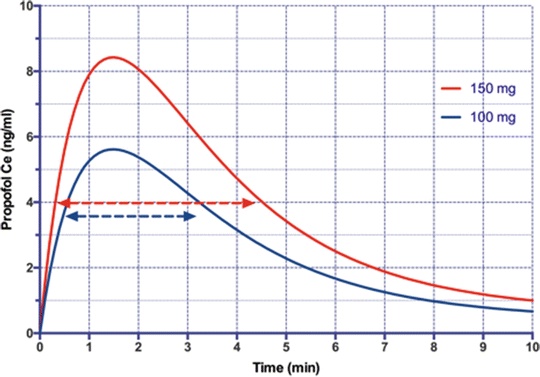

Fig. 39.3
The effect-site propofol concentration after a single 150 mg (red) or 100 mg (blue) bolus in a 80 kg, 170 cm male aged 40 yr modeled using the Schneider parameters [22]. As a first approximation assume the patient is unconscious (no response to shake-and-shout) when the propofol concentration is >4 ng/ml. The casual user only “knows” that the patient became unrousable after about 25 s with the 150 mg bolus and 10 s later with 100mg (40 % longer!) and has no way of knowing how long the effect will last
An Advisory System for Manual Target Control
The trend display and predictions of individual drug contraptions allow the user to make intelligent changes to drug delivery. The consequences of change are immediately obvious and the input (or dosing) can be altered until the desired profile of effect-site concentration is achieved. We developed a system to guide delivery of inhalational agents incorporating model based forward prediction using vaporizer setting, fresh gas flow, and measured end-tidal concentration [23]. Users made step changes with this system more rapidly than without the display [24].
Manual targeting allows the user to control the rate of change more easily than on many TCI systems which are set up to achieve the target as soon as possible. This can be useful when a gradual change in concentration is desirable such as using a fixed rate infusion of propofol just until the point a patient becomes unresponsive to avoid the haemodynamic consequence of larger doses. This type of display may also allow many of the advantages of TCI in areas where TCI is not currently available or licensed, such as the USA (see Fig. 39.4).
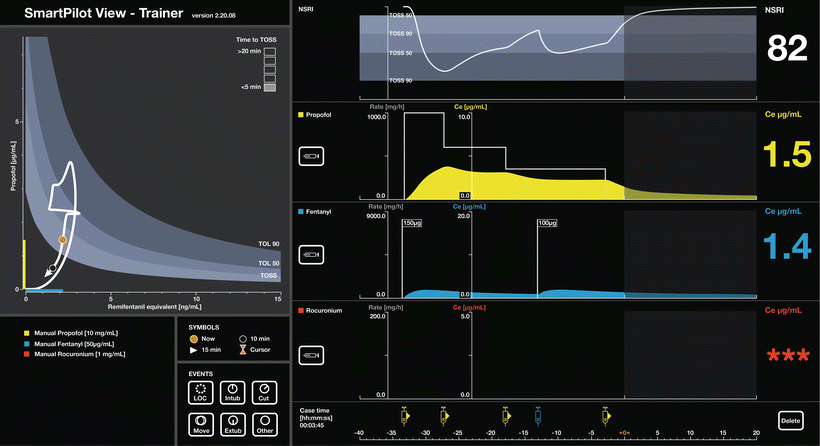

Fig. 39.4
A SmartPilot View example of a series of fixed rate propofol infusions guided by a combination of predicted effect-site levels and patient response. The initial infusion rate was 100 ml/h, reduced to 60 ml/h at 6 min and 35 ml/h at 15 min. (Used with permission from Dräger. Source: ©Drägerwerk AG & Co KGaA, Lubeck. All rights reserved. No portion hereof may be reproduced, saved, or stored in a data processing system, electronically or mechanically copied or otherwise recorded by any other means without our express prior written permission.)
Target Control of Drugs Not Modeled in TCI Systems
Many drugs used in anaesthesia and for which kinetic and PK/PD models exist are not included in TCI systems. Fentanyl and neuromuscular blockers are examples of these. Use of real time modeling may allow better matching of drug dosing to requirement, and as with TCI may reduce total consumption. Additionally once users become aware of the large swings in drug concentration and the duration of effect of a given bolus, we start to see smaller doses used to control the duration of effect.
Several authors have quantified fentanyl levels at emergence after various procedures [25, 26]. Suggesting a target of 1–1.5 ng/ml of fentanyl at emergence is meaningless to most practitioners. A continuous effect-site display allows practitioners to “target” specific levels. They also start to understand the consequences of different dosing regimes (see Fig. 39.5).
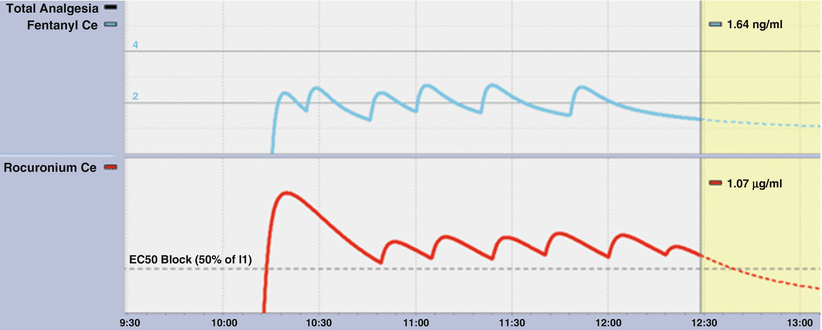

Fig. 39.5
An example of repeated boluses of fentanyl and rocuronium in the Navigator display. After an initial 40 mg rocuronium dose, further doses of 10 mg were given at return of T2 of the train of 4. The final bolus was 5 mg. Fentanyl was given in response to clinical end points and with the intention of achieving an effect-site concentration of 1–1.5 ng/ml at the completion of surgery followed by two boluses of 50 mg. The “PK only” box was checked in the “Analgesia” pane to produce this image
Bolus or Infusion
Both the display of the individual effect-site concentrations and the interaction displays demonstrate wide swings in drug concentrations seen with boluses (Figs. 39.6 and 39.7). Smaller boluses (Fig. 39.5) reduce this variability but at a cost of decreased duration.
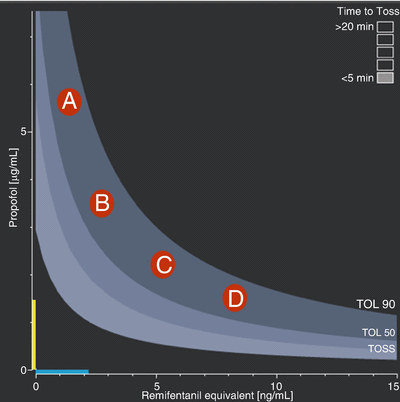
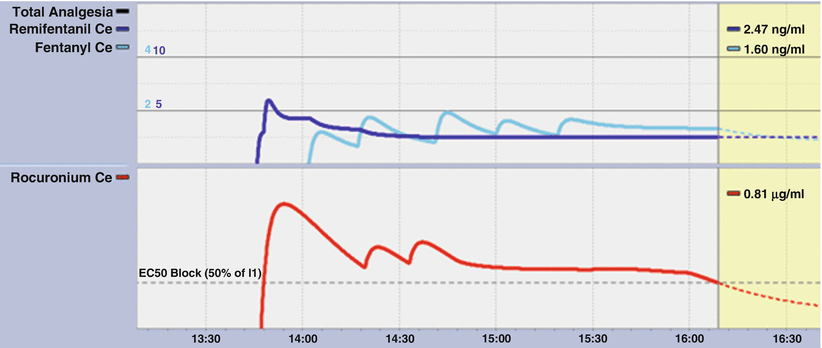

Fig. 39.6
A segment of the 2-D display from Smart-Pilot View . The oscillations illustrate the effect of repeated fentanyl boluses. (Used with permission from Dräger. Source: ©Drägerwerk AG & Co KGaA, Lubeck. All rights reserved. No portion hereof may be reproduced, saved, or stored in a data processing system, electronically or mechanically copied or otherwise recorded by any other means without our express prior written permission.)

Fig. 39.7


A Navigator screenshot where after number of boluses infusions of rocuronium (lower panel) and fentanyl (upper panel) were commenced. Following initial boluses of rocuronium of 40 mg, 10 mg, and 10 mg, the rocuronium infusion commenced at 25 mg/h at 1445. This was reduced to 20 mg/h at 1530 and turned off at 1555. Three fentanyl boluses of 100 mg were followed by two of 50 mg. A fentanyl infusion of 100 mcg/h ran from 1515 until 1605. A remifentanil infusion was also used
Stay updated, free articles. Join our Telegram channel

Full access? Get Clinical Tree


