Chapter 59 Intracranial Hypertension and Brain Monitoring
Clinical Background
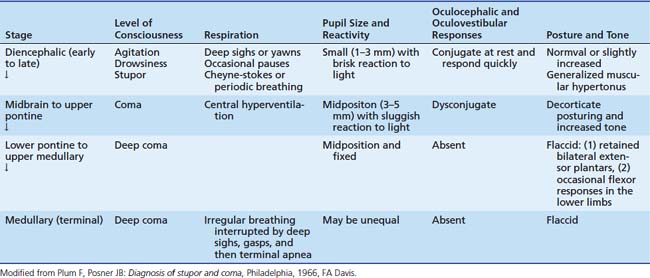
In critical illness, the early recognition and treatment of intracranial hypertension is important because it is a major cause of mortality and morbidity. Therefore an attempt should be made to collate the clinical evidence for and against its presence. The early symptoms and signs of this complication, however, which are invariably subtle and nonspecific (Table 59-1), make this form of assessment somewhat limited. As will be discussed later, as intracranial hypertension progresses, changes may occur in the vital signs, with an elevation of blood pressure, a decrease or an increase in pulse, and irregularity in the respiratory rhythm. These signs, sometimes associated with episodes of decerebrate rigidity, indicate the occurrence of transtentorial herniation or “coning” and imply the possibility of impending death if the process cannot be reversed. Unfortunately recognition at this stage is often too late to prevent death.
Table 59–1 Early, Subtle Symptoms and Signs of Raised Intracranial Pressure
| Infant | Child | |
|---|---|---|
| General state | Poor feeding | Anorexia and nausea |
| Vomiting | Vomiting | |
| Irritability to coma | Lethargy to coma | |
| Seizures | Seizures | |
| Head/eyes | Full fontanelle | False localizing signs |
| Scalp vein distention | ||
| False localizing signs | ||
| Other | Altered vital signs | Altered vital signs |
| Hypertension | Hypertension | |
| Pulmonary edema | Pulmonary edema |
Brain tissue shifts may produce various “syndromes.” First, transtentorial or cerebellar herniation may result in midbrain or medullary compression. Many of the clinical signs observed in association with herniation result from direct compression of structures by the impacted tissue or are due to angulation of nerves or arteries against normal structures in the area. These herniations can cause increasing coma, with distortion of the brainstem leading to midbrain and pontine hemorrhages. Cerebellar herniation is likely to occur when the increase in ICP is maximal in the posterior fossa. Such herniation occurs more commonly downward, squeezing one or more of the cerebellar tonsils through the foramen magnum; compressing the medulla; and leading to neck stiffness, head tilt, lower cranial nerve palsies, respiratory irregularities, or sudden cardiorespiratory arrest. Cerebellar herniation may occur upward through the tentorial notch, causing midbrain compression and leading to paralysis of upward gaze, dilated and fixed pupils, and respiratory abnormalities, although this type of cerebellar herniation is uncommon.
Finally, when bilateral or a general increase in ICP in the supratentorial compartment occurs, as in diffuse cerebral edema, central transtentorial herniation may occur. This condition leads to impairment of upward gaze, pupillary constriction, hypertonus, and decerebrate posturing. Temperature irregularities and diabetes insipidus may develop, and cardiorespiratory arrest may occur eventually. A summary of the clinical features of “central syndrome” is given in Table 59-2.
Physiology of the Intracranial Vault
Intracranial Pressure
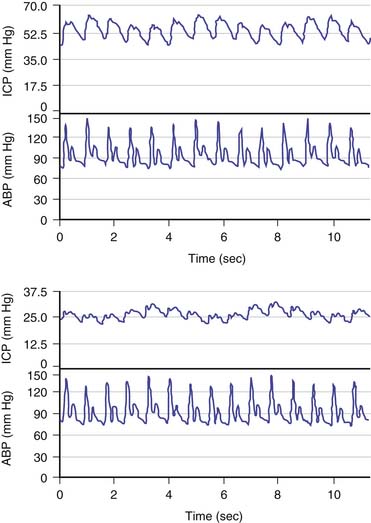
The brain is an expansile structure that expands and contracts with each beat of the heart. Because there are no valves within the venous drainage from the brain, any changes in intrathoracic pressure are transmitted to ICP. Such phenomena can be seen and palpated simply through the examination of a baby’s fontanelle and quantified with cerebrospinal fluid (CSF) pressure recording. Once the cranial sutures have fused, any change in cerebral blood volume (CBV) on the arterial-to-arteriolar side of the cerebral circulation must be compensated by either reduction in cerebral venous volume or by phasic movement of CSF out of the intracranial vault through the foramen magnum. Such expansion of the cerebral mantle with compression of the lateral ventricles during systole and movement of CSF through the aqueduct of Sylvius and to and fro through the foramen magnum was first visualized with pneumoencephalography. These changes now can be seen more easily with dynamic magnetic resonance imaging (MRI). Inevitably a lag phase exists between the systolic increase in CBV and the effect of the compensatory mechanisms so that CSF pressure increases to reflect, in part, the systolic waveform. The CSF pressure waveform is not an exact replica of the arterial waveform because it has been “filtered” by the combined effects of arterial wall compliance of the cerebral arteries, cerebrovascular resistance, and intracranial compliance (Figure 59-1).1
Hydrodynamic Model of Intracranial Pressure
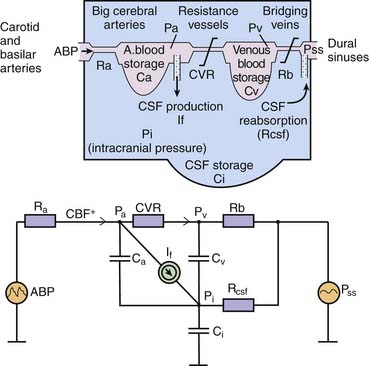
ICP is a function of the circulation of cerebral blood and CSF in which ICP is related to a vascular component (ICPvascular) and a CSF component (ICPCSF). There is considerable interest in modeling these relationships as an aid to understanding some of the complex phenomena seen in critically ill patients. The vascular component is difficult to express quantitatively.2 It is probably derived from the pulsation of CBV that is detected and averaged by nonlinear mechanisms of regulation of CBV. More generally, multiple variables such as the arterial blood pressure (ABP), autoregulation, and cerebral venous outflow all contribute to the vascular component. In regard to the other component, circulation of CSF, 80% of CSF is the product of active secretion by the choroid plexus, and movement of interstitial fluid into the ventricles and subarachnoid space contributes the remainder. Drainage is largely passive via arachnoid villi and granulations into the superior sagittal sinus and spinal root sleeve venous drainage. Some drainage, which is currently unquantifiable, occurs through the olfactory bulb and mucosa into the deep cervical lymphatics. The equation by Davson and colleagues3 shows the immediate relationships controlling CSF pressure, in which ICPCSF = (Resistance to CSF outflow) × (CSF formation) + (Pressure in sagittal sinus). With these two components—vascular and CSF—taken together, Figure 59-2 shows the hydrodynamic model of cerebral blood flow (CBF) and CSF circulation and the equivalent electrical circuit.4 This model can be used to interrogate CSF dynamics clinically (described later in this chapter).
Cerebral Vasodilation and Cerebrospinal Fluid Pressure
Three major factors regulate CBF: cerebral perfusion pressure (CPP), partial pressure of arterial carbon dioxide (PaCO2), and partial pressure of arterial oxygen (Pao2). Hypercapnia causes cerebral vasodilatation, increases CBF, and increases ICP. Hypoxia also causes cerebral vasodilatation and a rise in ICP. CPP is taken as the difference between mean ABP and ICP and represents the pressure gradient acting across the cerebrovascular bed; therefore it is an important factor in regulation of CBF.5 Under normal circumstances, over a wide range of CPP, CBF is autoregulated (i.e., it remains constant when CPP varies). Thus in regard to the effect of this phenomenon on ICP, active cerebral arteriolar constriction occurs and ICP consequently falls to maintain CBF when ABP is increased (i.e., hypertension). At the other extreme, systemic hypotension (within the autoregulatory range) provokes cerebral vasodilatation and an increase in ICP. When autoregulation is defective, ICP increases and decreases with ABP (Figures 59-3 and 59-4).4
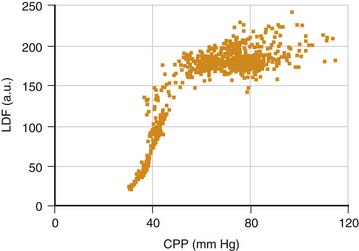
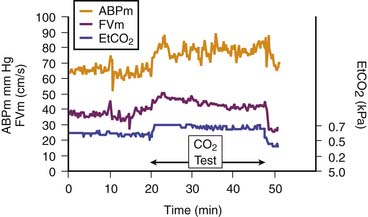
Figure 59–4 Cerebral vessels dilate when arterial content of carbon dioxide (here measured with end-tidal carbon dioxide [EtCO2]) increases. A rise in cerebral blood flow (here assessed with transcranial Doppler velocity [FVm]) also increases.5 ABPm, Mean blood pressure.
Cerebral Perfusion Pressure and Autoregulation
In adults, the lower limit for CPP is taken as a threshold of 60 to 70 mm Hg. In children, however, it is evident from measurement of normal ABP that the lower limit for CPP must be lower than this adult level for much of childhood (Figure 59-5).6 A new concept that has arisen in the adult critical care literature is worth considering in this context. The idea is that a autoregulatory reserve exists that is considered to be the difference between current mean CPP and the lower limit of autoregulation.7 This reserve may become exhausted. Alternatively, it may change over time, and it has been argued that the border between adequate and nonadequate CPP should be assessed individually and frequently.
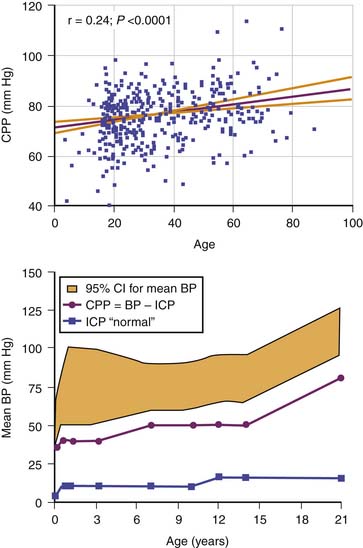
Figure 59–5 Top panel, The empiric relation between cerebral perfusion pressure (CPP) and age in nearly 400 adults after head injury. Bottom panel, Estimated lower limit of CPP by age in the pediatric range on the basis of normal blood pressure (BP) and intracranial pressure (ICP) data.6
How is this assessment performed? Autoregulation of CBF may be assessed by artificial manipulation of ABP with medication, but only at infrequent intervals and with the risk that the drugs used may have a direct cerebrovascular effect. Alternatively, transient hyperemia after transient carotid compression has been used as an all-or-none index of whether autoregulation is intact. A more sophisticated approach is to examine the effect of natural variation in ABP; however, this technique requires precise signal processing. For example, to date, the most robust clinical method is to monitor the slow fluctuations in ABP that last from 30 seconds to a few minutes and are almost always present in patients who undergo ventilation8–9; the rate of change observed is usually sufficient to provoke a noticeable vasomotor response. Figure 59-6 shows that continuous monitoring of cerebrovascular reactivity is possible with this method even during large spontaneous ICP waves (B and plateau waves; discussed later in this chapter).10
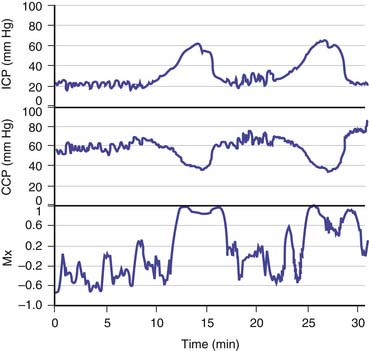
Figure 59–6 Continuous monitoring of cerebral autoregulation during plateau waves of raised intracranial pressure (ICP). Positive values of the autoregulation index (Mx) indicate faulty autoregulation.9 Autoregulation fails during the waves, when cerebral vasodilation occurs.10 CPP, Cerebral perfusion pressure.
Measurement of Intracranial Pressure
Monitoring Devices
The complications of ICP monitoring include infection, hemorrhage, CSF overdrainage, and monitor malfunction. The overall incidence of infection for the various forms of ICP monitors is not significantly different regardless of their location, but the severity of infection may differ slightly depending on the anatomic site of the device. Hemorrhage is a rare complication of ICP monitoring and is a direct result of surgical placement of the device. Overdrainage of ventricular catheters can result in rapid emptying of the ventricular system and accumulation of subdural hematomas. Close attention must be made to prevent drainage systems from being placed too low or falling to the floor. This complication is most serious when intraventricular pressure is monitored in children with hydrocephalus. Overdrainage also may result in pneumocephalus.
Overall, an intraventricular drain connected to an external pressure transducer is still considered the gold standard for measuring ICP.11,12 ICP can be controlled by CSF drainage, and the transducer can be adjusted to zero externally. After 5 days of monitoring, however, the risk of infection starts to increase, with an overall risk estimated to be about 5%.13 Insertion of the ventricular catheter may be difficult or impossible in cases of advanced brain swelling. As an alternative, modern catheter-tipped ventricular, subdural, or intraparenchymal microtransducers have been used (the most popular types are the Camino ICP Bolt, Camino Laboratories, San Diego, Calif., and Codman MicroSensor, Johnson and Johnson Professional Inc, Raynham, Mass.). These microtransducers are said to reduce the infection rate and risk of hemorrhage13 and have excellent metrologic properties.14 One disadvantage of microtransducer systems is that they cannot, in general, be readjusted to zero after insertion, and considerable zero drift sometimes can occur in long-term monitoring.15
Regarding other forms of monitoring, contemporary epidural sensors are much more reliable now than they were 10 years ago. Nevertheless, the question as to whether epidural pressure can express ICP with confidence and under all circumstances is still unanswered. Lumbar CSF pressure is seldom measured in patients receiving neurointensive care. This form of assessment of craniospinal dynamics is more often used in the assessment of hydrocephalus and benign intracranial hypertension. It is unreliable if the instantaneous value of the fluid column pressure is recorded; at least 30 minutes averaging in resting conditions (with a period of overnight monitoring as the gold standard) is the desired requirement. Finally, attempts to monitor ICP noninvasively are still in a phase of technical evaluation,16 with the most promising methods based on transcranial ultrasonography.17,18
Noninvasive Inference of Intracranial Pressure
It would be helpful to measure ICP or CPP without invasive transducers. To this end, transcranial Doppler (TCD) examination,19 tympanic membrane displacement,20 and ultrasound “time of flight”18 techniques have been suggested. The description of TCD sonography by Aaslid, Markwalder, and Nornes21 permitted bedside monitoring of one index of CBF noninvasively, repeatedly, and even continuously. The problem has been that it is a “big tube technique” that measures flow velocity in branches of the circle of Willis, most commonly the middle cerebral artery (MCA). Compliant branches of the MCA can be compared with two physiologic pressure transducers. The pattern of blood flow within these tubes is certainly modulated by transmural pressure, that is, CPP and the distal vascular resistance (also modulated by CPP). What is the calibration factor, and how should we compensate for unknown nonlinear distortion?
Reasonable correlation exists between the pulsatility index of MCA velocity and CPP after head injury, but absolute measurements of CPP cannot be extrapolated.22 Other investigators have suggested that “critical closing pressure” derived from flow velocity and arterial pressure waveform approximated the value of ICP.23 The accuracy of this method, however, has never been satisfactory.24 Aaslid et al.25 suggested that an index of CPP could be derived from the ratio of the amplitudes of the first harmonics of the ABP and the MCA velocity (detected with TCD sonography) multiplied by mean flow velocity. Recently, a method for the noninvasive assessment of CPP has been reported, derived from mean ABP multiplied by the ratio of diastolic to mean flow velocity.26 This estimator can predict real CPP—in the adult range (60 to 100 mm Hg)—with an error of less than 10 mm Hg for more than 80% of measurements. This method is of potential benefit for the continuous monitoring of changes in real CPP over time in situations where direct measurement of CPP is not readily available. Finally, a more complex method aimed at the noninvasive assessment of ICP has been introduced and tested by Schmidt et al.27 The method is based on the presumed linear transformation between ABP and ICP waveforms. All of these techniques still require validation in pediatric series.
Last, there is one other potential method for predicting increased ICP that has emerged from the adult literature and is now being tested in children. Optic nerve sonography can be used to assess enlargement of the optic nerve sheath, and it is sheath diameter that appears to be directly related to the level of ICP.28 A recent study by Le et al29 included 64 children, 24 (37%) of whom had a confirmed diagnosis of increased ICP. An optic nerve sheath diameter greater than 4.0 mm in subjects younger than 1 year and greater than 4.5 mm in older children was considered abnormal. The sensitivity of optic nerve sheath diameter as a screening test for increased ICP was 83% (95% confidence interval [CI], 0.60 to 0.94); specificity was 38% (95% CI, 0.23 to 0.54); positive likelihood ratio was 1.32 (95% CI, 0.97 to 1.79); and negative likelihood ratio was 0.46 (95% confidence interval, 0.18 to 1.23). Taken together, it is clear that this technique may be useful, but currently it is inadequate as an aid to decision making about whether raised ICP is present in a particular child.
Pressure Compartments
In a fluid-filled container, pressure is the same wherever one chooses to measure it within that space. Generally, uniformly distributed ICP can be seen only when CSF is circulating freely among all of its natural pools, equilibrating pressure everywhere. When little or no CSF volume is left (because of brain swelling), the assumption of one uniform value of ICP is questionable. (It is for this reason that brain tissue shift and herniation occur: they move down tissue pressure gradients.) It is worth remembering that with the commonly used catheter-tipped, intraparenchymal probes, the measurement of pressure is at a particular point, an area of cortex within a hemisphere, and the ICP may merely reflect pressure in that compartment rather than be representative of pressure within the ventricular system (i.e., real CSF pressure).30
Analysis of Intracranial Pressure
Normal Values in Intracranial Pressure Monitoring
Establishing a universal “normal value” for ICP is difficult because it depends on age, body posture, and clinical condition. In the horizontal position, a normal ICP value in healthy adults was reported to be within the range of 7 to 15 mm Hg.31 In the upright position ICP is a negative value, with a mean of around ~10 mm Hg but not exceeding ~15 mm Hg.32 In infants and children, normal values for ICP, usually taken at the time of a “negative” diagnostic lumbar puncture, are lower than the adult values and are probably between 5 and 10 mm Hg.
The definition of a raised ICP value depends on the specific disease. In hydrocephalus, a pressure above 15 mm Hg can be regarded as elevated. After head injury, any pressure above 20 mm Hg is considered abnormal, and aggressive treatment is usually started with values above 25 mm Hg.33 Also, in most cases, ICP varies with time. Decent averaging for at least 30 minutes is needed to calculate “mean ICP.” The patient should be in a horizontal position during the measurement, and movement should be avoided.
Normal Trends in Intracranial Pressure and Waveform Analysis
Overnight monitoring, during natural sleep, provides a “grand average” with a good description of the dynamics of ICP. When monitored continuously in acute states (e.g., in the presence of head injury, poor-grade subarachnoid hemorrhage, and intracerebral hematoma), changes in the time-averaged mean ICP may be classified into relatively few patterns (Figure 59-7).34 The first pattern, low and stable ICP (below 20 mm Hg) is seen after uncomplicated head injury (Figure 59-7, A). Such a pattern also is seen commonly in the initial period after brain trauma before brain swelling evolves. The second pattern, high and stable ICP (above 20 mm Hg), is the most common pattern to follow head injury (Figure 59-7, B). The third pattern is vasogenic waves, that is, B waves (Figure 59-7, C) and plateau waves (Figure 59-7, D). The fourth pattern is ICP waves related to changes in ABP and hyperemic events (Figure 59-7, E to G). The final pattern, refractory intracranial hypertension (Figure 59-7, H), usually leads to death unless surgical decompression is undertaken.
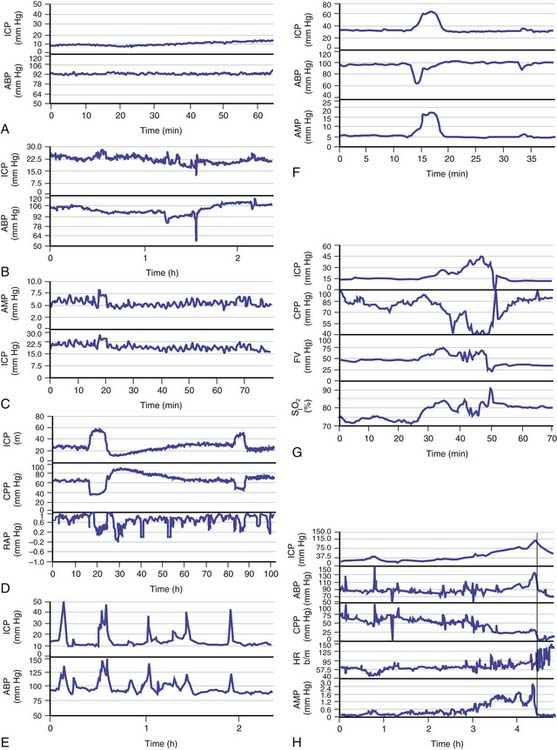
Figure 59–7 Examples of intracranial pressure (ICP) recording in various clinical scenarios after head trauma34; note the different scales. A, Low and stable ICP: mean arterial blood pressure (ABP) is plotted in the bottom panelB, Stable and elevated ICP: such a picture can be seen most of the time in patients with head injuries. C, B waves of ICP: these are seen both in mean ICP and spectrally resolved pulse amplitude of ICP (AMP). They also are usually seen in a plot of time-averaged ABP, but not always. D, Plateau waves of ICP: cerebrospinal compensatory reserve is usually low when waves are recorded (the correlation coefficient between AMP and mean ABP, RAP, is close to +1). At the top of the waves, during maximal vasodilatation, integration between pulse amplitude and mean ICP fails, as indicated by afall in RAP. After the plateau wave, ICP usually falls below the baseline level and cerebrospinal compensatory reserve becomes better. CPP, Cerebral perfusion pressure. E, High, spiky waves of ICP caused by sudden increases in ABP. F, Increase in ICP caused by temporary decrease in ABP. G, Increase in ICP of hyperemic nature: both blood flow velocity (FV) and jugular bulb oxygen saturation (SjO2) increase in parallel with ICP. H, Refractory intracranial hypertension: ICP increases within a few hours to 100 mm Hg. The vertical line denotes the likely moment when the vasomotor centers in the brainstem became ischemic. At this point the heart rate (HR) increased and CPP decreased abruptly. Note that pulse amplitude of ICP (AMP) disappeared around 10 minutes before this terminal event.
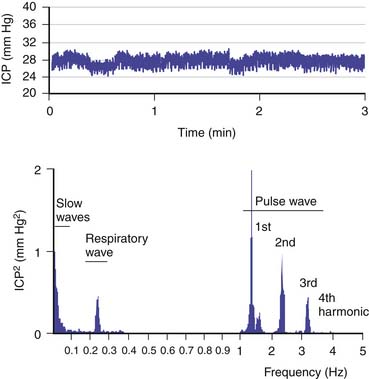
In addition to these patterns, more information can be gained from analyzing the ICP waveform. The ICP waveform consists of three components, which overlap in the time domain but can be separated in the frequency domain (Figure 59-8).34,35 The pulse waveform has several harmonic components; of these, the fundamental component has a frequency equal to the heart rate. The amplitude of this component (AMP) is useful for the evaluation of various indices. The respiratory waveform is related to the frequency of the respiratory cycle (8 to 20 cycles/min). “Slow waves” are usually not as precisely defined as in Lundberg’s original work36; that is, all components that have a spectral representation within the frequency limits of 0.05 to 0.0055 Hz (20-second to 3-minute period) are considered slow waves. The magnitude of these waves can be calculated as the square root of the power of the signal, of the passband, or of the equivalent frequency range at the output of the digital filter.
Assessment of Pressure-Volume Compensatory Reserve and Cerebrovascular Pressure Reactivity
Theoretically, the compensatory reserve in intracranial hydrodynamics can be studied through the relation between ICP and changes in volume of the intracerebral space, known as the pressure-volume curve.37,38 For example, the RAP index, an index of reserve based on the correlation coefficient (R) between AMP amplitude (A) and mean pressure (P), can be derived. This calculation can be done in real time with bedside computing to calculate the linear correlation between consecutive, time-averaged data points of AMP and ICP (usually 40 such samples) acquired over a reasonably long period to average over respiratory and pulse waves (usually 6- to 10-second epochs). The RAP index indicates the degree of correlation between AMP and mean ICP over short periods (~4 minutes). An RAP index close to zero indicates lack of synchronization between changes in AMP and mean ICP. This index denotes good pressure-volume compensatory reserve at low ICP (i.e., a change in volume produces little or no change in pressure) (Figure 59-9).39 When the RAP index rises to +1, AMP varies directly with ICP and indicates that the “working point” of the intracranial space shifts to the right toward the steep part of the pressure-volume curve. Here compensatory reserve is low; therefore any further rise in volume may produce a rapid increase in ICP. After head injury and subsequent brain swelling, the RAP index is usually close to +1. With any further increase in ICP, AMP decreases and RAP values fall below zero. This phenomenon occurs when cerebral autoregulatory capacity is exhausted; the pressure-volume curve bends to the right, the capacity of cerebral arterioles to dilate in response to a fall in CPP is exhausted, and the arterioles tend to collapse passively. This phenomenon indicates terminal cerebrovascular derangement with a decrease in pulse pressure transmission from the arterial bed to the intracranial compartment.
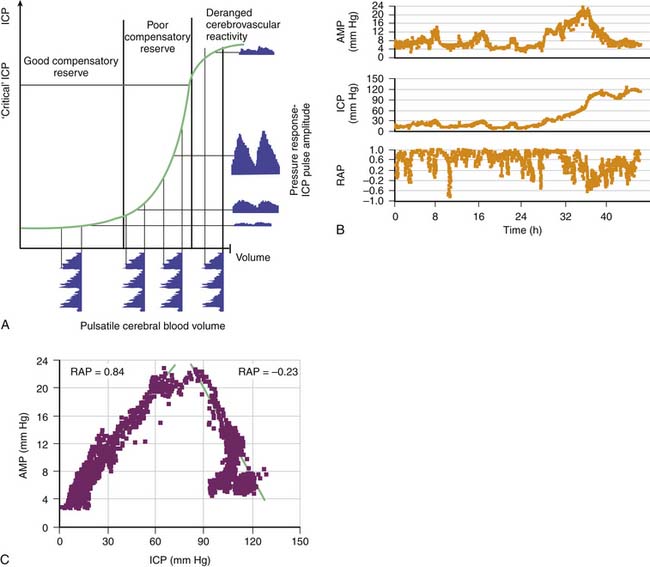
Figure 59–9 A, In a simple model, pulse amplitude of intracranial pressure (ICP) (AMP, expressed along the y axis on the right side of the panel) results from pulsatile changes in cerebral blood volume (expressed along the x axis) transformed by the pressure-volume curve. This curve has three zones: a flat zone, expressing good compensatory reserve; an exponential zone, depicting poor compensatory reserve; and a flat zone again, seen at very high ICP (above the “critical” ICP), depicting derangement of normal cerebrovascular responses. The pulse amplitude of ICP is low and does not depend on mean ICP in the first zone. The pulse amplitude increases linearly with mean ICP in the zone of poor compensatory reserve. In the third zone, the pulse amplitude starts to decrease with rising ICP. B, Example of the relation between AMP and mean ICP recorded during a 46-hour period, during which terminal intracranial hypertension developed. Pulse amplitude increased first proportionally to the change in ICP but started to decrease when ICP increased above 80 mm Hg. C, The regression plot between AMP and ICP indicates a biphasic relation of positive and negative slopes. The correlation coefficient between AMP and ICP (RAP) was positive before 32 hours but negative after that; this indicated terminal cerebrovascular deterioration.39


Stay updated, free articles. Join our Telegram channel

Full access? Get Clinical Tree


