Indications for Mechanical Ventilation: Introduction
This chapter discusses the indications for mechanical ventilation in adult patients. We focus on patients who are already in the intensive care unit (ICU) or who are considered for transfer to the ICU, that is, patients with new onset of signs and symptoms over minutes or hours. We do not deal with the indications for mechanical ventilation for chronic respiratory failure or in pediatric patients; these subjects are covered in Chapters 23, 18, 33, and 34.
There is a paucity of research—and no clinical trials—on the indications for mechanical ventilation. This situation contrasts with the growing amount of research on the discontinuation of mechanical ventilation. Although it is tempting to apply indices used for predicting the outcome of weaning trials as indices to identify patients who require mechanical ventilation, such an approach has not been tested. It is also probably unwise.
Two factors account for the limited research on indications for mechanical ventilation. First, such patients are extremely ill. Any intervention—such as careful collection of physiologic measurements—that delays institution of ventilation might be viewed as unethical. Second, the nosology of respiratory failure is unsatisfactory (see “Nosology” below). In everyday practice, clinicians do not decide to institute mechanical ventilation because a patient meets certain diagnostic criteria. Instead, clinicians typically decide to institute ventilation based on their assessment of a patient’s signs and symptoms. This decision is also grounded on a foundation of solid biomedical theory, specifically principles of pulmonary pathophysiology. Accordingly, we develop our discussion of ventilator indications along these two lines: physical examination and pathophysiologic principles.
Overall Assessment
Clinical presentations that cause a physician to institute mechanical ventilation are protean. They range from patients presenting with frank apnea to patients with clinical signs of increased work of breathing with or without laboratory evidence of impaired gas exchange.1
Apneic patients, such as those who have suffered catastrophic central nervous system (CNS) damage, need immediate institution of mechanical ventilation. To advocate controlled trials to determine the need for mechanical ventilations in apneic patients is unethical.
Asthma, chronic obstructive pulmonary disease (COPD), pneumonia, cardiogenic pulmonary edema, and acute respiratory distress syndrome (ARDS) are just a few of the many conditions that cause an increase in work of breathing and, with it, increased energy expenditure by the respiratory muscles.
The energy expenditure of the respiratory muscles can be quantified in terms of pressure-time product2—the time integral of the difference between the esophageal pressure tracing and the estimated recoil pressure of the chest wall3,4 (Fig. 4-1). The pressure-time product of patients in acute respiratory failure is about four times5–7 the normal value (100 cm H2O·s/min), and it can be increased sixfold in individual patients.5,6 The inspiratory pressure-time product can be partitioned into resistive, elastic, and intrinsic positive end-expiratory pressure (PEEP) components (Fig. 4-1).6 Patients in respiratory distress typically have a 30% to 50% greater inspiratory resistance,6 100% greater dynamic elastance,6 and 100% to 200% greater intrinsic PEEP5,6 than do similar patients who are not in acute respiratory failure. Inspiratory effort is almost equally divided in offsetting intrinsic PEEP, elastic recoil, and inspiratory resistance.6 The increase in respiratory effort means that the respiratory muscles account for a much larger fraction of the body’s oxygen consumption. In healthy subjects, this fraction is only 1% to 3% of total oxygen consumption. In patients with acute hypoxemic respiratory failure and shock who are undergoing cardiopulmonary resuscitation, the respiratory muscles account for approximately 20% of total oxygen consumption.8
Figure 4-1
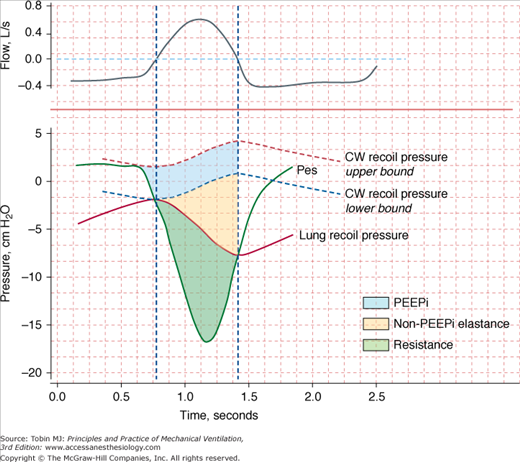
Flow (inspiration upward) and pressure tracings during spontaneous breathing. Recoil pressures of the chest wall (CW) and lung are calculated from dynamic elastances of the chest wall and lung, respectively, and lung volume. Inspiratory pressure-time product (PTP) is calculated using the integral of the difference between esophageal pressure (Pes) and CW recoil pressure from the onset of the rapid decrease in Pes to the transition from inspiratory to expiratory flow (upper-bound PTP). The component of PTP caused by intrinsic positive end-expiratory pressure (PEEPi) is computed using the integral of the difference between the upper-bound PTP and CW recoil pressure from the onset of rapid decrease in Pes to the transition from inspiratory to expiratory flow (lower-bound PTP). The component of PTP caused by non-PEEPi elastance is computed using the integral of the difference between lung recoil pressure and lower-bound CW recoil pressure from the onset of inspiratory flow to the moment of transition from inspiratory to expiratory flow. The resistive fraction of PTP is computed using the integral of the difference between Pes and lung recoil pressure. The vertical interrupted lines represent points for zero flow. (Modified, with permission, from Jubran and Tobin.6)
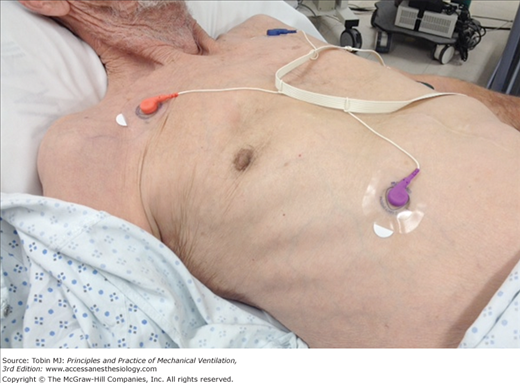
Increased work by the respiratory muscles causes respiratory distress. Clinical manifestations of respiratory distress include nasal flaring, retraction of the eyelids, accessory muscle recruitment, expiratory muscle recruitment (Fig. 4-2), tracheal tug, intercostal recession, tachypnea, tachycardia, hypertension or hypotension, diaphoresis, and changes in mental status.
Figure 4-2
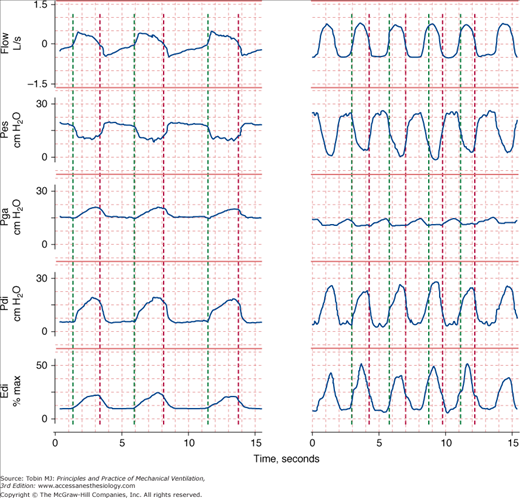
Respiratory effort during unassisted respiration. Recordings of flow (inspiration upward), esophageal (Pes), gastric (Pga), and transdiaphragmatic (Pdi) pressures and electrical activity of the diaphragm (Edi) in a stable patient with COPD (left) and in a patient with respiratory failure (right). The green vertical lines indicate the onset of inspiratory flow and the red vertical lines indicate the onset of expiratory flow. The excursions in Pes and Edi in the patient in respiratory failure are three times greater than in the stable patient, signifying heightened respiratory motor output. The increase in Pga during exhalation in the patient with respiratory failure signifies expiratory muscle recruitment.
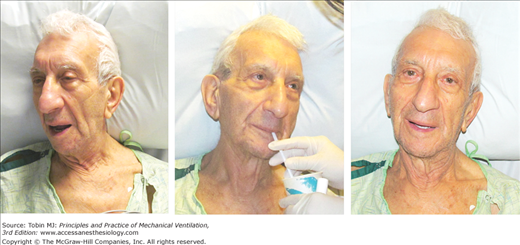
Many intensivists decide to institute mechanical ventilation based on a patient’s facial appearance.9 Gilston has provided an insightful description of many signs that go unstated in reviews on mechanical ventilation.9 Consider, for example, the mouth. At an early stage of respiratory distress, the mouth opens slightly and to a variable extent during inhalation (Fig. 4-3). At a later stage, the mouth opens throughout the respiratory cycle. Patients may switch to mouth breathing perhaps to decrease respiratory work9,10 and physiologic dead space ventilation.9 An open mouth is sometimes seen in patients with a tracheostomy (Fig. 4-4) and in patients receiving ventilator support.9 The tongue may be seen to jerk in unison with inspiratory efforts.9
Figure 4-3
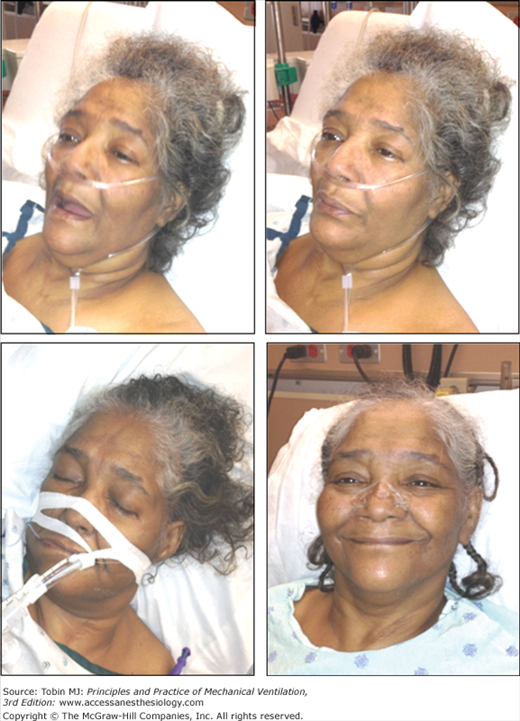
Change in facial appearance during the development and resolution of acute respiratory failure resulting from congestive heart failure and exacerbation of chronic obstructive pulmonary disease. Left upper panel: The patient is dyspneic and her mouth is open on inhalation. Right upper panel: The patient exhibits pursed-lip breathing on exhalation. Over the ensuing 24 hours, the patient developed hypercapnic respiratory failure and failed a trial of noninvasive ventilation (not shown). Left lower panel: The patient is intubated and receiving mechanical ventilation. Right lower panel: The patient is successfully extubated 4 days after institution of mechanical ventilation.
Figure 4-4
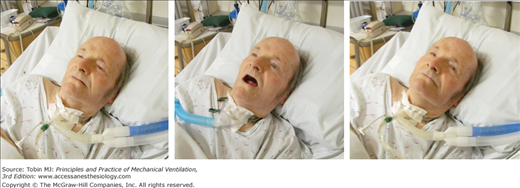
Change in the configuration of the mouth in a patient with a tracheostomy who becomes dyspneic. Left: The patient is resting during full ventilator support and his mouth is closed. Middle: Twelve minutes after disconnection from the ventilator, the patient has developed dyspnea and anxiety and his mouth is open. Right: Thirty minutes after reconnection to the ventilator, the patient’s respiratory distress has resolved and his mouth is closed.
Some distressed patients also exhibit pursed-lip breathing during exhalation (see Fig. 4-3).9 In stable, ambulatory patients with COPD, pursed-lip breathing is associated with an increase in tidal volume,11 a decrease in respiratory rate,11 and, in patients with severe obstruction, with a decrease end-expiratory lung volume.12 Pursed-lip breathing can improve the arterial tensions of both carbon dioxide (PaCO2) and oxygen (PaO2), whereas oxygen uptake ( ) remains unchanged.11 The latter finding suggests that pursed-lip breathing may allow a decrease in cardiac output without changing tissue oxygenation.11 Alternatively, if cardiac output does not decrease, pursed-lip breathing may increase mixed venous oxygen saturation, resulting in better tissue oxygenation.11 Pursed-lip breathing is thought to improve gas exchange by preventing airway collapse. As a result, gas trapping is decreased, resulting in an increase in tidal volume.11
A few patients in respiratory distress moan during exhalation. Such moans have been compared with the grunting that is typical of neonates with the respiratory distress syndrome.9 Grunting results from glottic closure and expiratory muscle recruitment during early exhalation.13 It is associated with a rise in transpulmonary pressure and oxygenation.13 If grunting is prevented by tracheal intubation, oxygenation deteriorates.13 Use of continuous positive airway pressure (CPAP) improves oxygenation and eliminates grunting.14 The improvement in oxygenation may result from grunting acting as a natural form of PEEP that recruits collapsed alveoli and partially overcomes inequalities in gas distribution caused by differing time constants. Of course, grunting also can arise with disease outside the thorax, such as with an acute abdomen.15
Nasal flaring, another facial sign of respiratory distress, is caused by contraction of the alae nasi, the dilator muscle of the external nares.10 In adults, nasal flaring reduces nasal resistance by approximately 40% to 50% and total airway resistance by approximately 10% to 30%.10 Factors regulating alae nasi activity include chemical stimuli that cause hyperpnea (hypoxia and hypercapnia),10,16,17 inspiratory resistive loading,17 and local stimuli (negative intraluminal nasal pressure).16 The proportion of patients in respiratory distress who present with nasal flaring is unknown, as is the level of interobserver agreement in detecting flaring. Ventilator support reduces or eliminates alae nasi activity.18,19
Diaphoresis, often best detected on the forehead,9 accompanies respiratory distress in some patients. Among forty-nine patients admitted to the emergency ward for acute bronchial asthma, Brenner et al20 found that nine patients had profuse sweating. This subgroup displayed greater abnormalities in peak expiratory flow rate and PaCO2. In patients with respiratory distress, diaphoresis may result from increased work of breathing,21 sympathetic stimulation,21,22 and hypercapnia-associated cutaneous vasodilation.21,23 In contrast, diaphoresis in patients with heart failure often is associated with hypoperfusion of the skin, vasoconstriction, and cold extremities.21
Mentation can be evaluated by inspection of the face and by simple questioning. With early respiratory distress, nearly all patients are anxious, and their eyelids are retracted. As distress increases, the level of consciousness often decreases, and the lids tend to fall (Fig. 4-5). Instead of remaining alert to their surroundings, patients gaze vacantly ahead.9 If respiratory failure is left untreated, apathy leads to drowsiness and then coma. These changes in mentation arise because of the underlying cause of respiratory failure (decreased cardiac output in cases of shock, impaired neurologic function in sepsis), acute hypercapnia,24 or to a lesser extent, hypoxemia.24,25 In a classic description, Campbell noted that most (nonhypotensive) patients with an exacerbation of COPD have preserved consciousness on arrival to the emergency room despite PaO2 being as low as 20 to 40 mm Hg.25 Although extremely useful in overall patient assessment, facial signs of respiratory distress do not necessarily translate into an automatic decision to intubate a patient (Fig. 4-5).
Figure 4-5
Drooping of the eyelids accompanying deterioration of mental status during an episode of respiratory failure. Left: A patient developed respiratory compromise secondary to atrial fibrillation and heart failure 2 days after prostate surgery. The patient is drowsy with drooping eyelids, and is moderately dyspneic with an open mouth and groans during exhalation. Middle: Despite respiratory compromise, the patient is able to drink. Right: After 2 days of medical therapy, the patient’s dyspnea has resolved and he is alert, cheerful, and talkative.
Increased respiratory loads in healthy subjects26,27 and in ambulatory patients with COPD28 are met with a proportionately greater use of the rib-cage muscles than of the diaphragm.26–28 As the load increases, the expiratory muscles are recruited.26,27,29 In addition to increased activity of rib cage and abdominal muscles, the respiratory centers may increase activity of the accessory muscles, especially the sternomastoids.30–32 The sternomastoids are activated in patients with respiratory compromise30 and in healthy subjects breathing with a high level of inspiratory effort. The threshold for sternomastoid activation, however, is lower in patients.31 In patients with respiratory distress,5,33 sternomastoid recruitment can be phasic (during inhalation) (Fig. 4-6) or tonic.29,32 Some patients hold their head off the pillow to enhance sternomastoid action.9
Changes in respiratory rate are one of the most useful signs in evaluating the need for mechanical ventilation. Tachypnea is a near-universal sign accompanying respiratory distress.
Obtaining reliable measurements of respiratory rate and interpreting the values are not straightforward. First, bedside assessment often is inaccurate. In one study, 40% of nurses’ estimations of respiratory frequencies deviated by more than 20% from the true value.34 Agreement as to the presence of tachypnea among physicians, expressed as a κ value (κ of 0 indicates that agreement is no better than chance; κ of 1 indicates complete agreement), was only 0.25.35 Second, the within-day (within an individual) coefficient of variation in respiratory rate among young, healthy adults is 21 ± 12%; in old, healthy adults, it is 29 ± 11%.36 Thus, accurate quantification of respiratory rate requires counting more breaths than contained in the usual 15-second sample.36,37 Third, the day-to-day coefficient of variation of respiratory rate is 7 ± 2% in healthy individuals36; the value in patients with pulmonary diseases is unknown. Fourth, the typical respiratory rate in patients with different disease states varies from one state to the next37 (Table 4-1); a rate that is judged high in a previously healthy subject may arouse no concern in a patient with restrictive disease. The upper limit of normal (mean + 2 standard deviations [SD]) in health is 22 breaths/min.37 The equivalent value for stable patients with COPD is 30 breaths/min, and for patients with restrictive lung disease, 44 breaths/min.37
| Condition | Number of Subjects | Mean (breaths/min) | SD | Mean + 2 SD |
|---|---|---|---|---|
| Healthy nonsmoker | 65 | 16.6 | 2.8 | 22.2 |
| Healthy smoker | 22 | 18.3 | 3.0 | 24.3 |
| Asthma | 17 | 16.6 | 3.4 | 23.4 |
| COPD, eucapnia | 16 | 20.4 | 4.1 | 28.6 |
| COPD, hypercapnia | 12 | 23.3 | 3.3 | 29.9 |
| Restrictive lung disease | 14 | 27.9 | 7.9 | 43.7 |
| Pulmonary hypertension | 7 | 25.1 | 6.4 | 37.9 |
| Chronic anxiety | 13 | 18.3 | 2.8 | 23.9 |
Despite limitations in its measurement, tachypnea is an important clinical sign. In a retrospective case-controlled study of patients discharged from an ICU, the only continuous variables that predicted readmission to the ICU were higher respiratory rate (24 vs. 21 breaths/min) and lower hematocrit.38 Readmitted patients had a much higher mortality than the control patients, 42% and 7%, respectively, and respiratory problems accounted for more than half the readmissions. Of eighteen patients who were discharged from the ICU with a respiratory rate of more than 30 breaths/min, twelve required readmission. In a study of patients who had experienced a cardiopulmonary arrest, 53% had documented deterioration in respiratory function in the 8 hours preceding the arrest.39 Of interest, respiratory rate was elevated in most patients (mean: 29 ± 1 [SE (standard error)] breaths/min), whereas other routine laboratory tests showed no consistent abnormalities. That detection of tachypnea did not lead to a change in patient management (in an effort to prevent the arrest) led the authors to surmise that physicians do not fully appreciate its clinical importance.
Shallow respiration (when measured with instrumentation) is common in patients with acute respiratory distress.40 Judging tidal volume as shallow based on physical examination is very unreliable.41,42 Clinical skill in this task is not improved by years of experience.42
Patients in distress commonly display abnormal chest wall movements.43,44 Abnormal movements can be separated into three categories. One, asynchrony, consists of a difference in the rate of motion of the rib cage and abdomen (Fig. 4-7). Two, paradox, consists of one compartment moving in the opposite direction to tidal volume (Fig. 4-7). The third abnormality is greater-than-normal breath-to-breath variation in the relative contribution of the rib cage and abdomen to tidal volume; this pattern, termed respiratory alternans, represents recruitment and derecruitment of the accessory intercostal muscles and the diaphragm. In the past, it was thought that these three abnormalities of motion represented respiratory muscle fatigue.45 It is now known that they represent signs of increased load and occur in the absence of fatigue.46 These abnormalities are seen not only in patients with respiratory distress,47 but also in some ambulatory patients37,47 and during sleep (sleep apnea syndrome).48
Figure 4-7
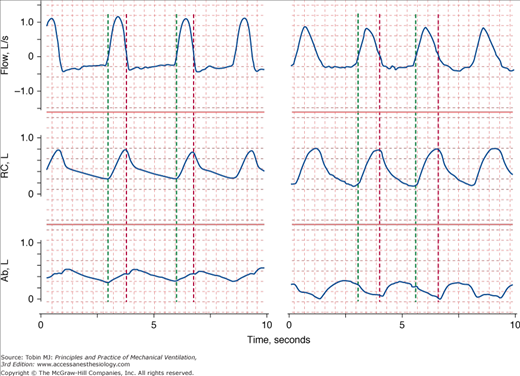
Recordings of flow (inspiration upward), rib cage (RC), and abdominal (Ab) cross-sectional areas in two patients in respiratory distress. The green vertical lines indicate the onset of inspiratory flow and the red vertical lines indicate the onset of expiratory flow. On the left, expansion of the rib cage is occurring faster than expansion of the abdomen (asynchrony). On the right, while the rib cage expands during inspiration, the abdominal cross-sectional area is getting smaller (paradox).
Increased tidal swings in intrathoracic pressure are axiomatic to increases in the work of breathing. The greater downward movement of the diaphragm tends to pull down the trachea (just as a sexton ringing a bell) with each inspiration,49 producing a sign termed tracheal tug. Tracheal tug correlates closely with severity of airway obstruction (Fig. 4-8).50
Figure 4-8
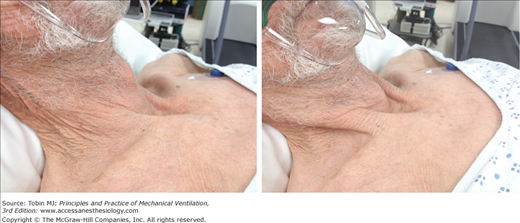
Tracheal tug in acute respiratory failure. Left: During exhalation, the cricoid cartilage is located 2 fingerbreaths above the suprasternal notch (normally, at least 4 fingers). Right: During inhalation, the cricoid cartilage is pulled below the suprasternal notch and the thyroid cartilage is 1 fingerbreath above the suprasternal notch, whereas it was 5 fingerbreaths above the notch on exhalation (left).
The intercostal spaces normally bulge inward during inhalation and outward during exhalation.15 Inspiratory retraction of the intercostal space—serving as a window into the pleural space—is increased in patients with respiratory disease (see Fig. 4-6). The suprasternal fossa also moves inward in direct proportion to swings in pleural pressure.51,52 Focal exaggerated retraction of the intercostal space can occur with a flail chest. Focal expiratory bulging may be seen on the side of a tension pneumothorax or over the area of a flail chest.15 As with other physical signs, studies often reveal poor agreement among physicians.35,53 For example, Godfrey et al53 found agreement among eleven relatively experienced chest physicians in identifying tracheal tug to be midway between chance and maximum possible agreement. Spiteri et al35 found poor agreement among experienced physicians for detecting reduced chest movements (κ = 0.38) and cricosternal distance (κ = 0.28)35; they did not address tracheal tug or inspiratory retractions.
The interpretation of data generated by studies that quantify physical signs is hazardous. The entity that researchers are quantifying can be very different from the skill involved in the physician’s actions. Physical examination is an art—learned through apprenticeship, not out of a book. Thus, we should bear in mind Braque’s caution about art appreciation: “The only thing that matters in art can’t be explained.” Likewise, the essence of physical examination is its tacit coefficient; the explicit, measurable components may be the least relevant. Another problem with research on physical signs is test-referral bias. For example, the studies of Godfrey et al53 and Spiteri et al35 were confined to patients with respiratory diseases; a more appropriate design also would have included healthy subjects and patients with diseases not affecting the lungs. These flaws in the methodology of such studies markedly underestimate the diagnostic power of physical examination.
Respiratory distress frequently is associated with tachycardia and hypertension. Tachycardia and hypertension likely are caused by increased sympathetic discharge.54 In some patients, such as those with sepsis, cardiac impairment, or severe hypoxemia, respiratory distress is associated with hypotension and not hypertension.
Pulsus paradoxus is defined as an inspiratory fall in systolic pressure of greater than 10 mm Hg.15 Pulsus paradoxus is very common in patients with an exacerbation of asthma but also in patients with COPD, shock, and pericardial tamponade (see Chapter 36).15,20
Patients with impending respiratory failure do not have a uniform presentation. The spectrum ranges from a patient complaining of dyspnea to a patient with impending respiratory arrest. Several factors are responsible. Patients differ in the balance between work of breathing and the capacity of the respiratory muscles to generate pressure. They also differ in the central processing of neural afferents. For instance, patients with a history of near-fatal asthma have a blunted perception of dyspnea,55 reduced sensitivity to added inspiratory resistive loads,56 and a reduced chemosensitivity to hypoxia.55 Alexithymia, the difficulty in perceiving and expressing emotions and body sensations, occurs more often in patients who experience near-fatal asthma than in less-severely affected patients.57 In addition, hypoxia, and possibly hypercapnia, can impair sensations of respiratory load.58
Development of impending respiratory failure is a commonly listed indication for mechanical ventilation.59 But impending respiratory failure has no clear definition. Some clinicians use the term to mean development of severe tachypnea, diaphoresis, and use of accessory muscles of respiration; others use it to mean agonal breathing.
In some circumstances, physicians do not institute mechanical ventilation until they obtain results of diagnostic testing, such as chest radiographs, electrocardiograms, or arterial blood-gas analyses. Even in this situation, clinicians commonly do not change their mind when the test results are different from those expected. In most circumstances, a patient’s clinical presentation is so dramatic that mechanical ventilation is instituted without performing arterial blood-gas analysis. If arterial blood-gas results are not available before connecting a patient to a ventilator, they are almost invariably available shortly after. Arterial blood-gas analysis is helpful in choosing the type of support best suited to a patient’s needs. Analysis also serves to classify patients into two broad groups: hypoxemic respiratory failure (Table 4-2) and hypercapnic respiratory failure; some patients display features of both.60
|
The pathophysiologic mechanisms responsible for hypoxemia can be grouped into two broad categories depending on whether there is (or is not) an increased alveolar-arterial oxygen gradient (A-aDO2).* An increased A-aDO2 results from either ventilation–perfusion ( ) abnormalities or excessive right-to-left shunt. (Diffusion impairment, a third cause of increased A-aDO2, plays only a marginal role in the development of hypoxemia.) Patients with hypoxemic respiratory failure and a normal A-aDO2 typically have alveolar hypoventilation or inadequate inspiratory partial pressure of oxygen. Hypoxemia results from a low inspired PO2 or when the fractional concentration of inspired oxygen (FIO2) is less than 0.21, such as at high altitude or when O2 is consumed from ambient gas secondary to a fire. A low also can arise during anesthesia if a low-oxygen gas mixture is administered inadvertently. Hypoxemic respiratory failure also can be caused by the combination of a decreased mixed venous oxygen content and impaired gas exchange, such as in patients with heart failure and concurrent
  derangements or increased shunt.
A right-to-left shunt is present when venous blood returning from the tissues passes to the systemic arterial circulation without coming into contact with gas-containing alveoli. The shunt is the major mechanism of abnormal gas exchange in patients with pulmonary edema, ARDS, pneumonia, and atelectasis. In all these instances, the shunt results from the perfusion of alveoli that are unventilated because they are filled with fluid or collapsed.
A characteristics feature of a shunt is the failure of PaO2 to increase to the expected level when a patient breathes 100% oxygen (Fig. 4-9).61
Figure 4-9
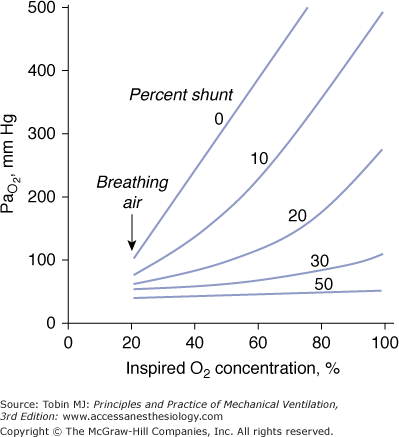
Relationship between arterial PO2 (PaO2) and increases in inhaled oxygen concentrations for different levels of shunt. When the shunt fraction is 30% or more of cardiac output, PaO2 increases little despite marked increases in inhaled oxygen concentration. The plot is a simplification that ignores factors such as cardiac output and oxygen uptake, which influence the location of the lines. (Modified, with permission, from West.61)
In patients with a large shunt, PaCO2 may be low because the low PaO2 stimulates respiratory motor output and minute ventilation ( ).62 A shunt typically produces more severe hypoxemia than does
  inequality.
Optimal uptake of oxygen depends on proper matching of ventilation and perfusion within the lung. In semirecumbent young healthy subjects breathing room air, the range (or dispersion) of  ratios is quite small: More than 95% of both ventilation and perfusion is limited between
  ratios of 0.3 and 2.1.63 The dispersion increases with age.63 With pulmonary disease, the range of
  ratios widens,64 varying from 0 (perfused but unventilated, i.e., shunt) to infinity (ventilated by unperfused, i.e., alveolar dead space). In other words,
  inequality does not refer to alterations in the ratio of total ventilation to total perfusion, which constitute global hyperventilation or hypoventilation. (One lung could receive all ventilation and the other all perfusion for an overall
  ratio of 1.0).65
  inequality refers to regional mismatching of ventilation to perfusion.
  inequality, no matter what its mechanism, interferes with overall efficiency of the lung for exchanging all gases, including oxygen, CO2, CO, and anesthetic gases.62
 mismatch is the most common cause of hypoxemia. Several compensatory mechanisms tend to minimize the effects of abnormal
  ratios. The low PAO2 associated with a low
  ratio causes pulmonary vasoconstriction. The low PACO2 associated with a high
  ratio causes hypocapnic bronchoconstriction (e.g., pulmonary embolism).66 These responses, however, only achieve partial compensation. As
  inequality increases in the presence of a constant
  and
and  , there is an immediate and marked fall in PaO2 and a slower increase in PaCO2. The increase in PaCO2 and, to a lesser extent, the fall in PaO2 stimulates the chemoreceptors and leads to an increase in
  . In patients without a significant reduction in ventilatory capacity, the increase in ventilation is sufficient to bring PaCO2 back to normal, although it has only a small effect on the fall in PaO2 (Fig. 4-10). Thus, most patients with
  inequalities have a low PaO2 but normal PaCO2.67 Ventilation in excess of normal alveolar requirement is termed wasted ventilation.62 All normocapnic patients with COPD have increased ventilation of their alveoli, as do most hypercapnic patients.62
Figure 4-10
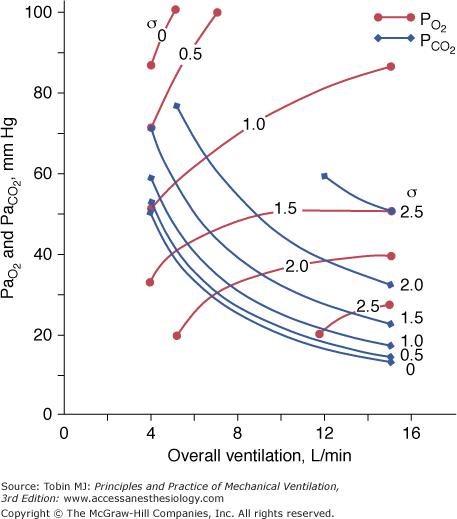
Effect of increasing overall ventilation PaO2 on and PaCO2 (lung model) as a function of different degrees of  mismatching, represented in terms of dispersion or standard deviations (σ) of the lognormal distribution of ventilation and perfusion. (Dispersion of 0.30 to 0.05 = normal
  mismatch; 1.0 = moderate
  mismatch; 2.0 = severe
  mismatch.) Increases in overall ventilation have a powerful effect on PaO2 and PaCO2 when
  dispersion is small. Abnormal
  dispersion does not cause an increase in PaCO2 as long as patients are able to increase minute ventilation sufficiently. PaO2 also increases with increases in overall ventilation, although when
  dispersions are (very) altered, normal PaO2 cannot be reached very easily, and further effects on ventilation have little effect on PaO2. In the patients who cannot maintain a high rate of ventilation owing to the increased work of breathing and in those whose respiratory motor output increases only slightly when PaCO2 is high, hypercapnia can ensue. (Modified, with permission, from West.64)
The different responses of PaO2 and PaCO2 to an increase in the level of ventilation is caused by the different shapes of the oxyhemoglobin and CO2 dissociation curves (Fig. 4-11). The oxyhemoglobin dissociation curve is flat in the normal range. Thus, only units with moderately low  ratios benefit appreciably from the increased ventilation. Lung units that are positioned on the upper portion of the dissociation curve (high
  ratio) develop little increase in the oxygen concentration of their effluent blood. The net result is that with increasing
  , the mixed PaO2 rises only modestly, and some hypoxemia always remains.62 By contrast, the CO2 dissociation curve is almost linear in the physiologic range (Fig. 4-11). Thus, an increase in
  raises CO2 output of lung units with both high and low
  ratios.62 The different shapes of the two dissociation curves are the main reason that patients with parenchymal lung disease have greater hypoxemia relative to hypercapnia. One final compensatory adjustment is possible: increase in cardiac output.68 Adrenergic stimulation by arterial hypoxemia can raise cardiac output by 50% or more; this improves arterial blood gases by raising mixed venous oxygen and by lowering mixed venous CO2.68
Figure 4-11
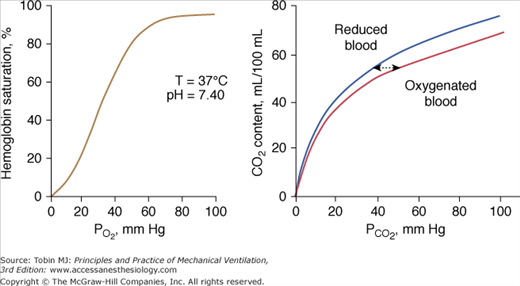
Left: Normal oxyhemoglobin dissociation curve. The curve has a sigmoid shape because when one subunit of the normal tetrameric form of the adult hemoglobin becomes oxygenated, it induces a structural change in the whole complex. Consequently, the three other subunits gain a greater affinity for oxygen until four molecules of oxygen are combined with hemoglobin. Right: The CO2 dissociation curve for oxygenated and reduced blood. The relationship is steeper and more linear than the oxyhemoglobin dissociation curve. Oxygenation of blood causes the curve to shift to the right (Haldane effect), and, for a given CO2 content, oxygenated blood has a higher PCO2 than reduced blood.
Administration of supplemental oxygen in patients with  inequality will cause arterial hypoxemia to reverse impressively because PAO2 of even poorly ventilated units increases sufficiently to achieve saturation (Fig. 4-12). Unless FIO2 is 1.0, it is impossible to determine the relative contribution of right-to-left shunt versus
  inequality to an increase in A-aDO2.69 After breathing 100% oxygen for a sufficient time, only units that are totally or almost totally unventilated (shunt, true shunt, or anatomic shunt) will contribute to hypoxemia.69
Figure 4-12
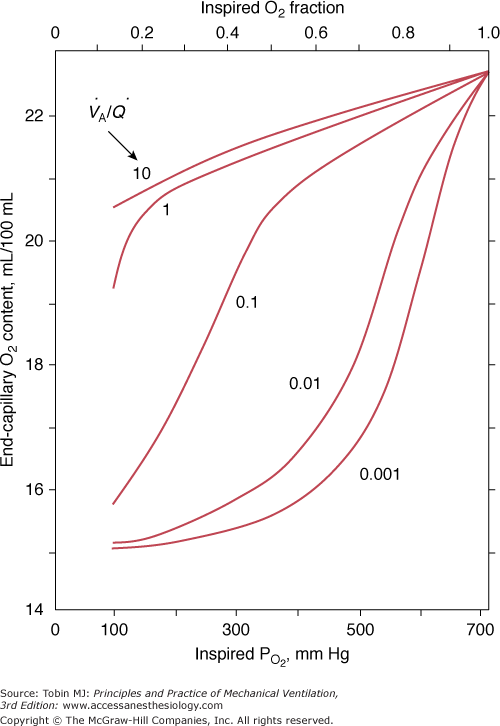
The effect of alterations in inhaled partial pressure of oxygen (PO2) on oxygen content of end-capillary blood of a lung unit. Each line depicts a different ventilation–perfusion ratio ( ). With mild to moderate degrees of
  inequality (
 down to 0.1), end-capillary oxygen content increases as inhaled oxygen is increased. With severe
  inequality (
 below 0.1), the increase in end-capillary oxygen content with an increase in inhaled oxygen is much slower; only when inspired PO2 is more than 400 to 500 mm Hg does end-capillary oxygen content of the lung unit reach values equivalent to those seen with mild to moderate degrees of
  inequality. (Modified, with permission, from West.64)
Systemic hypotension and hypertension modulate the ventilatory responses to hypoxemia (and hypercapnia). This so-called ventilatory baroreflex increases the operating point of the ventilatory response to hypoxemia (and hypercapnia) during hypotension and it decreases the operating point of the ventilatory response to hypoxemia (and hypercapnia) during hypertension.70
Although the physiologic effects of hypoxia are graded, the damaging effects are sudden.71 A remarkable degree of arterial hypoxemia is required to cause tissue hypoxia.25 In clinical practice, Campbell25 observed that the lowest PaO2 compatible with life is 20 mm Hg (equivalent to an arterial oxygen saturation [SaO2] of 30% to 40%). Evidence of end-organ damage is difficult to demonstrate in patients with a PaO2 above 40 mm Hg (equivalent to an SaO2 of approximately 70%).25 Obviously, the duration of hypoxemia and the state of circulation (oxygen delivery) play major roles in determining the minimum PaO2 that does not cause end-organ damage or death.
The threshold PaO2 commonly used to diagnose hypoxemic respiratory failure is 60 mm Hg, which corresponds to an SaO2 of 90% (hypoxic hypoxia). PaO2 values below 60 mm Hg fall on the steep portion of the oxyhemoglobin dissociation curve, and decreases below that value are associated with precipitous falls in SaO2 (see Fig. 4-11). Although physiologically reasonable, for self-evident ethical reasons, the 60 mm Hg (PaO2) threshold cannot be validated experimentally.
The main concern with hypoxemia is impaired tissue oxygenation, especially of the heart and brain. The factors determining oxygen supply to the tissues include hemoglobin concentration, SaO2, the affinity of hemoglobin for oxygen (P50), cardiac output, regional oxygen consumption-to-perfusion relationships, and the diffusion of oxygen from the capillary to intracellular sites. The amount of oxygen delivered to the tissues is calculated as
where arterial oxygen content (CaO2) is calculated as
Even with a satisfactory PaO2, tissue hypoxia may arise because of decreased CaO2 (e.g., decreased hemoglobin concentration or decreased hemoglobin function, such as in carbon monoxide poisoning or anemic hypoxia), decreased oxygen delivery (e.g., cardiogenic shock or stagnant hypoxia), and decreased capacity of the tissues to use oxygen (e.g., sepsis, cyanide intoxication, or histotoxic hypoxia). Otherwise stated, tissue hypoxia can be present despite adequate PaO2, or it can be absent despite an abnormally low PaO2.59
Peripheral chemoreceptors (carotid and aortic bodies) detect changes in arterial oxygen. Within seconds after the onset of hypoxia, they initiate reflexes that are important for maintaining homeostasis.72–74 The aortic bodies play a minor role in modulating spontaneous respiratory activity, although they have a discernible effect when their gain is increased by hypercapnia.75
Hypoxia augments sensory discharge from the peripheral chemoreceptors, which, in turn, send neural impulses to the respiratory centers (inspiratory neurons of the dorsal respiratory group and ventral respiratory group76), causing an increase in the  .72,73,77,78 Hyperpnea, in turn, activates pulmonary afferents, thereby buffering the sympathetic response to hypoxemia.79
The ventilatory response to progressive hypoxia is hyperbolic72 and increases in the presence of concurrent hypercapnia75 (Fig. 4-13). It decreases with age.80 Chronic hypoxia may induce a reduced ventilatory response to hypoxia in patients with COPD,75 although the role of airway narrowing in producing this effect cannot be excluded.75
Figure 4-13
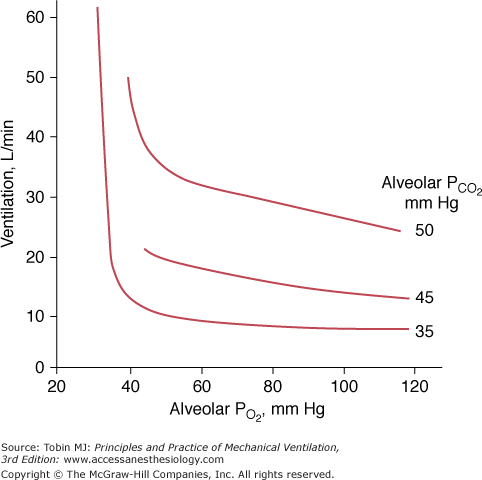
Relationship between ventilation and alveolar pressure of oxygen (PO2) at various levels of alveolar carbon dioxide (PCO2). The ventilatory response increases with the increase in PCO2. At alveolar PCO2 35 mm Hg, ventilation exhibits virtually no increase until alveolar PO2 falls below 40 mm Hg and, thereafter, ventilation increases abruptly.
The ventilatory response to hypoxemia is attenuated or abolished in patients who have undergone surgical excision of the carotid bodies.73,74,78,81 The increase in ventilation in response to hypoxemia probably contributes to coronary vasodilation.82 Stimulation of the carotid bodies with nicotine under normoxic conditions causes an increase in ventilation and coronary vasodilation.82 Coronary vasodilation does not occur if the increase in ventilation is prevented by general anesthesia.82
Hypoxic stimulation of chemoreceptors triggers reflex adrenergic vasoconstriction in muscle and coronary vasodilation but does not elicit a reflex response in the cerebral vessels.74,79,82,83 Hypoxia also causes local vasodilation.72,79 The net effects are increases in heart rate, cardiac output (resulting from the positive chronotropic effect of hypoxemia, not increased stroke volume84), pulmonary artery resistance,85 and cerebral and coronary blood flow.74,79,80,82–84 Hypoxemia fails to increase systemic blood pressure84 or increases it very modestly (<10 mm Hg rise in systolic and diastolic pressures).77 The increase in blood pressure, but not in heart rate, is absent in patients in whom the carotid bodies are inactivated.74,77 Persistent tachycardic response to hypoxemia in patients with bilateral carotid body ablation likely is mediated by the effect of hypoxemia on the aortic bodies.72
Tachycardia caused by hypoxemia is mediated by multiple factors, including CNS-mediated sympathetic discharge, effect of PO2 on the cardiac pacemaker, and concomitant hyperpnea.77 These mechanisms presumably override the cardioinhibitory signals (bradycardic effect) from the carotid body.77 The importance of hyperpnea in overriding the bradycardic effect is supported by the observation that hypoxemia combined with cessation of lung inflation (sleep apnea,86 breath holding,87 or neuromuscular blockade during intubation88) or diminution of lung inflation (such as when hyperpnea is prevented by controlled ventilation89,90) is more apt to produce bradycardia than tachycardia.72,86 Bradycardia results from the concurrent activation of the carotid bodies by hypoxia and increased cardiac vagal activity induced by apnea.79,83 The increased vagal activity (induced by apnea) can be so intense as to induce bradycardia in the absence of coexisting hypoxemia; this response has been described in patients with spinal cord injury within seconds of discontinuation from a ventilator.91 Simultaneously with the increase in cardiac vagal activity, diminution of lung inflation causes marked potentiation of the sympathetic vasoconstrictor response to hypoxemia (secondary to the lack of inhibitory influence of the pulmonary stretch receptors).83 (This combination of sympathetic vasoconstriction and vagal bradycardia constitutes part of the diving reflex.83)
Severe hypoxemia is not tolerated by the CNS because it has a high rate of oxygen consumption and lacks alternative energy reserves.92 Therefore, severe hypoxemia causes cerebral depression.73 Patients with cerebral hypoxia develop bradycardia, hypotension,88 and hypoventilation,93 which further worsens hypoxia and induces a potentially lethal vicious cycle.
Physicians commonly view cyanosis as the hallmark of hypoxemia.72 Cyanosis is recognized as a blueness of the capillary blood visible through the mucous membranes or skin, where capillaries are numerous and close together and the tissues over them are thin and transparent, such as the lips (central cyanosis) and nail beds.72
Based on the classic work of Lundsgaard and Van Slyke, it is widely believed that central cyanosis represents the presence of at least 5 g/dL of deoxygenated hemoglobin in the blood of the capillaries.94 Because the arteries and most of the veins are so far away from the skin, their content cannot influence skin color.94 Importantly, it is the quantity of reduced hemoglobin per deciliter of capillary blood, not the relative lack oxygenated hemoglobin, that produces the blue coloration of cyanosis.95 Lundsgaard and Van Slyke demonstrated the crucial effect of hemoglobin on the development of cyanosis.94 When hemoglobin is 15 g/dL, cyanosis reflects an SaO2 of 78%. In an anemic patient with a hemoglobin of 9 g/dL, cyanosis will not occur until SaO2 falls to 65%, whereas in a polycythemic patient, with a hemoglobin of 18 g/dL, cyanosis will occur at a SaO2 of 83% (Fig. 4-14). In addition to hemoglobin, detection of cyanosis also depends on variables such as thickness and opacity of the skin and perfusion status, as well as on the visual skills of the observer.96,97 In seventy-two patients who had SaO2 values ranging between less than 75% and 100%, agreement among three observers was only 69% when inspecting the tongue, 61% when inspecting the lips, and 53% when inspecting the nail bed.97 In that study,97 cyanosis of the tongue and lips was recorded in 40% to 45% of patients with normal SaO2 values. Rather than a blue or pink color, pallor is seen with both anemia and shock. Thus, severe or fatal tissue hypoxia may occur without cyanosis.72
Figure 4-14
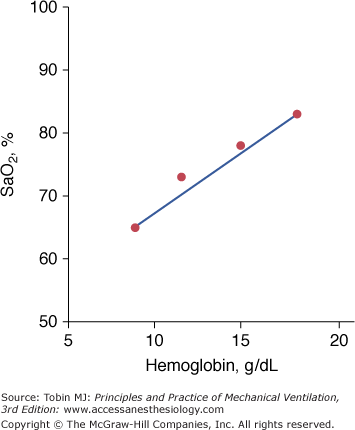
The dependence of cyanosis—resulting from the presence of 5 g of reduced hemoglobin per deciliter of capillary blood—on prevailing hemoglobin. In anemic patients, cyanosis signifies more severe hypoxemia than in a polycythemic patient. (Based on data from Lundsgaard and Van Slyke.94)
Acute hypoxemia increases respiratory frequency, tidal volume, and  in almost all subjects.72 Increases in
  , however, are an unreliable guide because the interindividual response is considerable.96 The standard deviation for the within-subject variability in day-to-day hypoxic ventilatory response is approximately 22%.98 The respiratory response to mild or moderate hypoxemia may be barely measurable or absent.72 An increase in heart rate is equally of limited value because many other factors, such as fever, low blood pressure, pain, apprehension, and drugs, can cause it to rise.72 Moreover, under specific circumstances (see “Cardiovascular Responses” above), hypoxemia causes bradycardia rather than tachycardia. Hypoxemia tends to increase systolic blood pressure in some subjects; the wide variations in response77 renders arterial pressure of little value in the diagnosis of hypoxemia.72
The metabolic needs of the brain largely depend on oxidation of glucose to CO2 and water.92 The brain cannot store oxygen. It survives only for minutes after the supply is reduced to critical levels.92 In acute anoxia, consciousness is lost within 15 seconds. The electroencephalogram slows with a PaO2 of less than 35 mm Hg or with blood flow of less than 40% of normal.92 Loss of the electroencephalogram tracing occurs when cerebral PO2 reaches 20 mm Hg or following 20 seconds of complete anoxia.92
In the absence of defects of cerebral blood flow, PaO2 below 40 mm Hg is required to produce prominent symptoms (Table 4-3).24,99,100 Confusion and delirium (resembling alcohol intoxication) appear at PaO2 values of 35 to 50 mm Hg.65 Tremors and asterixis (flapping tremor elicited by dorsiflexing the wrists with the arms outstretched and caused by a momentary interruption of normal continuous action potentials to both flexor and extensor muscles) are infrequent even when the PaO2 is less than 40 mm Hg.24,25 Somnolence and obtundation occur at PaO2 values of 25 to 35 mm Hg. Some patients develop myoclonic jerks (bursts of excitation to resting muscles) and seizures.24 At approximately 25 mm Hg, consciousness is lost,65 and death often ensues.
| PaO2, mm Hg | Signs and Symptoms of Hypoxia |
|---|---|
| 35 to 50 | Loss of critical judgment, confusion, delirium (resembling alcohol intoxication), tremors, asterixis |
| 25 to 35 | Somnolence, obtundation, myoclonic jerks, seizures |
| 20 to 25 | Loss of consciousness |
| < 20 | Death |
When considering the neurologic manifestations of hypoxemia, PaO2 is only a small part of a complex situation. A decrease in PaO2 may be well tolerated if oxygen delivery is maintained by the combination of increased cardiac output and systemic vasoconstriction.101 These compensatory mechanisms, however, can be overwhelmed by anemia or carbon monoxide poisoning, which decrease oxygen-carrying capacity (anemic hypoxia), or by atherosclerosis or other causes of vascular occlusion (ischemic hypoxia) in which the increased cardiac output does not suffice to prevent tissue damage.
Hypercapnic respiratory failure is a state in which ventilation is insufficient to maintain a normal PaCO2 for the level of metabolic activity (measured by CO2 production,  ).1 Common causes include COPD, severe asthma, conditions where respiratory motor output is decreased (e.g., neoplasm and infections of the CNS, medications, and drugs), neuromuscular-skeletal diseases (e.g., myasthenia gravis, Guillain-Barré syndrome, and trauma), and upper airway obstruction.
Under steady-state conditions, the relationship between PaCO2, alveolar ventilation ( ), and
  is given by the equation
The constant K is usually stated as 0.863; it converts measurements of  from standard conditions to body-temperature conditions. The term
  represents the portion of
  that reaches the terminal gas-exchange units and is calculated as
where VD equals dead space ventilation. A reduction in  may result from an inadequate
  or an increase in VD (resulting from an increase in true VD or a functional increase in VD secondary to lung regions with high
  relationships).
The mechanisms responsible for hypercapnia can be grouped into two categories, depending on whether there is (or is not) an increased A-aDO2. In pure alveolar hypoventilation (e.g., neuromuscular diseases, drug overdoses, and CNS pathologies), A-aDO2 is usually normal (unless lung abnormalities are present). In disorders associated with  inequality (e.g., COPD and ARDS), A-aDO2 is increased.
PaCO2 in excess of 90 mm Hg is unlikely in patients breathing room air because the concomitant degree of hypoxia is incompatible with survival.25 Such PaCO2 values can occur if a patient is breathing oxygen-enriched air.102
Hypercapnia elicits autonomic and ventilatory responses primarily through central chemoreceptors located in the rostral ventrolateral medulla.74 These respond to changes in hydrogen ion concentration.74 Hypercapnia, probably via a reduction in intracellular pH, also stimulates peripheral arterial chemoreceptors located in the carotid bodies, aortic bodies, and abdomen.103,104 Only 15% to 30% of the ventilatory response to hypercapnia results from peripheral chemoreceptor stimulation.105,106 Not surprisingly, the PaCO2 of patients with bilateral resection of the carotid bodies is higher (by 4.6 ± 1.3 [SD] mm Hg) than in healthy subjects.81
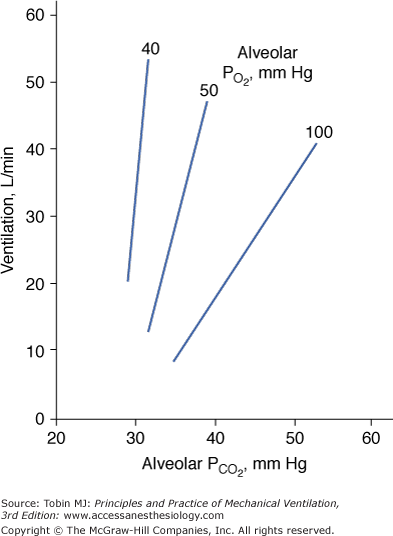
Hypercapnia causes an increase in  ; stimulation peaks with an inhaled CO2 of 10%.107 In contrast to the hyperbolic response to progressive hypoxemia (see Fig. 4-13), the hypercapnic ventilatory response is linear (Fig. 4-15).72 The ventilatory response to CO2 is enhanced in the presence of hypoxia or metabolic acidosis108 and decreases with age.80
Related posts:


Stay updated, free articles. Join our Telegram channel

Full access? Get Clinical Tree


