Fig. 55.1
Stuart Cullen demonstrated inhalation anesthesia in Copenhagen to Ralph Waters and several of the Danish anesthesia faculty of the World Health Organization Anesthesia training course for 3rd world doctors in 1951. Absence of monitoring equipment is notable. (Courtesy of the author’s collection.)
In the 1950s, ether and cyclopropane flammability precluded the use of most electrical apparatus near the patient. Operating rooms in the US and elsewhere had conductive floors, and anesthesia machines had chains or wires touching the floor to discharge static charges. To avoid explosions, ECG monitoring required construction of a pressurized cathode ray tube electrocardiograph in a bullet-like cylinder, supplied with a bicycle tire pump to sustain its internal pressure. Low voltage thermistors in flexible catheters were used to monitor rectal or esophageal temperature in the early days of hypothermic anesthesia for cardiac and neurosurgery. Non-electrical ventilatory volume monitors became incorporated in some new anesthesia machines, particularly if artificial ventilators were used.
Introduction of the transistor in 1954 removed the danger of sparks and permitted low voltage amplifying devices to be used, thus initiating the modern use of monitoring. The introduction of curare and other muscle relaxants, the poliomyelitis epidemics of the 1950s, positive pressure ventilators, cardio-pulmonary bypass, and of course, the fatality rate, stimulated development of monitoring devices.
Airway Monitoring of Respiratory and Anesthetic Gases
Capnometry
John Tyndall (1820–1893) Professor of Natural Philosophy at the Royal Institution, was the first to discover and report that CO2 gas absorbs infra red light [3]. He built a device to measure this absorption. August Pfund (1879–1949) developed an analyser in 1939, to measure concentrations of carbon dioxide and carbon monoxide [4]. Radiation from a heated nickel chrome wire was directed through a sample cell into a detector cell containing a 3% carbon dioxide mixture, where the temperature was measured. The presence of carbon dioxide in the sample cell caused less radiation to reach the detector cell resulting in a smaller rise in temperature.
Karl Luft (1909–1999) deserves the credit for developing the modern infrared capnograph. Working with the German BASF company in 1937, he invented a clever principle to detect the infra-red (IR) light passing through an unknown gas sample [5]. His “Luft cell” incorporated two IR light sources, one beam directed through a reference cell, the other through a sample cell filled with a stream of the unknown gas (Fig. 55.2). The IR light beams then entered a two-chambered detector cell, each containing 3% CO2. The relative heating induced by the incoming IR light beams moved a membrane separating the two chambers. An electrical capacitance sensor detected the membrane motion. The IR beams were “chopped” by a rotating shutter, providing an AC signal proportional to the decrease in IR light entering the detector on the sample side.
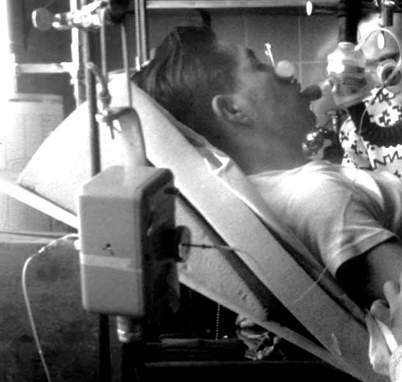
Fig. 55.2
Luft CO2 detector principle was used in Beckman infrared CO2 analyzers for research and operating room use, 1950. (Courtesy of the author’s collection.)
Shortage of components before and during World War II limited the manufacture of Luft cells to several hundred. Some were used for environmental monitoring in submarines. Others, stored in salt mines, were confiscated and removed to the US and England after the war. The Germans also telescopically tracked their buzz-bombs by the CO2 absorption of IR light from the exhaust of the bomb.
In the 1950s, an infra-red respiratory CO2 analyzer was designed by Max Liston (1924–2004) using German patents confiscated at the end of WWII. He was guided and encouraged by James Elam (1918–1995) and associates to apply it to operating room monitoring [6]. The Beckman Co. marketed the capnograph. Like the ECG bullet, its cast aluminum “head” near the airway was pressurized. The unpressurized capnograph amplifier control was supposed to be mounted at least 6 ft above the OR floor, a rule that assumed leaking explosive agents were heavier than air thus settling at a lower level.
The device was widely used for research but little used for patient safety monitoring. In the 1960s, the Beckman LB-1 capnometer was modified to analyze N2O, ether, halothane or other anesthetics, for research (only one gas per instrument) [7].
Multi-Patient Anesthetic Mass Spectrometry
Francis Aston (1877–1945), a student of Joseph (JJ) Thomson (1856–1940) at the Cavendish Laboratory at Cambridge, devised the first mass spectrometer to separate isotopes of elements in 1919. Aston was awarded the Nobel Prize in Chemistry in 1922 for his discovery. A mass spectrometer ionized substances (in a vacuum) and accelerated a beam of charged particles (elements or compounds). The beam passed through a magnetic field to bend and separate heavier from lighter particles, each weight being collected in separate metal cups from which the ion current was measured. For respiratory gas studies, an extremely small leak continuously admitted a stream of sample gas into the ionizer, providing continuous concentration information.
In the late 1950s, in order to continuously monitor many artificially ventilated ICU patients (particularly polio victims suffering from long term paralysis), several institutions used a single centrally located respiratory mass spectrometer connected through long sampling catheters to the airways to provide sequential and frequent analysis of inspired and end tidal PCO2 [8]. The data were typically displayed on the central nursing desk. N Davies and D Denison [9] investigated the performance of long sampling catheters, and concluded that they introduced no important errors.
Mass spectrometers could also analyze inhalational anesthetics, but were too expensive and too difficult to maintain for continuous use in each operating room. However, the monitoring cost per patient could be reduced significantly by using one mass spectrometer for many patients, as in the ICU systems. In the mid 1970s at UCSF, Gerald Ozanne (1941-), Bill Young (1954-) and I installed a single mass spectrometer to sequentially sample airway gases from each patient in the 10 room OR suite of Moffitt Hospital [10]. Long nylon catheters were installed thru the OR ceilings. Young, a recent Oberlin college graduate with talents in both physical chemistry and computer programming, enthusiastically took on the design and programming tasks. We found that patient airway gases could be continuously and slowly sampled from each patient through 30 m long catheters, accurately storing in the catheters about 20 sec of data. When a catheter was switched to the mass spectrometer inlet, gas stored in the catheter was drawn into the mass spectrometer within 6 sec by a lower pressure. The inspired and end tidal concentrations of respiratory gases and the anesthetic vapor were reported on a display in each OR about once per minute (Fig. 55.3). In each OR, by default, the display was a time plot of 30 min of end tidal PCO2 and halothane %, and a table of current values of all sampled end-tidal gases. The mass spectrometer terminal in each operating room became a communication system before the Web. It permitted Bill Young to monitor each operating room after he moved to New York. He called me one day, worried about operating room 5. I called the attending anesthesiologist and said, “New York wants to know why your patient in room 5 has a PCO2 of 80.”
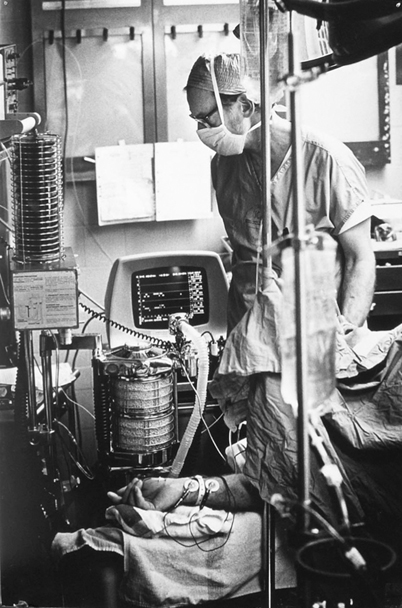
Fig. 55.3
Mass spectrometer anesthetic and respiratory gas analysis operating room display screen in Moffitt Hospital with author, 1978. (Courtesy of the author’s collection.)
Anesthetists at UCSF became dependent on (addicted to) this device. So did researchers. A couple of things flowed from this dependence. One was a demand for such analysis by other institutions. At one point, several hundred of these multiplexed multi-OR systems were in use at institutions, mostly in the U.S. The second was that the device needed competent technician care and was susceptible to occasional breakdown, affecting all the operating rooms. Not good for anesthetists addicted to minute by minute analyses of anesthetic concentrations. This stimulated various manufacturers to develop cheaper stand-alone respiratory gas monitors, using the infrared principle already described.
Infrared Analyzers
The absorption spectrum of each anesthetic vapor is unique, especially in the far IR band from 8–9 µm wavelength. The technology for inhaled anesthetic analysis was slowly improved, primarily by the Datex Co, until mixtures of several halogenated vapor anesthetics, CO2 and N2O could be successfully analyzed with a single Luft type IR detector cell, including correcting for overlap of the IR absorption peaks [11]. With the addition of an internal polarographic O2 electrode, end-tidal gas monitoring in every operating room became widely employed. These monitors were less expensive to maintain than the mass spectrometer systems, a failing unit could rapidly be replaced, and only affected one OR. By 1995, multiplexed mass spectrometers had been replaced by stand-alone infra-red gas analyzers [12].
Blood Gas Analysis
Gas Bubble Analysis
In 1801, John Dalton (1766–1844), the Quaker English chemist, meteorologist and physicist, observed that the total pressure exerted by a mixture of gases is the sum of the “partial pressures” of each component gas. In 1803, he described the role of partial pressure in absorption of gases by water and other liquids. The concept of partial pressures gradually stimulated interest in measuring the partial pressures of oxygen (PO2) and carbon dioxide (PCO2) in blood in the late nineteenth century. In 1872, Eduard Pflüger (1829–1910) in Bonn equilibrated a small gas bubble with a large volume of blood at body temperature, and then analyzed the O2 and CO2 in the bubble using volume loss by chemical absorption [13]. Bubble analysis was developed into a clinical and laboratory method in 1945 by Richard Riley (1911–2001) [14]. He used a specially adapted syringe with a capillary attached, that had been invented by FJW (Jack) Roughton (1899–1972) and Per Scholander (1905–1980) during World War II [15]. Riley’s method worked reasonably well for PCO2, but poorly for PO2, especially for blood nearly saturated with oxygen.
Acid Base Balance and Carbon Dioxide
Even before Robert Boyle’s time in the 1660s, fermentation and respiration were recognized as producing “fixed air” or “gas”, early names for CO2. The alchemists had used acids and bases in the middle ages, and in Paris, Hilaire-Martin Rouelle (1718–1779) discovered the alkalinity of blood, using titration and color indicators. In 1831, William O’Shaughnessy (1809–1889), an Irish physician working in India, showed that the major pathologic effect of cholera was loss of blood “free alkali” [16]. In 1877, Friedrich Walter (1850-?) established the relationship between the carbon dioxide content of blood and its alkalinity in his 1877 thesis, while studying in Strasbourg under fellow Latvian, Oswald Schmiedeberg (1838–1921) [17]. Walter’s finding made it possible to measure a patient’s abnormality of alkalinity (now called metabolic acid-base balance) by analyzing blood carbon dioxide content.
Methods Underlying Blood Gas and Acid Base Analysis
The electrodes now used for rapid analysis of oxygen, CO2 and pH, and all the derived acid-base balance data, come from the science of physical (electro) chemistry, born in the 1880s by two discoveries; ionization and osmotic pressure theory.
Ionic Theory and the Hydrogen Ion
Jacobus van’t Hoff (1852–1911) initiated the development of electrochemical theory in 1889, by discovering that the long known gas laws applied to osmotic pressure [18]. The concept of ionization of salts into cations and anions, although first suggested by Michael Faraday (1791–1867) in 1830, was thought to be imaginary until 1887, when Svante Arrhenius (1859–1927) in Uppsala published a thesis proving, by measuring solution conductivity, that some salts dissociated as their concentration was reduced [19]. His discovery was the first to link acid strength to the hydrogen ion concentration. It stimulated Wilhelm Ostwald (1853–1932) to make the first electrometric measurement of H+ ions by the potential on a platinum electrode in solutions saturated with hydrogen gas [20]. By combining the van’t Hoff osmotic theory with the new ionic theory, Ostwald’s student, Walter Nernst (1864–1941), discovered the energetic equivalence of Faraday’s constant, F, to the gas laws, thereby mathematically linking electrometric ion activity to the behavior of gases [21]. For these discoveries, Nobel prizes in chemistry were awarded to van’t Hoff (1901), Arrhenius (1903), Ostwald (1909), and Nernst (1920).
Introduction of pH for Hydrogen Ion Activity
Søren Sørensen [22] (1868–1939) proposed the term pH, the negative logarithm of H+ concentration, as a simplification. The pH terminology quickly came to be used more than nanomoles of hydrogen ion concentration because the behavior of a substance in a chemical system is proportional to its energy (chemical potential), a logarithmic function of the activity (or concentration) of the substance. A pH electrode responds to the chemical potential of H+, and thus the instrument provides a precise and readily obtained measurement of the chemical behavior of H+.
Development of the Glass pH Electrode
In 1906, Max Cremer (1865–1935) discovered an electrical potential across thin glass membranes, proportional to the acid concentration difference on each side, implying that the glass is actually permeable to H+ ions[23]. By 1909, glass H+ ion (pH) electrodes had been constructed [24]. In London in 1925, Phyllis Kerridge built the first blood pH electrode designed to prevent CO2 escape from the sample [25]. Corning Glass marketed the first precise pH glass capillary electrode in 1932, and it was still the best when I started a blood gas laboratory at NIH in 1953 [26].
Buffers: The Relationships of Bicarbonate, Hydrogen Ion and Carbonic Acid
In 1907, the remarkable ability of blood to neutralize large amounts of acid, led Lawrence Henderson (1878–1942), then an instructor in biochemistry at Harvard University, to investigate the relationship of bicarbonate to dissolved carbon dioxide gas, and how they acted as buffers of fixed acids [27]. It was his insight that helped chemists and physiologists realize that when acids are added to blood, the hydrogen ions react with blood bicarbonate, generating CO2 gas that is then excreted by the lungs, almost eliminating the increased acidity. The computer equations in all modern blood gas analyzers derive from Henderson [28] who rewrote the laws of mass action for weak acids and their salts, in the case of carbonic acid as: k=[H+][HCO3 −]/[H2CO3]. In 1917, Karl Hasselbalch (1874–1962) converted Henderson’s equation to log form, the Henderson-Hasselbalch equation, pH=p′+log[HCO3−/(S.PCO2)] [29].
Until the mid 1950s, PCO2 was computed from this equation by measuring the blood pH and plasma CO2 content using the manometric apparatus developed by Donald van Slyke (1883–1971), head of the laboratory at the Rockefeller Institute in New York [30].
The World Wide 1952 Polio Epidemic Leads to Blood Gas Analysis
Severinghaus’ Memories of Ibsen, Astrup and the Polio Epidemic
I was invited by Bjørn Ibsen (1915–2007; Fig. 55.4) to dine in his apartment with his wife, shortly after arrival for my first sabbatical in Copenhagen, in 1964–5. I was there to study the possible active transport of something, presumably HCO3 −, across the blood brain barrier to account for the rapid reduction in CSF HCO3 − and relatively constant, slightly increased pH found during altitude acclimatization. I had met Poul Astrup (1915–2000; Fig. 55.5) in London in December, 1958, at the Ciba Symposium on blood gas analysis organized by John Nunn (1923-). I collaborated with Astrup and Ole Siggaard Andersen (1932-) on acid base problems, and taught 3rd world WHO anesthesia students in an ongoing program, mostly taught by well trained Danish anesthesiologists (Fig. 55.6).
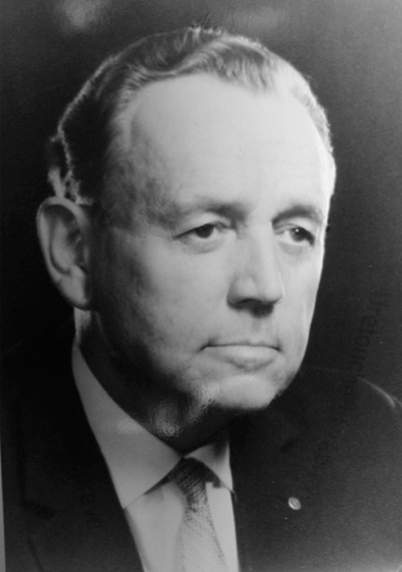
Fig. 55.4
Bjørn Ibsen, creator and director of world’s first intensive care unit during the 1950’s polio epidemic in Copenhagen. (Courtesy of the author’s collection.)
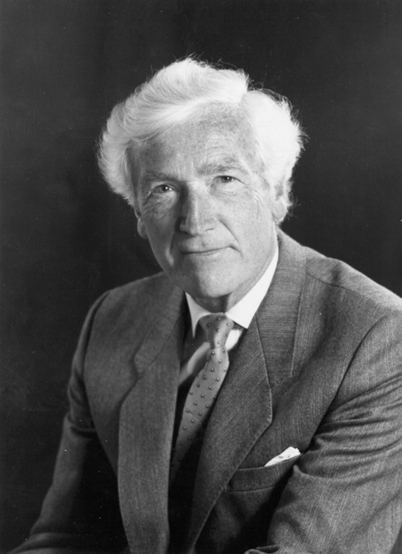
Fig. 55.5
Poul Astrup, who invented a new method to analyze blood PCO2 in response to the need to control artificial ventilation during the polio epidemic. (Courtesy of the author’s collection.)
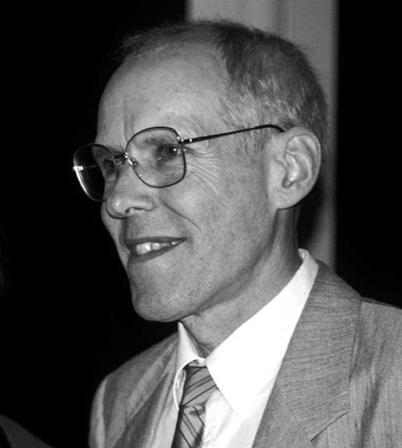
Fig. 55.6
Ole Siggaard Andersen, student of Astrup, developer of acid-base apparatus, theory and Base Excess and Standard Base Excess definitions and terms. (Courtesy of the author’s collection.)
A vicious polio epidemic struck Copenhagen in 1952–3. Hundreds of people, especially the young, were sent for isolation to the communicable disease Blegdams hospital just across Tagensvej from Rigshospitalet. The director, Professor HCA Lassen, was overwhelmed. He and his associate Mogens Bjørneboe had not understood the cause of many deaths. High CO2 concentrations in blood samples led him to assume that the patients were somehow developing a metabolic alkalosis.
After a suggestion from Bjørneboe, Lassen asked Ibsen, a young anesthesiologist (who had trained at the Massachusetts General Hospital) at Rigshospitalet to help. Ibsen, looking at the blood studies, that did not include pH, realized that the diagnosis was not metabolic alkalosis but hypoventilation, with CO2 retention and resulting severe hypoxia [31]. Blegdam hospital had only one iron lung and some almost useless cuirass ventilators. Ibsen initiated ventilation in a 12-year-old girl (Fig. 55.7), at first by an anesthesia bag and mask, then later ventilation powered by hand via a tracheotomy. She survived.
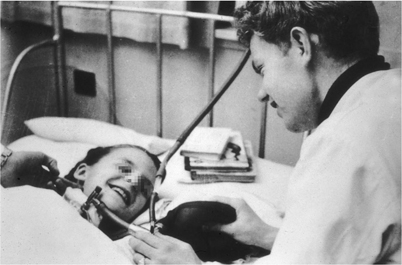
Fig. 55.7
A smiling 12 year-old polio patient ventilated via a tracheostomy by a medical student. (Courtesy of the author’s collection.)
Ibsen was not sure how much ventilation the patients needed. He asked Poul Astrup for help by determining what the arterial PCO2 was in some of the patients in order to guide adjustments needed to maintain PCO2 at the normal level of 5% (or 40 mm Hg). Astrup was a young clinical chemist in charge of the laboratory at Rigshospitalet. He had no routine way of measuring PCO2 but knew the method: Measure arterial pH, and measure plasma or serum CO2 content using a Van Slyke manometric analyser. Compute PCO2 by the Henderson-Hasselbalch equation, formalized in Copenhagen 35 years earlier by Hasselbalch.
Astrup knew that the pH of blood must be measured at body temperature. No temperature controlled pH meters were available so Astrup took his lab pH meter into his 37°C culture room, and waited while the meter and the blood sample warmed. He soon became involved in speeding up the analysis of large numbers of samples, doing arterial punctures, transporting the warm blood, in a syringe wrapped in a blanket, to his culture room, computing PCO2 and sending the result to help the student adjust the ventilation toward a more normal level.
Astrup sought a better method of measuring PCO2. His solution became known as the “equilibration method”. He modified one of Hasselbalch’s ideas: Measuring “reduced pH” after equilibration of a blood sample to 40 mm Hg PCO2. Astrup modified Van Slyke’s graph showing the linear relationship of log PCO2 to pH after equilibration of blood with differing PCO2 gases [32]. Displacement of this straight line by added acid or base permitted Astrup, and his student and associate Ole Siggaard Andersen (1932-), to estimate not only PCO2 but also the acid-base abnormality of the blood, later named base excess.
Astrup and Svend Schroeder of the Radiometer Co. designed and built an apparatus to measure pH at 37°C before and after equilibration with gases of known CO2 content. Over the next decade, it was modified by Siggaard Andersen [33], improved, marketed by Radiometer, and widely used as the “Astrup Apparatus” (Fig. 55.8). The Stow-Severinghaus PCO2 electrode gradually made it obsolete.
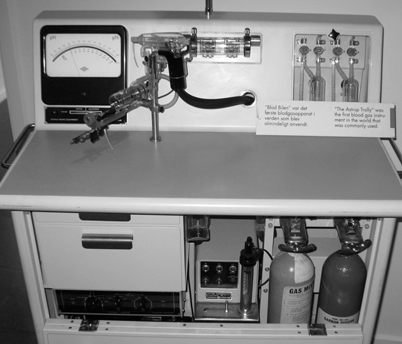
Fig. 55.8
Blood gas analyzer using the Astrup equilibration method for PCO2, with micro-capillary pH electrode and equilibrators designed by Siggaard Andersen, and the Clark electrode for PO2 analysis. “S”: sampling tip on hand-held pH electrode, also used to connect pH sample to KCl reference electrode.(Radiometer Co, Copenhagen, ~1960). (Courtesy of the author’s collection.)
Acid-Base Nomenclature
The term base excess (BE) was originally introduced to define blood metabolic (non-respiratory) acid base balance [34]. Some clinicians rejected BE because it changed with altered PCO2 as plasma bicarbonate equilibrated readily with all the body’s extracellular fluid (ECF), about 3 times the blood volume. To obtain an index independent of acute changes in PCO2, in 1966, Siggaard Andersen introduced a modified index termed Standard Base Excess (SBE) and published a modified Van Slyke equation to compute SBE now used in most blood gas analyzers [35]. SBE is nearly independent of acute changes in PCO2, and applies to the ECF of the entire body by assuming a total ECF hemoglobin concentration of 5 g/dl.
The CO2 Electrode
A CO2 electrode was first described by physiologists Robert Gesell (1886–1954) and Daniel McGinty at the University of Michigan in 1926, for use in expired air, but not in blood [36]. It used the effect of CO2 on the pH of a film of peritoneal membrane, wet with a salt solution, and wrapped over an antimony pH electrode.
In Columbus, Ohio, a physical chemist, Richard Stow (1916-), in the department of Physical Medicine, Ohio State University, (Fig. 55.9), needed to measure blood PCO2 to guide the setting of mechanical ventilators in the care of polio patients in 1951–3. In the library, he found several Macy reports about ion-specific electrodes. They triggered an idea. He knew that carbon dioxide permeated rubber freely and that it acidified water. He conceived of an electrode for measuring PCO2 using a latex film to separate a blood sample from a glass pH electrode wet with distilled water. Being an expert glass blower, he constructed his own combined glass pH and reference electrode (Fig. 55.10). He immediately confirmed that the pH electrode potential increased in response to increasing PCO2 in either gas or liquid. As he expected, pH was a logarithmic function of PCO2.
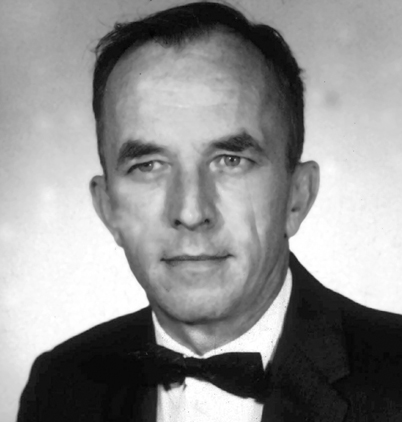
Fig. 55.9
Richard Stow, the inventor of a blood PCO2 electrode. (Courtesy of the author’s collection.)
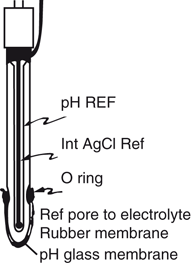
Fig. 55.10
Stow’s combined glass pH and reference electrode. (Courtesy of the author’s collection.)
In August 1954, Stow reported his design at the fall meeting of the American Physiologic Society in Madison, Wisconsin [37]. He had been unable to prevent significant drift, and therefore concluded that his electrode probably could not be useful. During the question period after his talk, I asked Stow whether he had considered adding bicarbonate to the distilled water electrolyte. He said he had assumed that bicarbonate was a buffer that would prevent any change of pH when PCO2 varied. I realized that, despite his doctorate in physical chemistry, Stow clearly did not grasp the differences between fixed and volatile buffering systems. We agreed that I would construct and investigate a CO2 electrode with a bicarbonate electrolyte [38].
A few days later, using a Stow type pH and reference electrode, I found that a 25 mM sodium bicarbonate electrolyte solution stabilized the pH signal and doubled the PCO2 sensitivity such that a 10 fold change in PCO2 altered pH by almost 1 pH unit. A spacer of cellophane was needed to hold a wet film between the non-conductive rubber membrane, and the pH glass surface (Fig. 55.11). In 1959, Forrest Bird (1921-), inventor of a popular ventilator, arranged for his firm, the National Welding Co, to make my CO2 electrodes commercially available. The unpatented design concept was soon copied and marketed by Beckman, Radiometer, Instrumentation Labs and several other firms in the US, Europe and Japan.
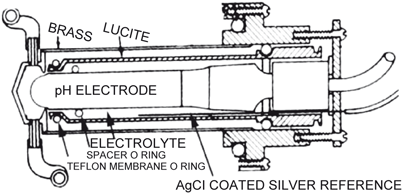
Fig. 55.11
First working PCO2 electrode, stabilized and made practical by author, 1954. (Courtesy of the author’s collection.)
The Polarographic Oxygen Electrode
The method now called polarography originated in Nernst’s laboratory in Göttingen, Germany. Nernst suggested to his assistant Heinrich Danneel (1867–1942), that he investigate the properties of single noble metal electrodes (gold, platinum) in solutions, by using large and non-polarizable reference electrodes to maintain a constant and known solution potential. Danneel soon noted that oxygen in the solution interfered with measurements whenever the test metal was cathodic (negative). In studying this, he showed that the reaction of oxygen with a negatively charged metal (cathode) was approximately a linear function of the oxygen pressure in the solution [39]. Danneel’s work was soon forgotten because the noble metal surface was easily contaminated or ‘poisoned’ by organic substances but his work had identified the basis of the polarographic oxygen electrode.
Stay updated, free articles. Join our Telegram channel

Full access? Get Clinical Tree


